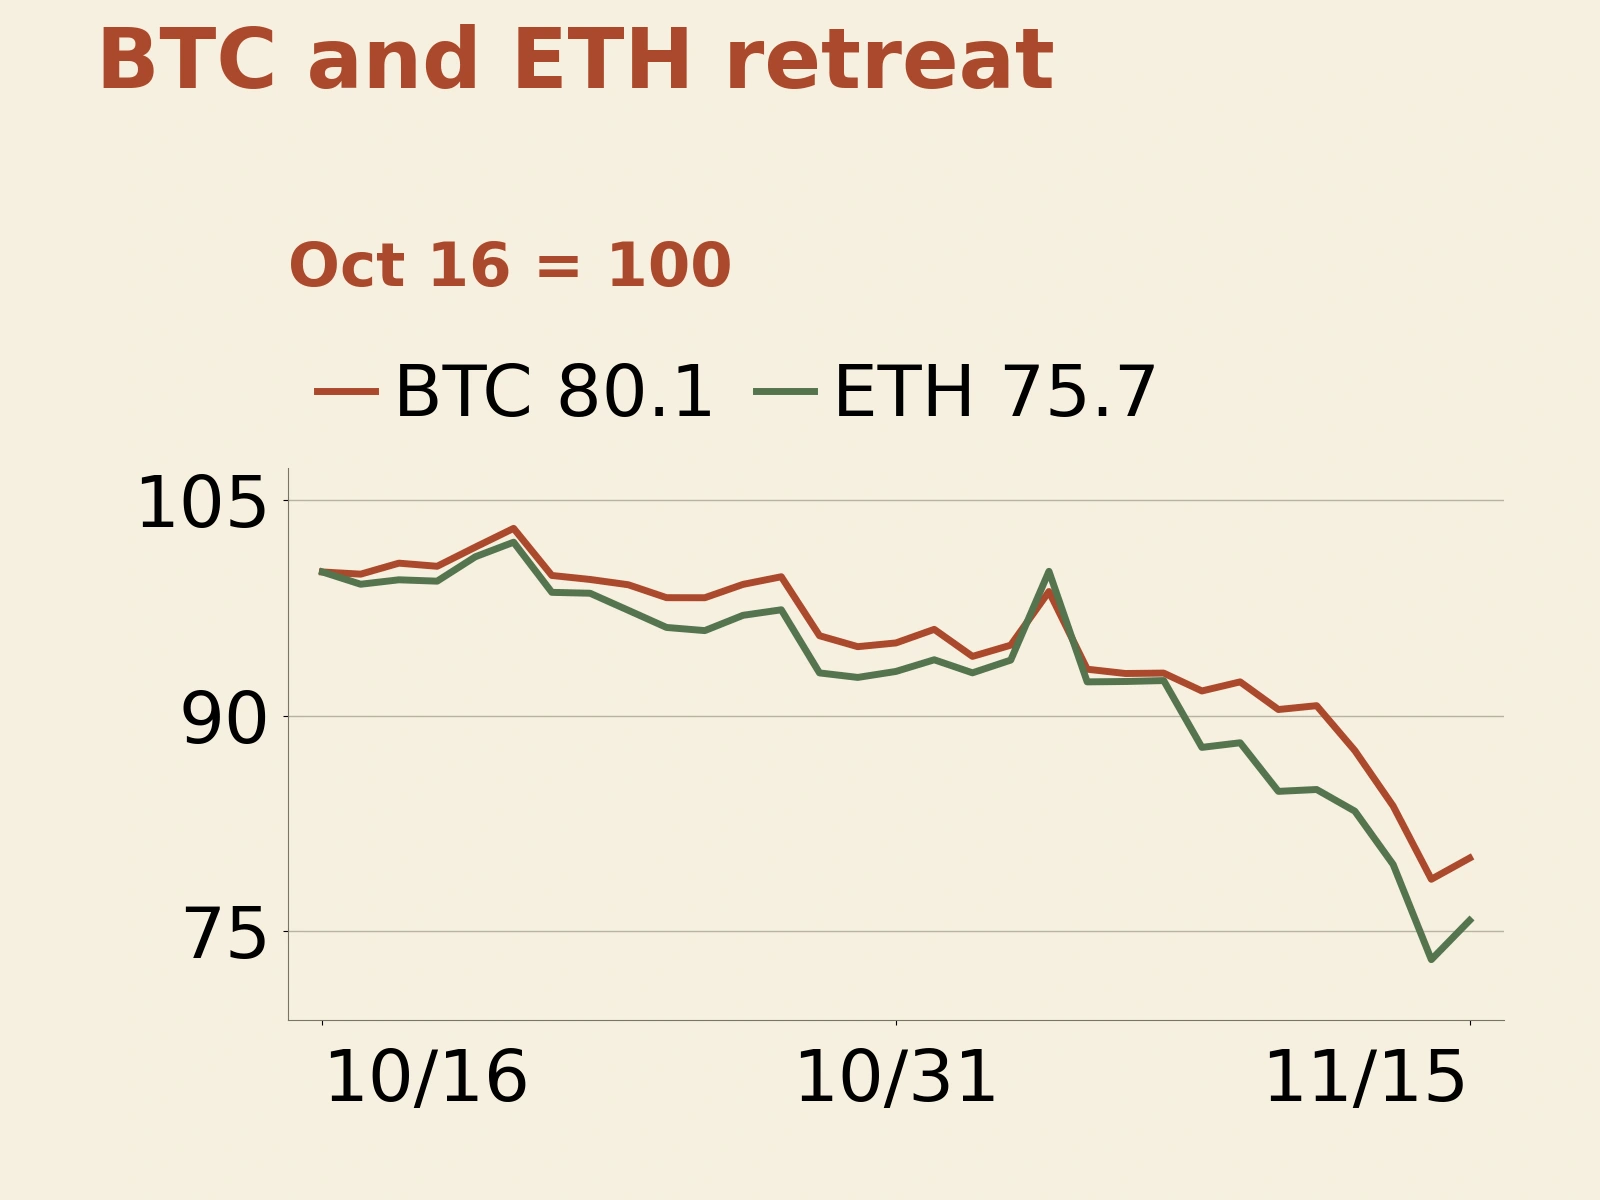
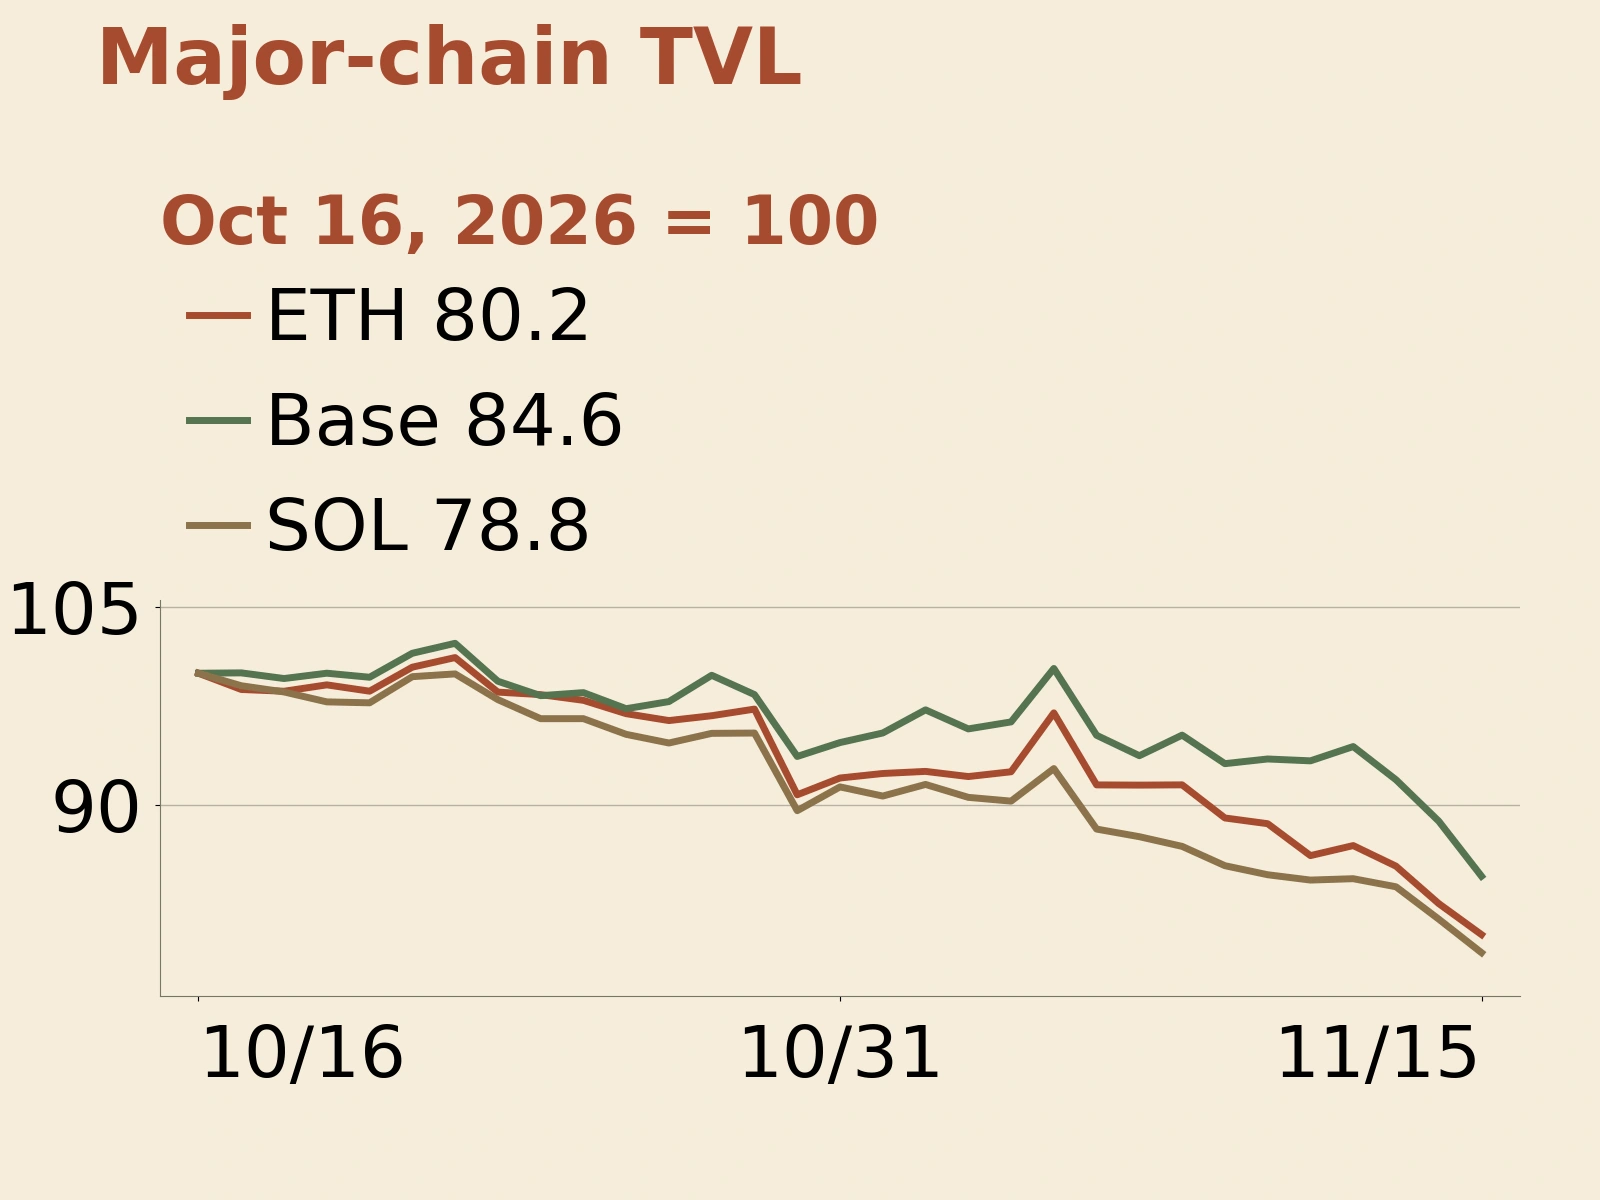
On November 13, 2026, US spot Bitcoin and Ethereum ETFs ended another week of net outflows. Across the five trading days from November 9 to 13, they recorded cumulative net outflows of $1.0653 billion and $398.9 million, respectively, for a combined $1.4642 billion. With ETFs closed over the weekend, stablecoin and derivatives data provided further evidence: the circulating supply of on-chain dollar assets declined, and falling crypto prices reduced USDT-denominated notional open interest, while positions measured in coins did not contract in tandem. Continued withdrawals of investment capital and limited deleveraging were the two main themes in this week's funding conditions.
ETFs lose $1.4642 billion; stablecoin supply falls $4.475 billion in a week

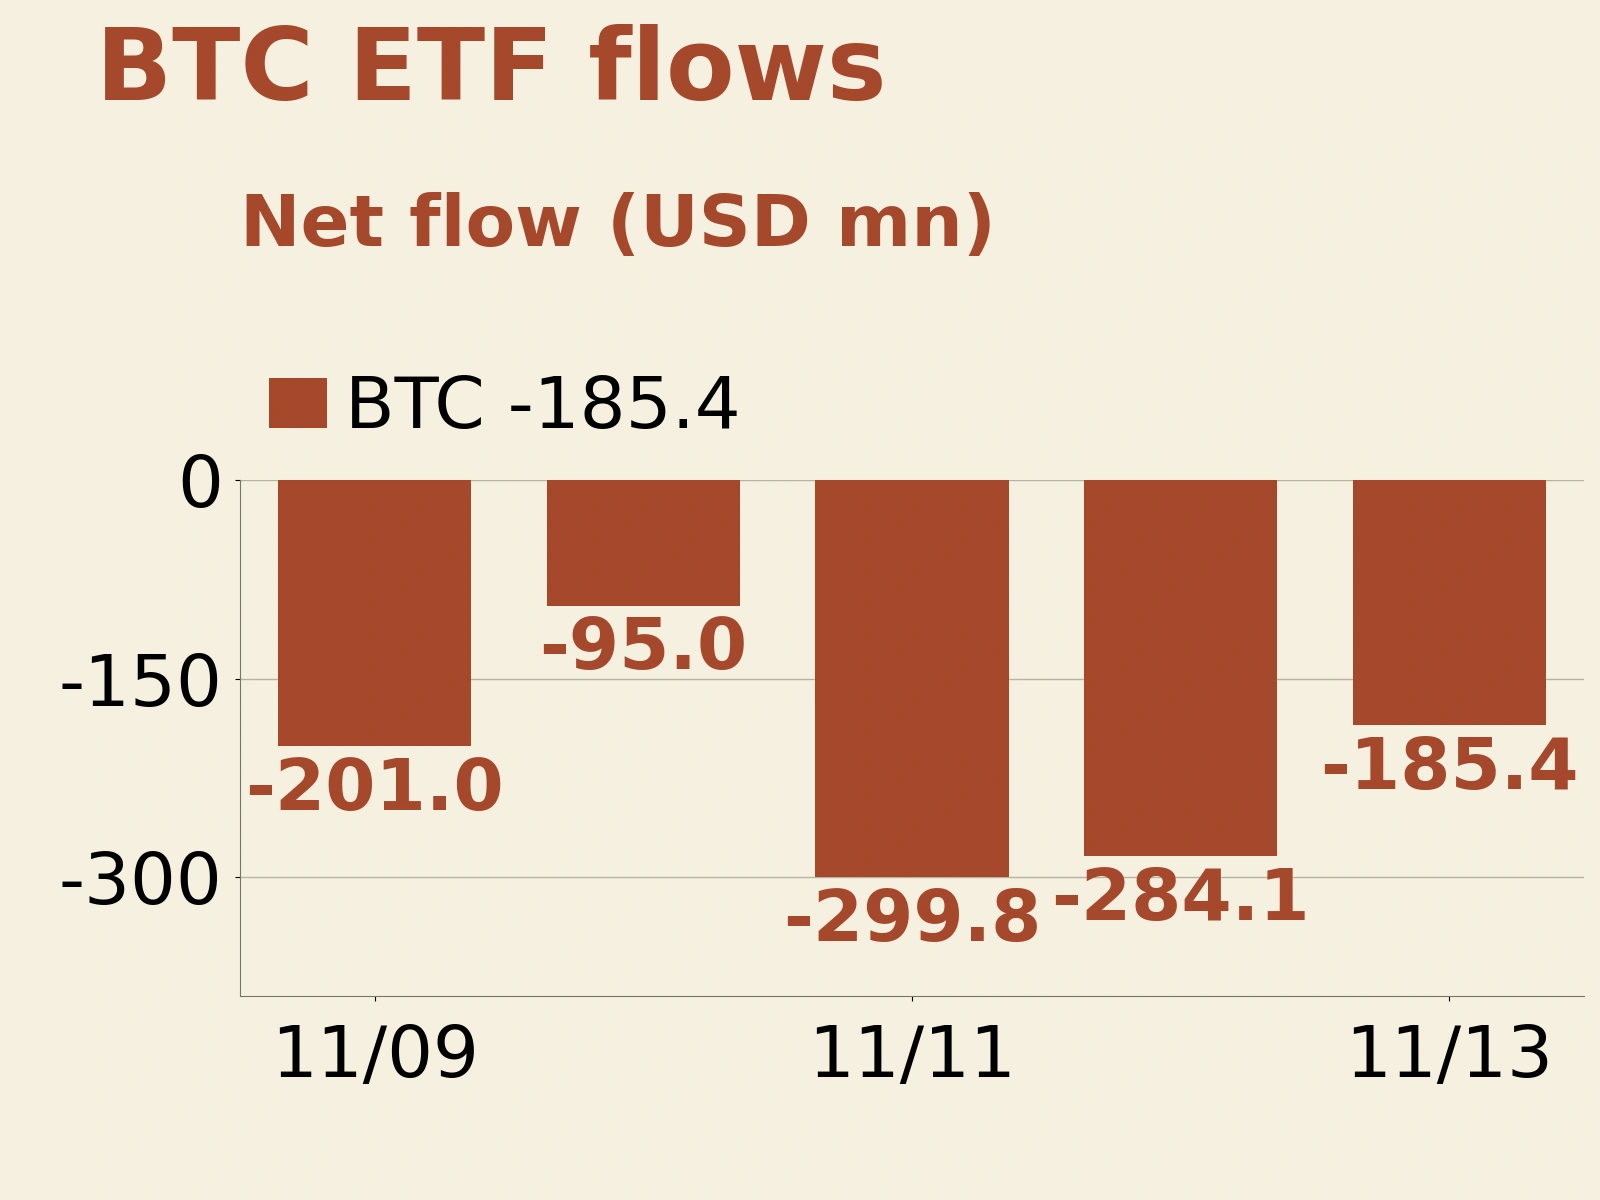
Farside's fund-by-fund data show Bitcoin ETF net outflows of $201.0 million, $95.0 million, $299.8 million, $284.1 million and $185.4 million on November 9–13, respectively, with no net inflow on any of the five trading days. The week's $1.0653 billion outflow was smaller than the previous week's $1.2817 billion. Redemption pressure eased at the margin but had yet to reverse.
Withdrawals were concentrated in large products. BlackRock's IBIT recorded net outflows of $908.4 million for the week, accounting for roughly 85% of total Bitcoin ETF net outflows; Morgan Stanley's MSBT took in a net $54.4 million over the same period. Some products continued to attract capital, but those inflows fell well short of offsetting redemptions through the main channel.
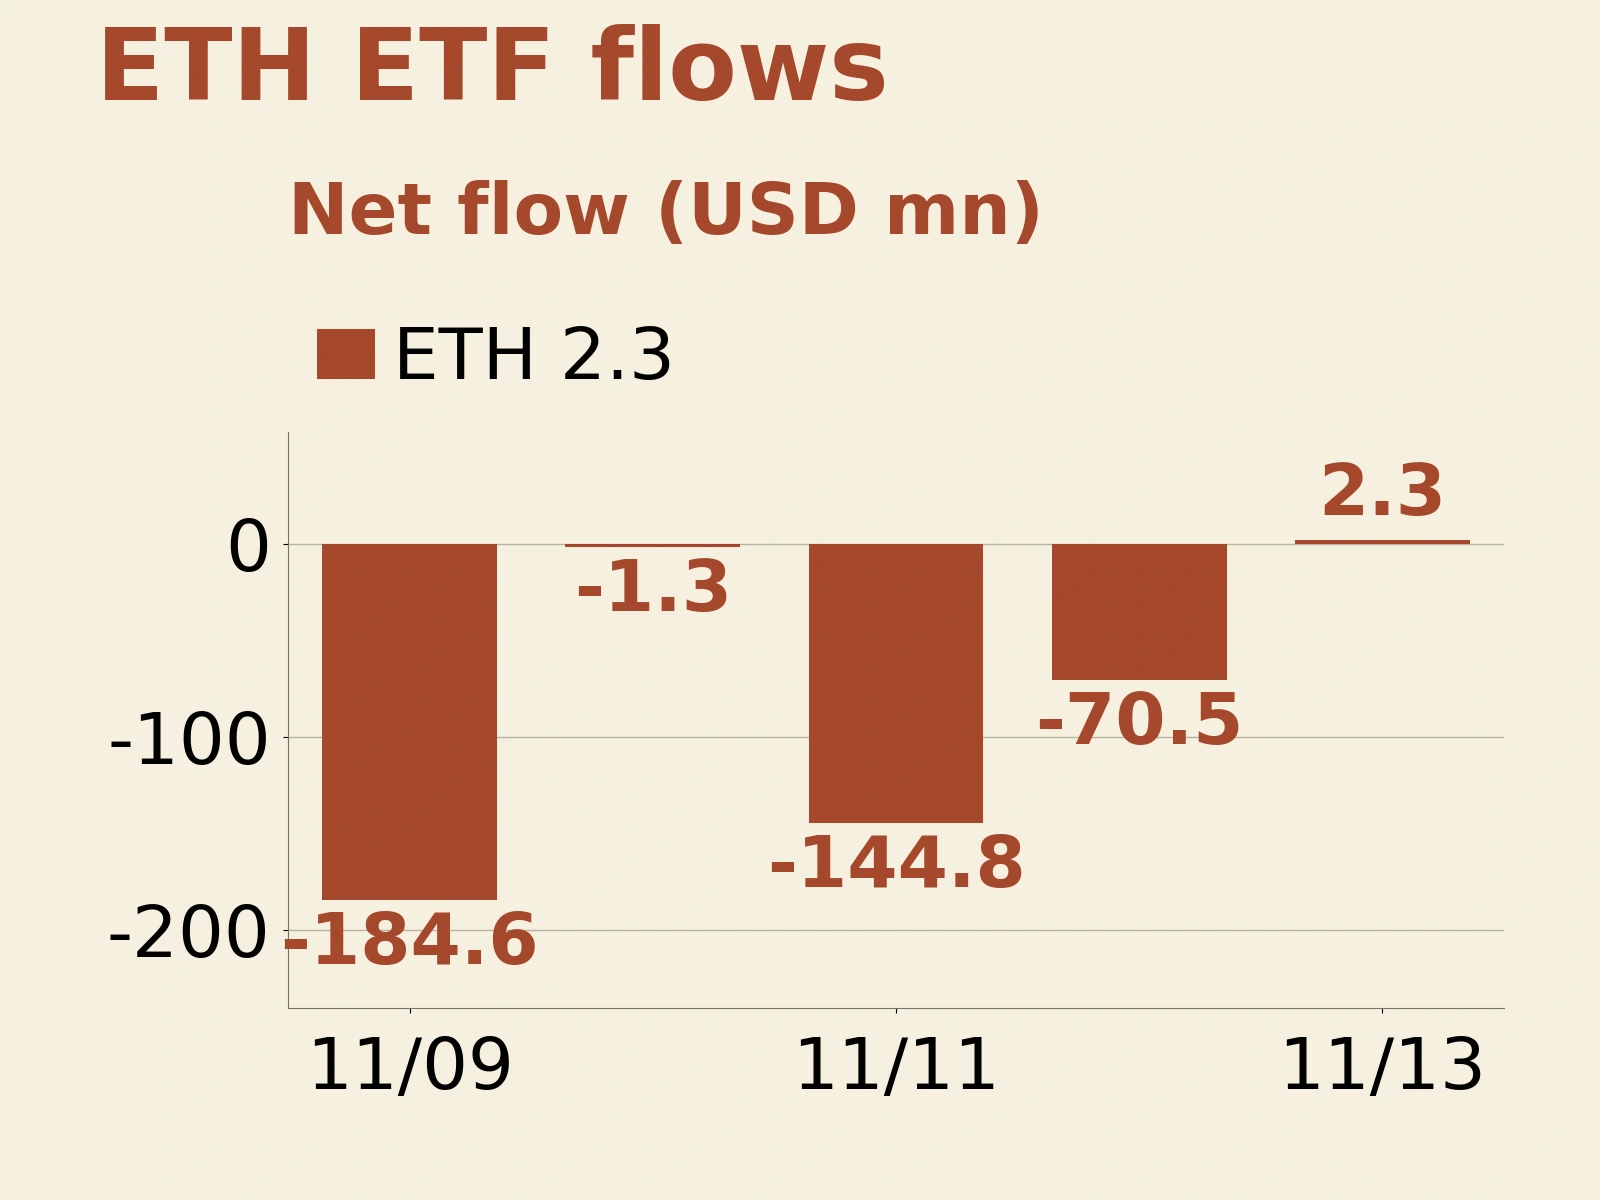
Ethereum ETF flows were weaker. Weekly net outflows reached $398.9 million, up from $365.2 million the previous week. A $2.3 million net inflow on November 13 ended four consecutive days of outflows earlier in the week, but amounted to only about 0.6% of the week's net outflow. Bitcoin ETF outflows narrowed while Ethereum ETF outflows widened: capital allocated through ETFs continued to shrink, although the pace of withdrawal diverged.
The supply of cash within the crypto market was also declining. DefiLlama data show that the circulating face value of dollar-pegged stablecoins totaled $287.427 billion on November 15, down $4.475 billion from November 8 and $16.049 billion over the preceding 30 days. This measure captures on-chain circulating supply rather than immediately available buying demand on exchanges. As crypto prices retreated, stablecoin supply fell rather than rose, consistent with capital being redeemed and leaving the market, with no sign of an accumulation of cash waiting to buy.
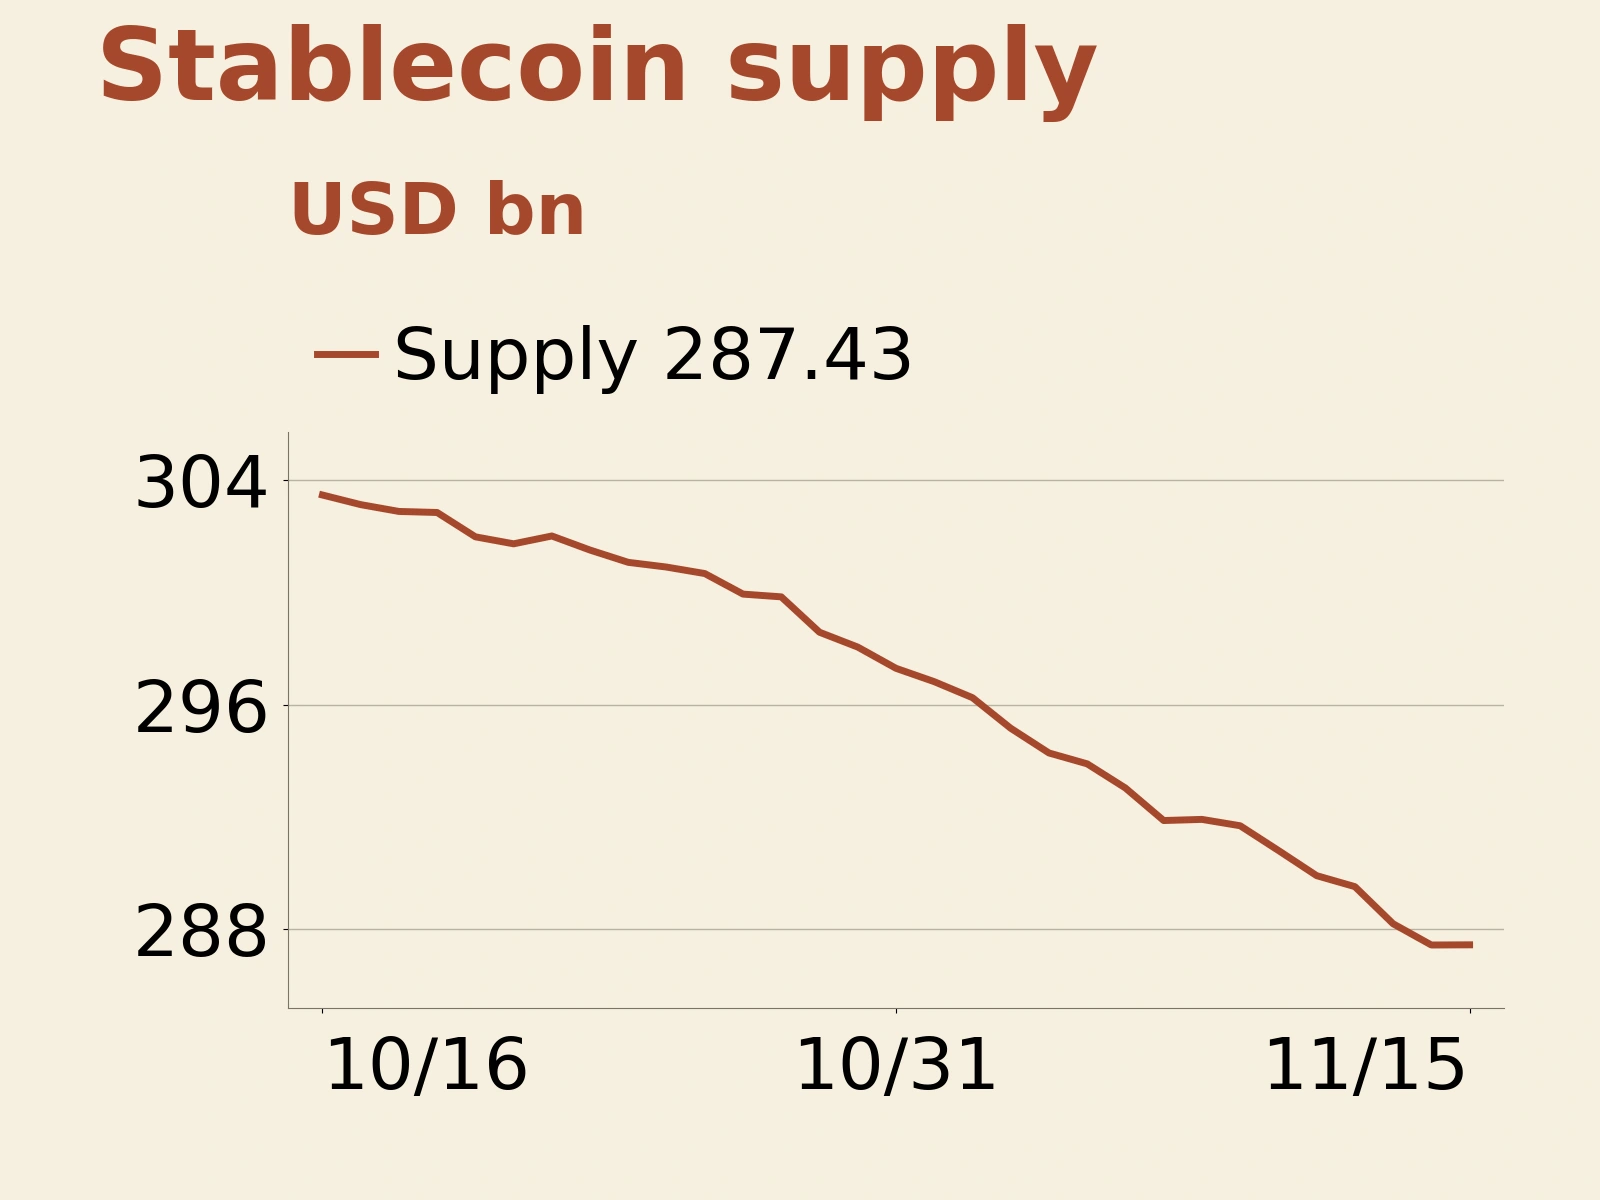
In its weekly report published on November 11, Glassnode linked stablecoin contraction and ETF redemptions to weakening US trading demand. Together, these observations point to a constraint on purchasing power: falling prices do not themselves create new cash. An improvement in funding conditions still requires confirmation from actual flows, such as a return to net ETF subscriptions and stabilization in stablecoin supply.
USDT notional open interest falls 13.00%–14.55%, while coin quantities change little
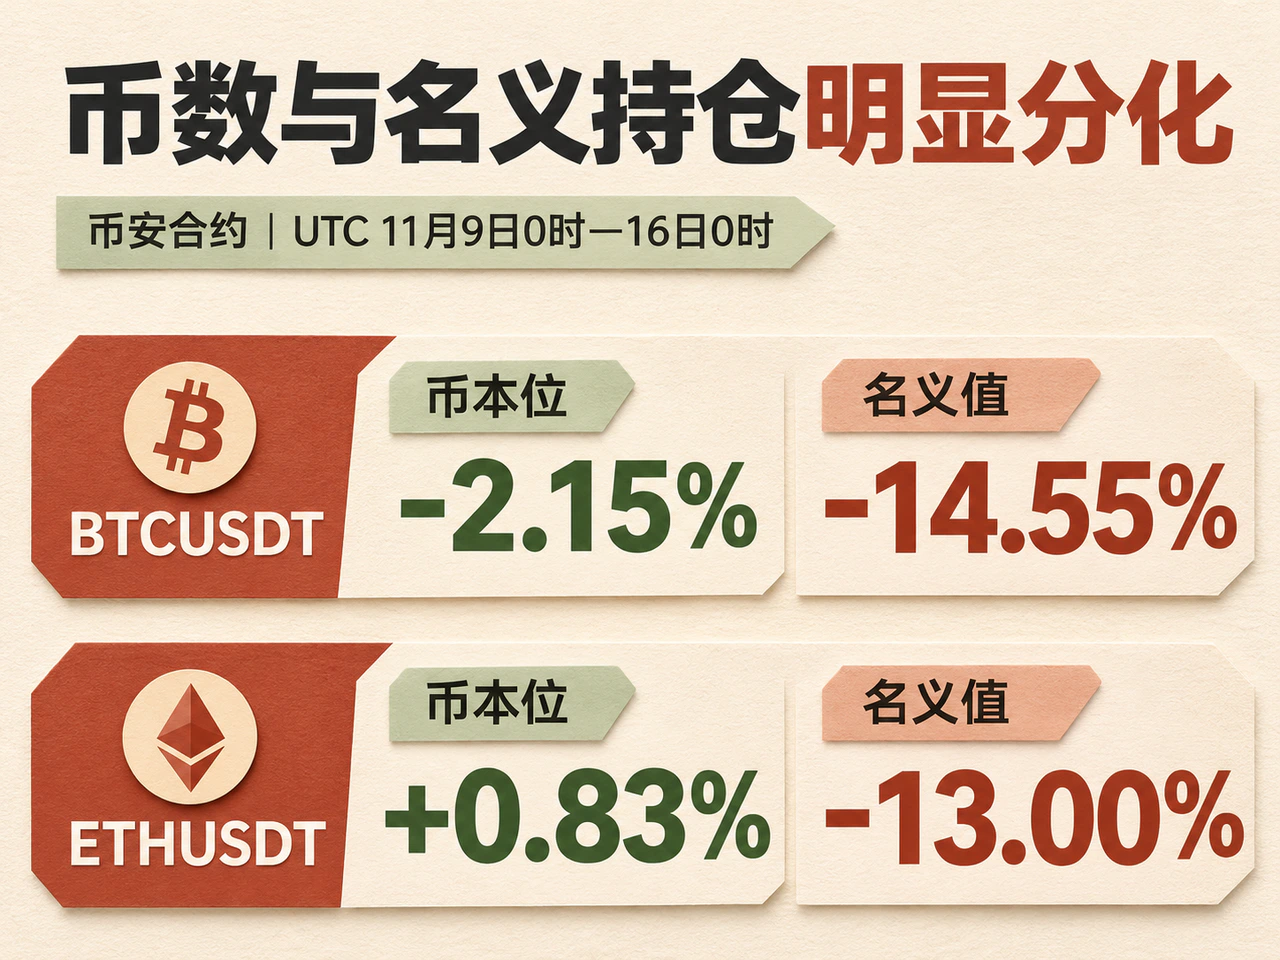
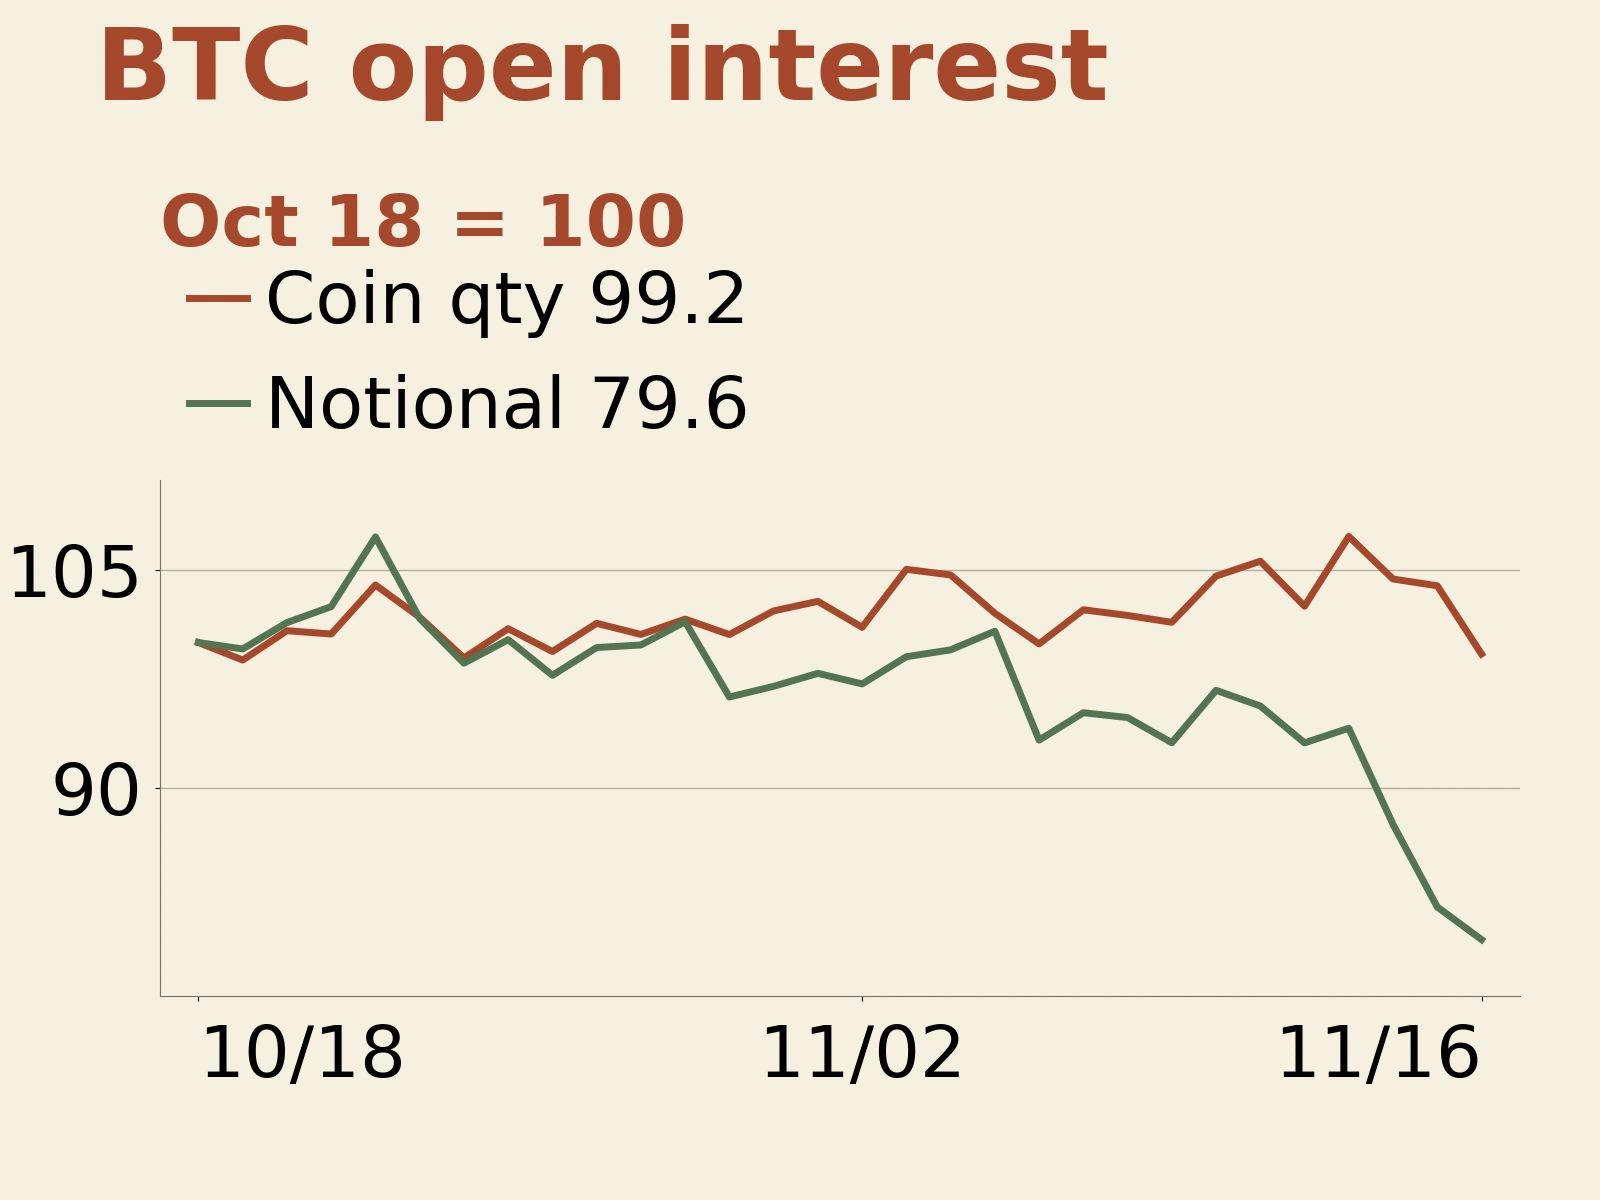
Dollar-valued derivatives positions shrank sharply, while quantities measured in coins changed little. For Binance's BTCUSDT contract, open interest fell from 95,581.18 BTC at 00:00 UTC on November 9 to 93,524.21 BTC at 00:00 UTC on November 16, a decline of 2.15%. Over the same period, USDT notional open interest fell from 7.149 billion USDT to 6.109 billion USDT, down 14.55%. As prices declined, the notional amount contracted substantially, but the quantity of Bitcoin represented by the contracts fell only modestly. The dollar measure therefore showed a much larger reduction in positions.
The contrast was even more pronounced for Ethereum contracts. Over the same period and on the same exchange, ETHUSDT open interest rose from 2.2798 million ETH to 2.2988 million ETH, an increase of 0.83%, while notional open interest fell from 4.847 billion USDT to 4.217 billion USDT, down 13.00%. Falling crypto prices depressed USDT valuations; after newly opened and closed positions offset one another, exposure measured in coins increased rather than decreased. Looking only at declining dollar-valued open interest can understate the price risk the market still carries. Assessing the long–short direction also requires funding rates and the structure of trading.
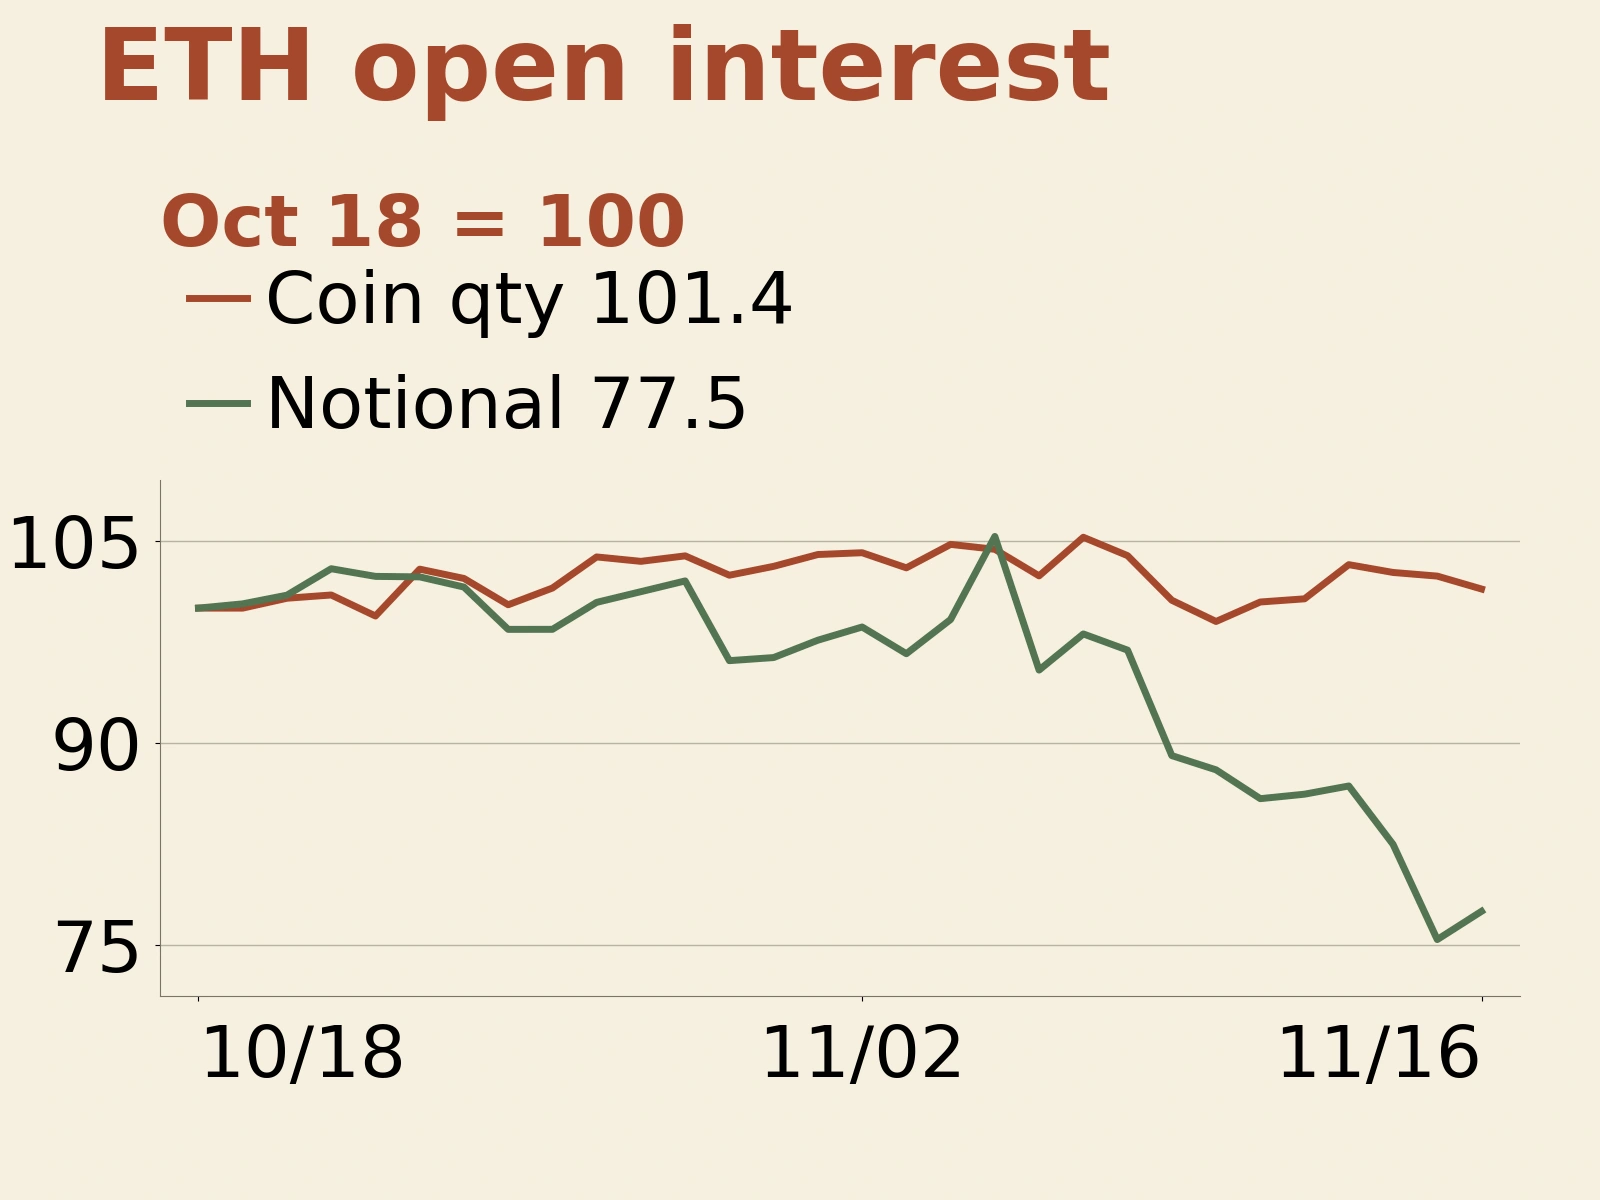
Data during the week already showed liquidations alternating with position rebuilding. In research published on November 11, Bitfinex noted that futures positions were accumulating again during the decline, with positions quickly rebuilt after liquidations. On November 13, CoinDesk, citing CoinGlass data, reported $1.64 billion in liquidations over a rolling 24-hour period, roughly 88.7% of them long positions. Large forced liquidations did not produce a commensurate decline in coin-denominated open interest over the week, showing that forced closures and fresh positions can occur at the same time.
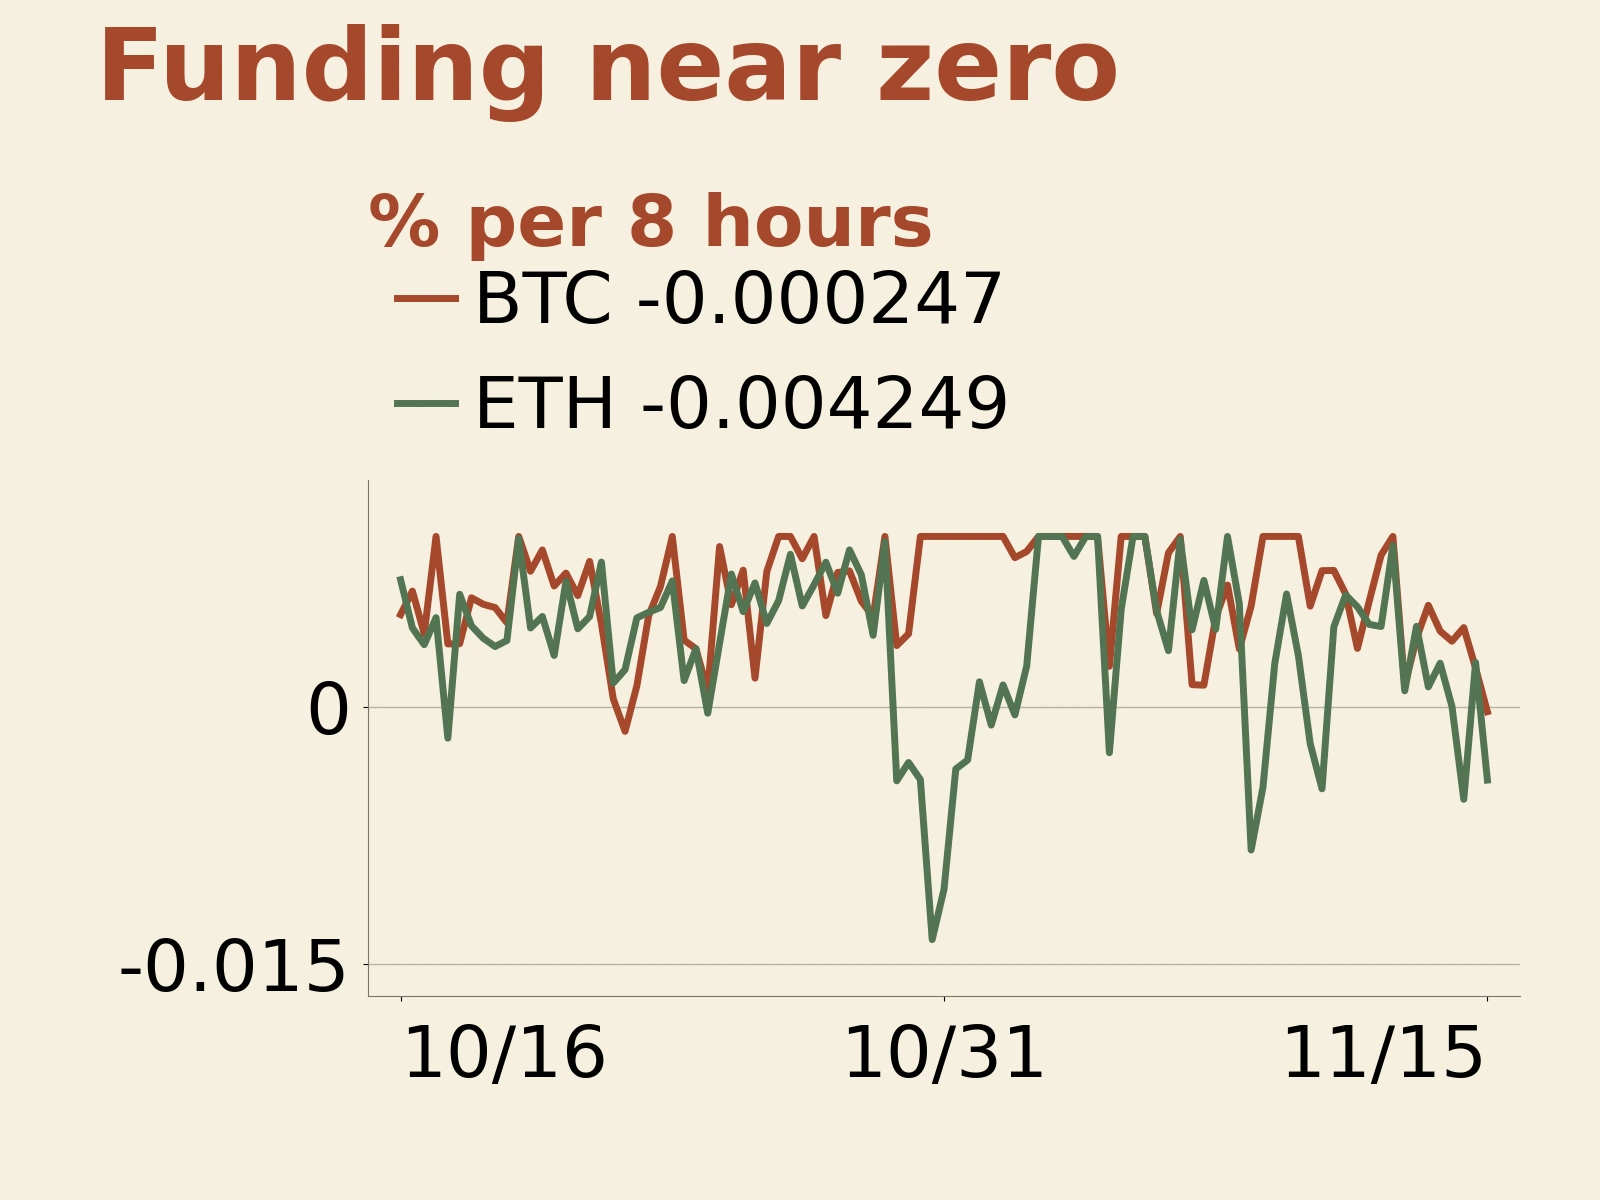
By the weekend, funding rates had fallen close to zero. The settled funding rate on Binance's BTCUSDT perpetual contract declined from 0.005930% at 00:00 UTC on November 9 to -0.000247% at the final settlement in this statistical week, at 16:00 UTC on November 15. The ETHUSDT rate at the same settlement was -0.004249%. Negative funding means shorts pay longs, indicating that the crowded side of contract trading had shifted toward shorts. The rates were very small in absolute terms, so the cost of leverage was low. Positions remained sticky, leaving scope for subsequent volatility to trigger a squeeze.
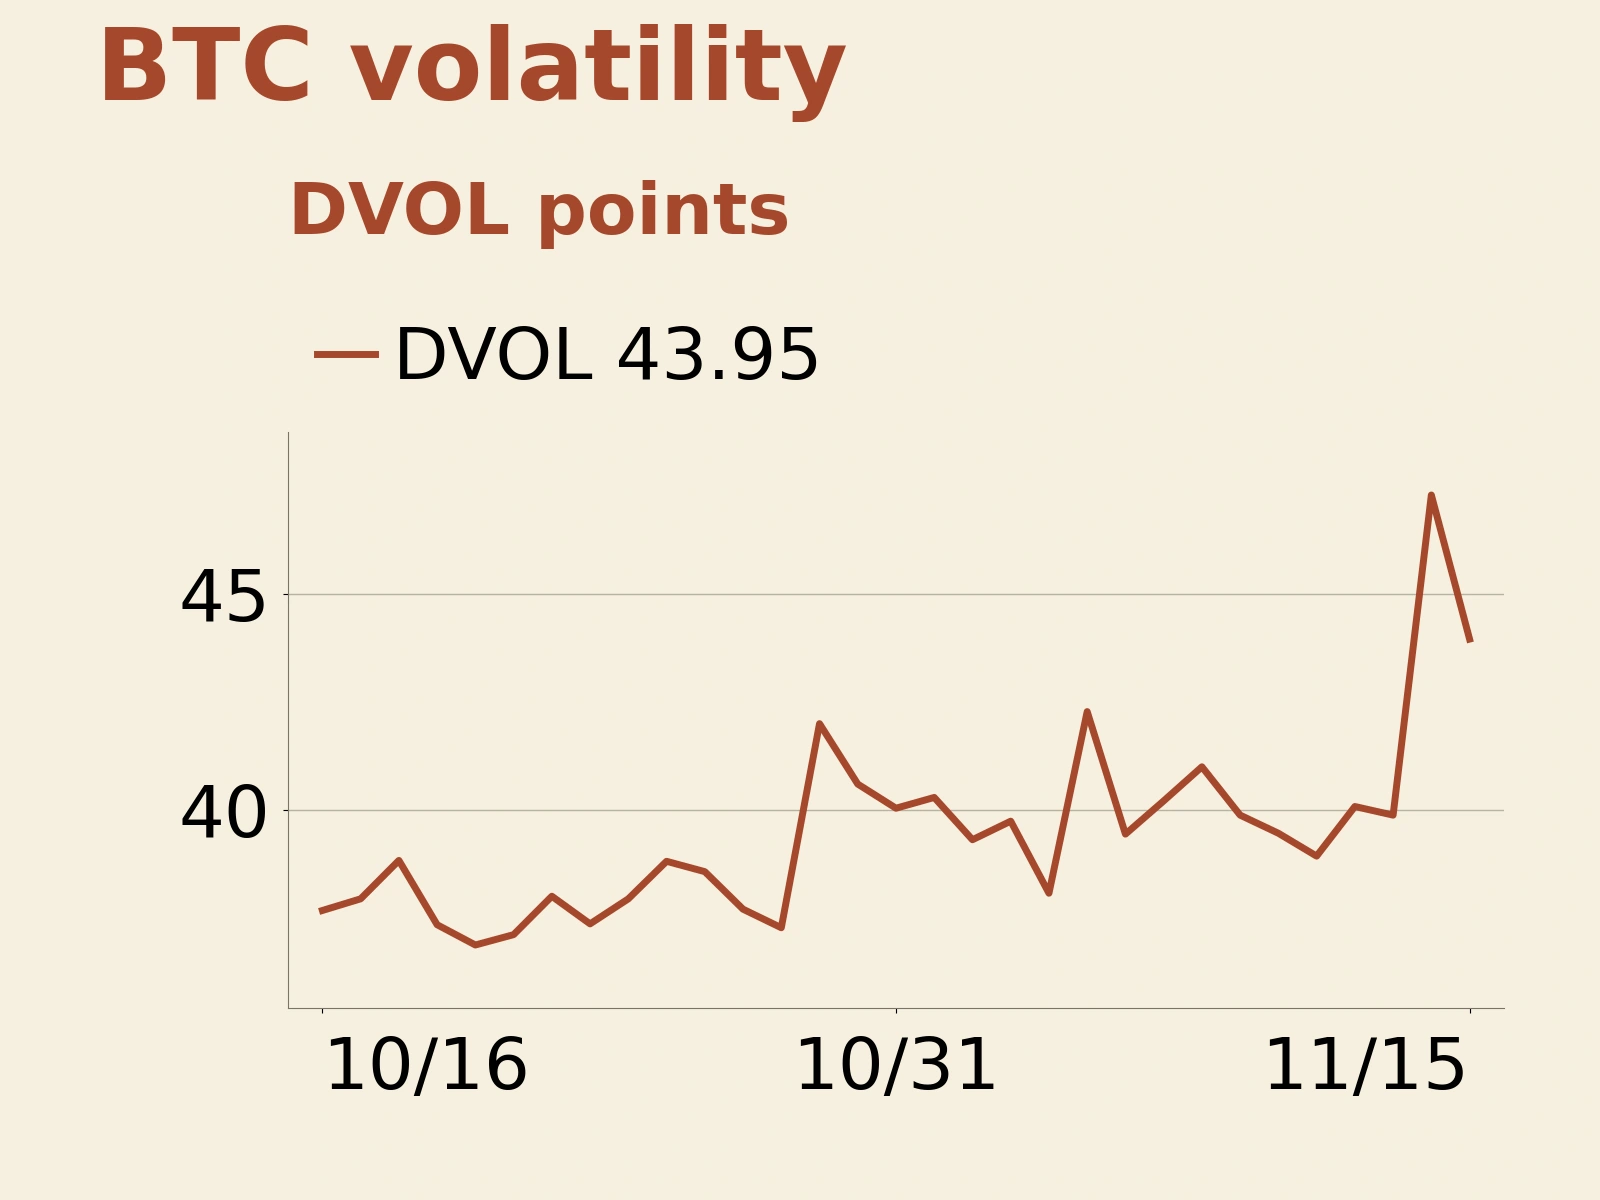
The options market, meanwhile, demanded greater compensation for future volatility. The UTC daily closing level of Deribit's Bitcoin implied volatility index, DVOL, rose from 40.99 on November 8 to 43.95 on November 15; it closed as high as 47.29 on Saturday, November 14. Despite the retreat on the final day, the end-of-week level remained above that of the previous week.
Weak spot purchasing power, limited reduction in coin-denominated futures exposure and options implied volatility above the previous week's level together form a funding backdrop in which rebounds are vulnerable to setbacks. Confirming an improvement still requires both fresh buying demand and an adjustment in the structure of positions.
Click “Read the original” for further details.