On November 11, 2026, Jupiter, part of the Solana ecosystem, announced token baskets, yield vaults and a redesigned asset-management interface, extending its offering from token swaps to asset allocation and yield management. In the same week, dollar-denominated DeFi total value locked (TVL) fell broadly across major public blockchains, while trading and lending services followed different paths. The divergence between asset valuations, platform usage and service fees makes capital retention and the ability to provide continuing services the focus of this edition's assessment of onchain businesses.
TVL on major blockchains falls 8.78%–12.41%; DEX volume edges up 0.86%
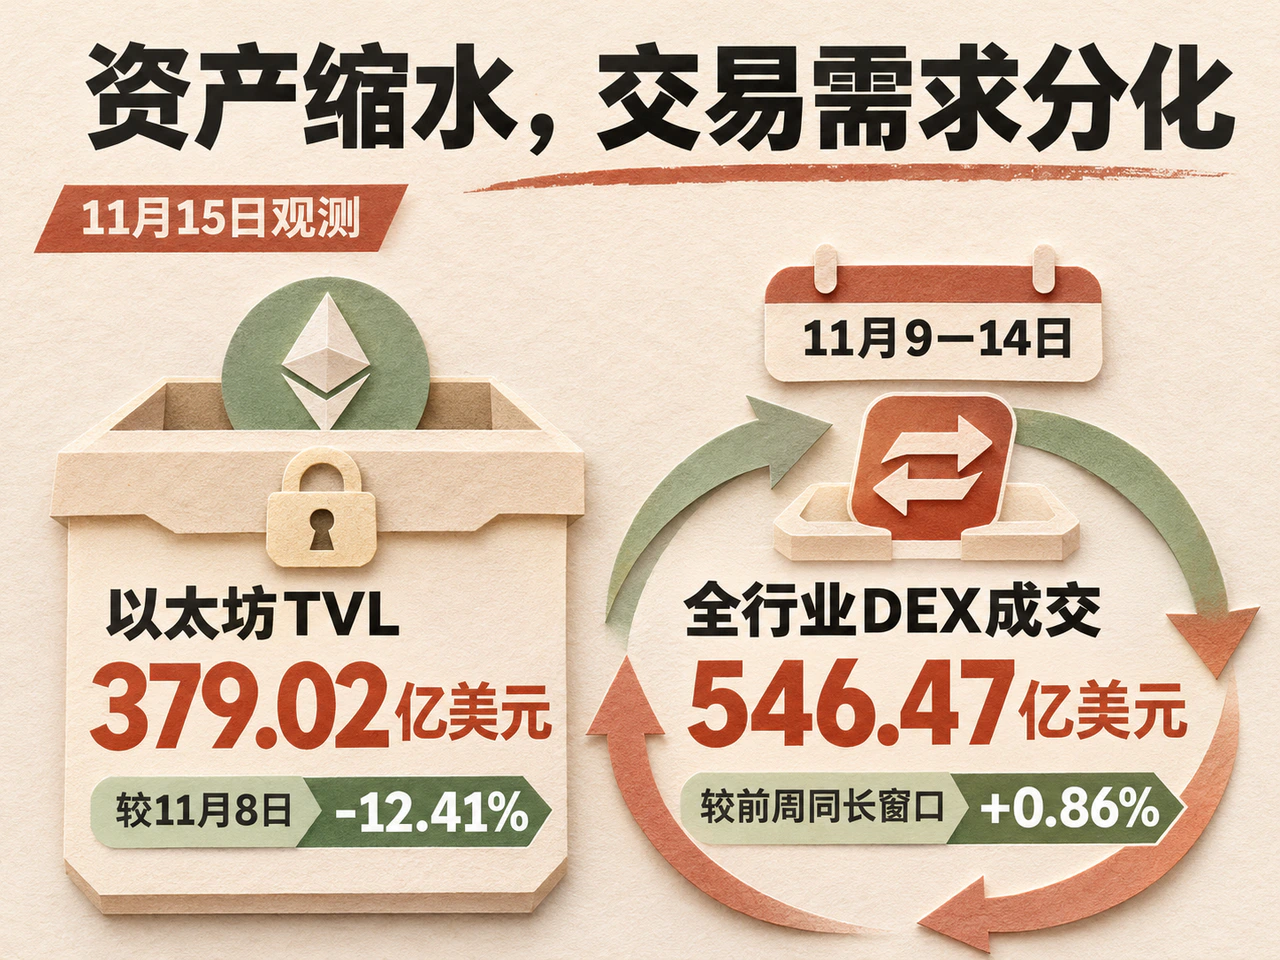
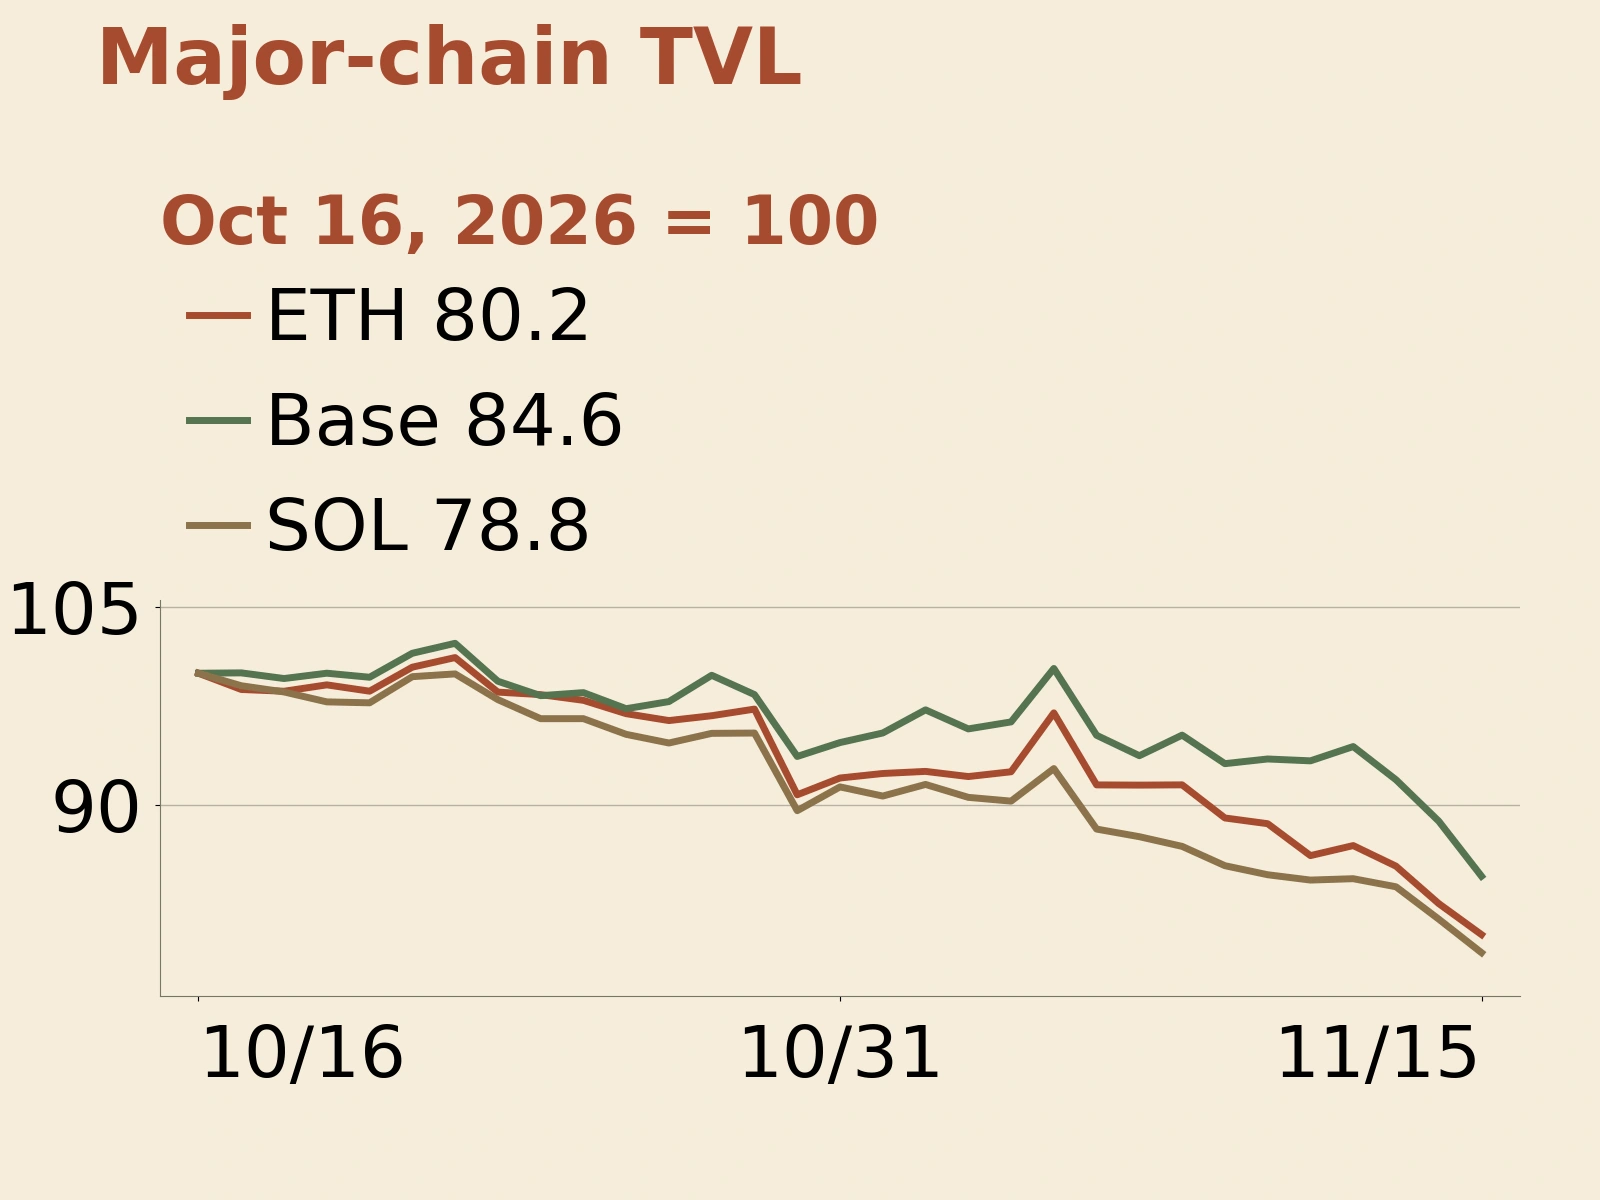
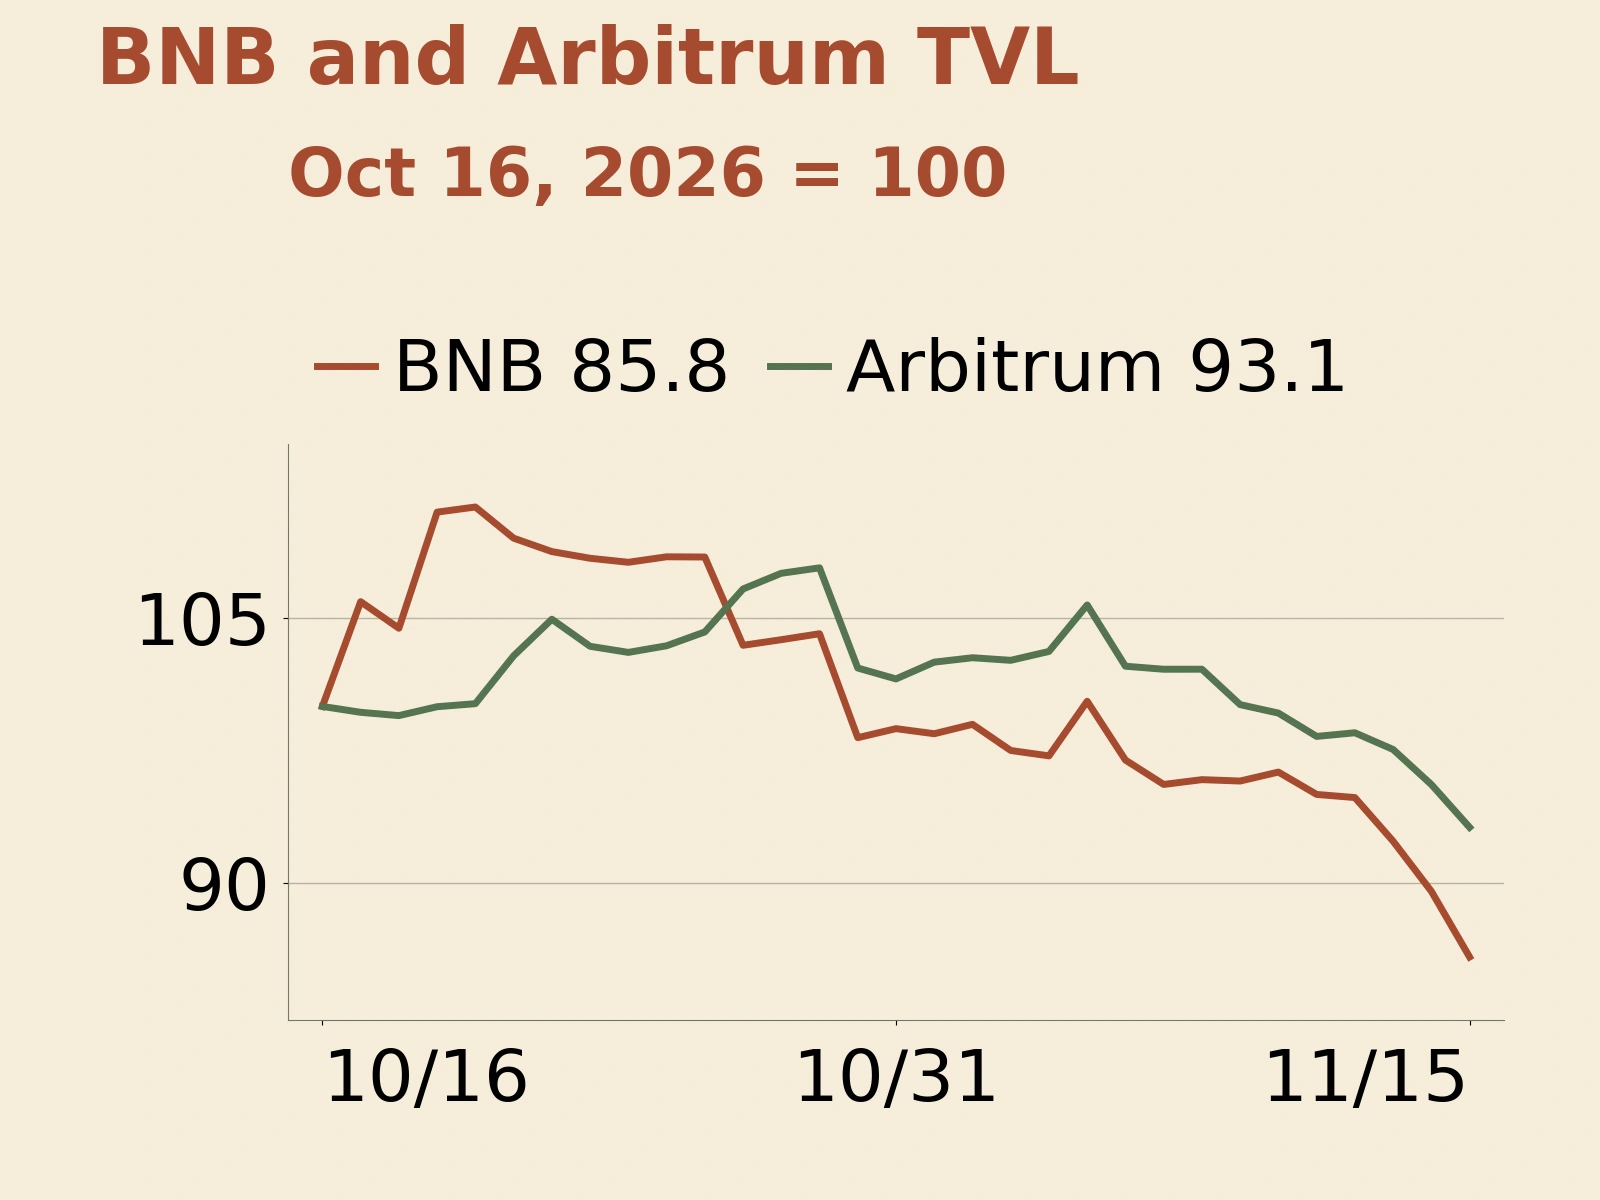
DefiLlama's historical observations labeled November 15 show Ethereum DeFi TVL at approximately $37.902 billion, down 12.41% from November 8; Base at about $5.195 billion, down 11.23%; and Solana at around $4.701 billion, down 9.28%. BSC and Arbitrum fell 10.48% and 8.78%, respectively, over the same interval. These dollar-denominated figures include valuation losses caused by falling collateral prices. Lower prices also affect protocols' collateral capacity, borrowing limits and liquidation pressure.
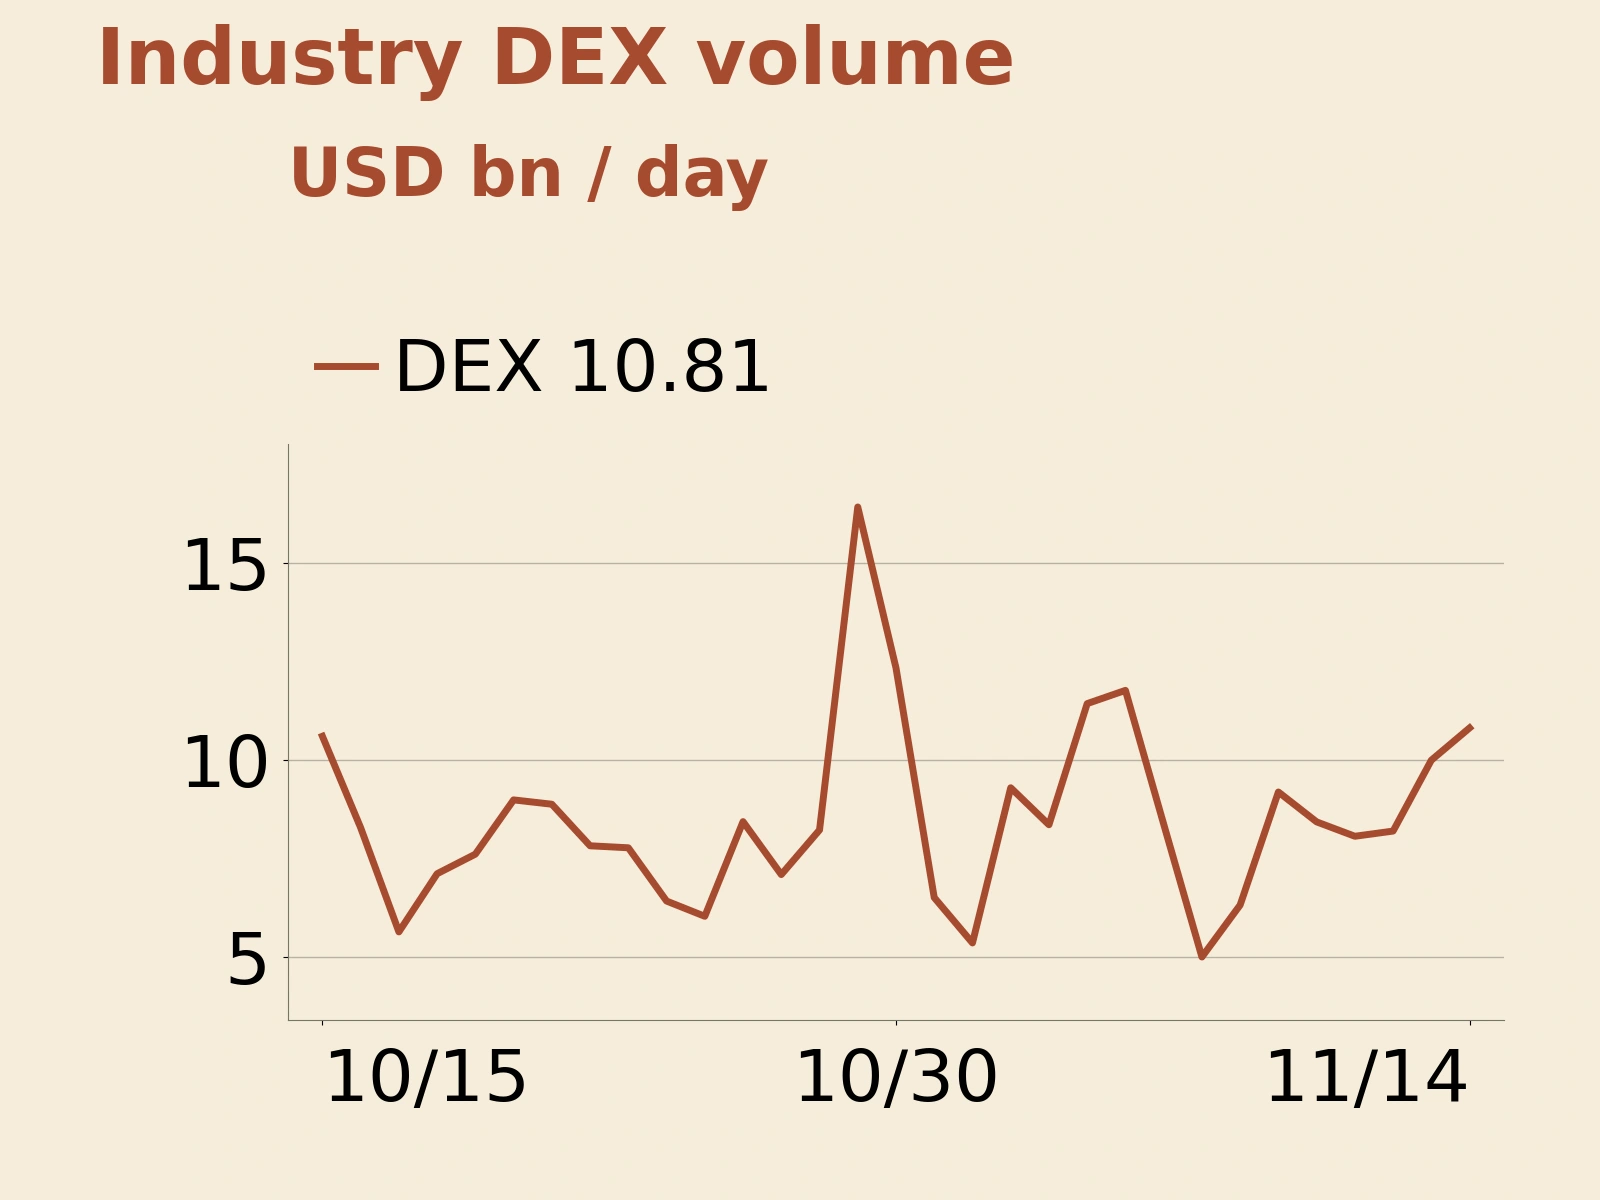
Trading volumes changed much less. Across the six complete UTC days from November 9 to 14, industry-wide decentralized exchange (DEX) spot volume covered by DefiLlama totaled approximately $54.647 billion, up 0.86% from November 2–7. Ethereum recorded $12.072 billion, up 3.72%; Solana $9.186 billion, down 14.27%; and Base $7.369 billion, down 1.32%. As asset valuations broadly declined, industry-wide volume was essentially flat, but individual blockchains did not move together: Ethereum grew while Solana fell markedly.
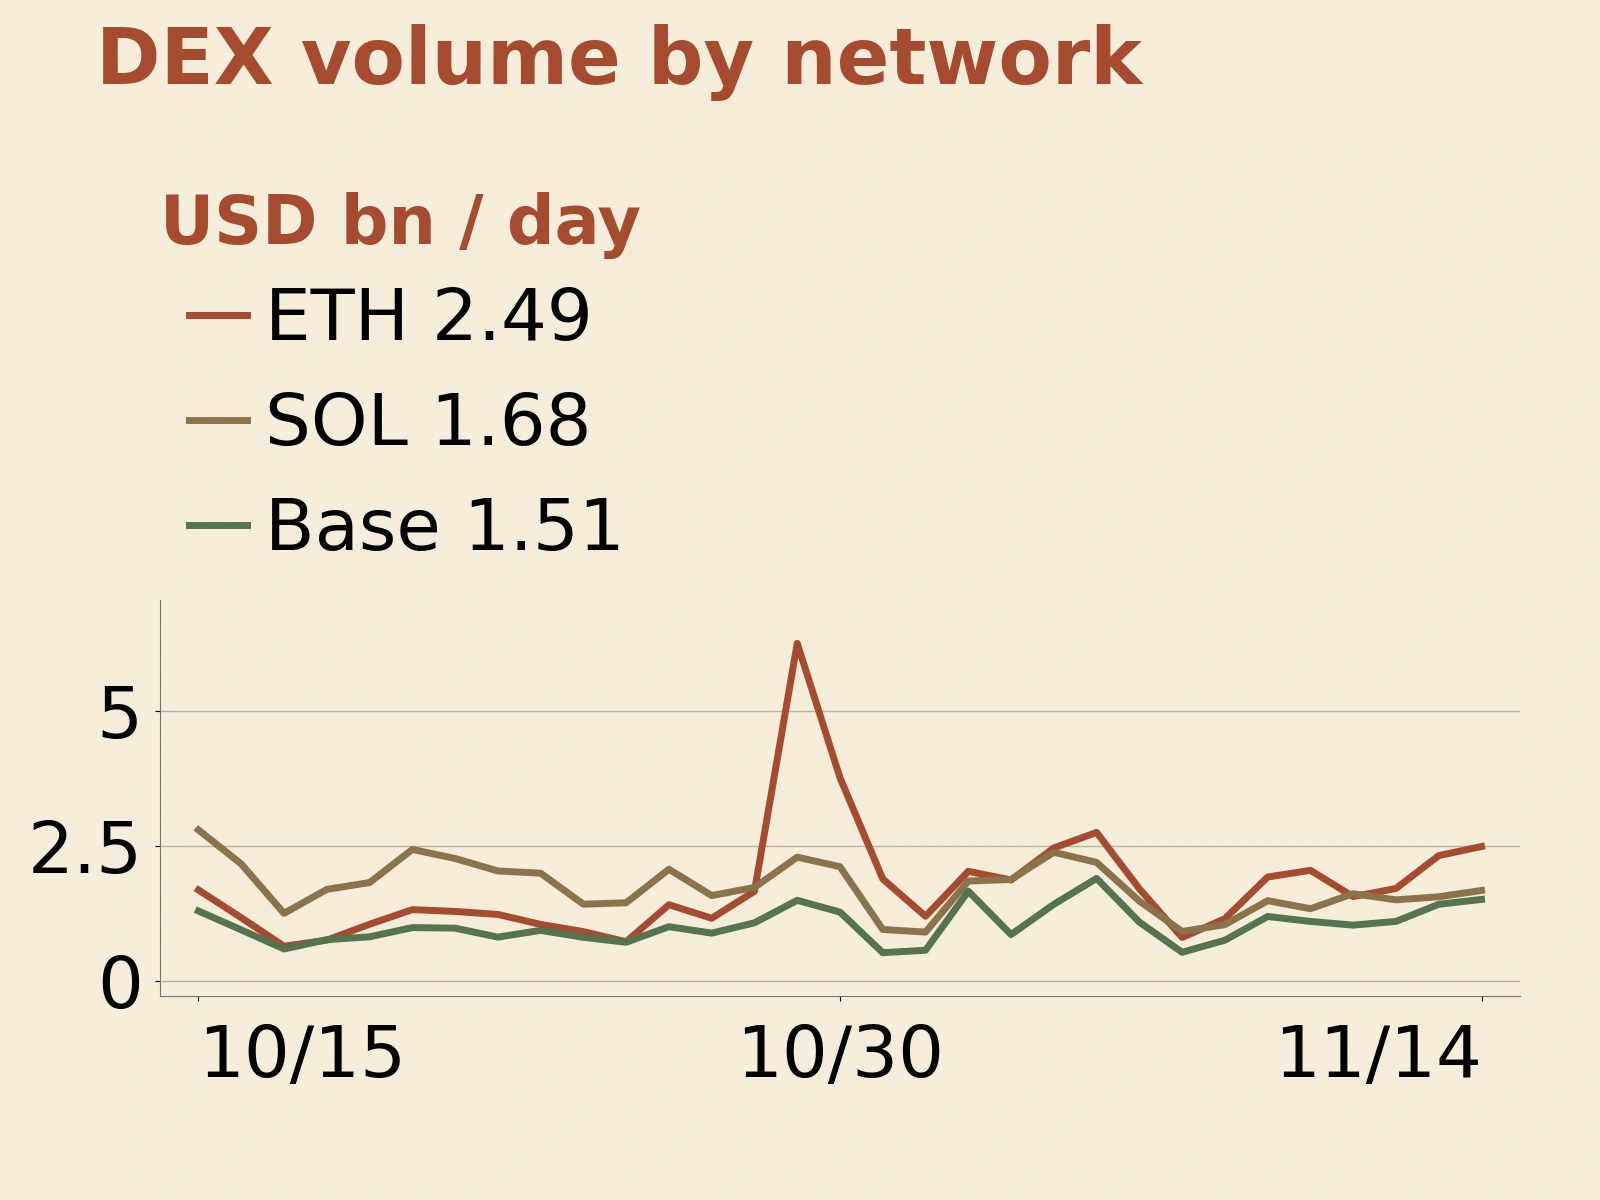
Trading during a decline can reflect portfolio rebalancing, position closures, risk transfers and asset disposals following liquidations. It captures both demand for trading services and risk-management activity, and cannot by itself be read as new demand for long-term asset allocation. Ethereum's relatively resilient volume more directly indicates continued use of its liquidity and trade-execution services.
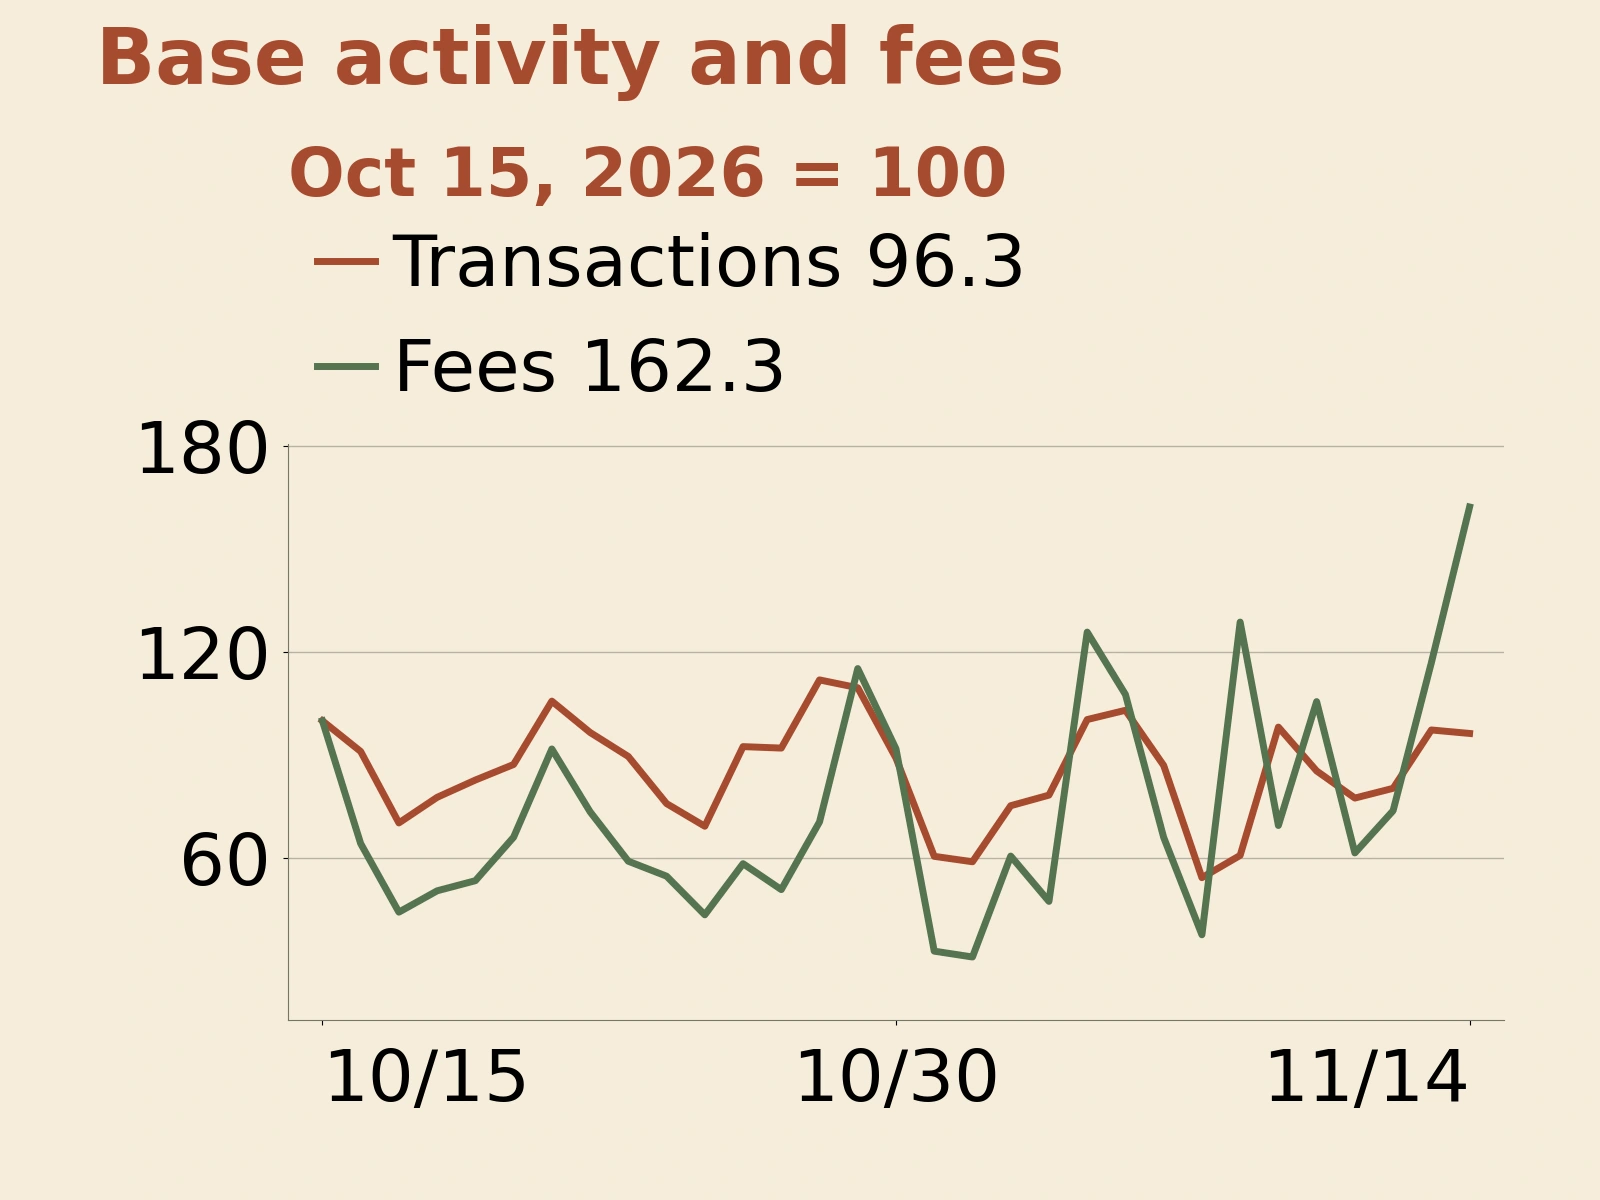
Base's onchain activity continued to grow. According to growthepie, Base processed approximately 53.06 million transactions from November 9 to 14, up 7.36% from the same six-day window in the preceding week. Onchain transaction fees totaled about $730,400, up 32.44%. Fees grew considerably faster than transaction counts, lifting the average dollar fee per transaction and showing that activity intensity and the transaction mix also affect fees. For a low-cost network, transaction counts, the charge per service and application revenue together determine how business value is distributed.
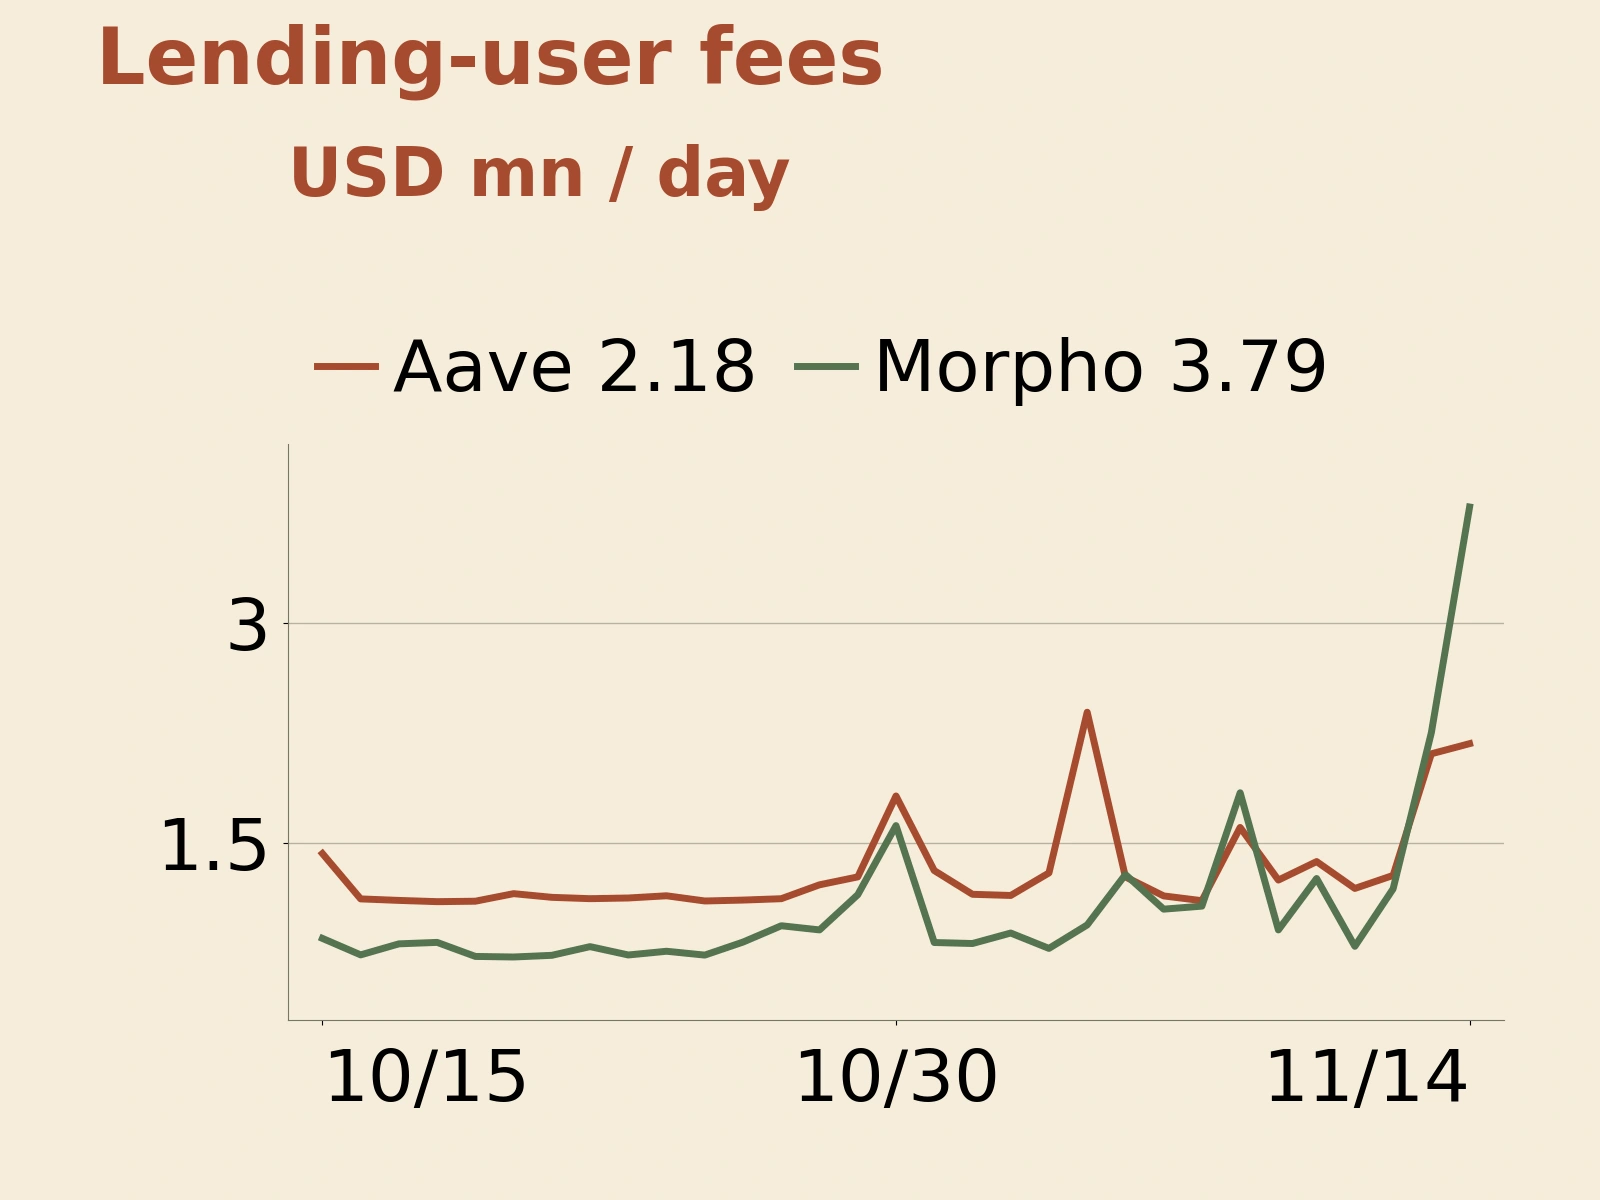
Fees paid by lending users also continued to rise. Over the same six-day window, Aave V3 users paid approximately $9.3876 million in fees, up 12.31% from the preceding week, while Morpho Blue users paid about $10.2028 million, up 69.22%. Interest and other fees can rise even as asset balances shrink: borrowing demand, utilization and interest rates all affect the outcome. These fees first compensate the provision of capital and the assumption of risk. How much ultimately accrues to protocols and token holders depends on their respective distribution rules.
Token baskets offer automatic rebalancing; yield vaults bring in third-party managers

Jupiter's updates this week address where users' capital stays after a trade and who provides the next service. Its token baskets let users buy a group of assets in a single transaction using SOL or USDC, allocating by market-cap weights or fixed weights and rebalancing automatically. Yield vaults feature strategies designed by external managers, bringing stablecoin lending, yield-bearing assets and related strategies into a single interface. Jupiter supplies the contracts and application access, while third parties manage strategies. The initial managers listed in the official documentation include Bitwise, Hivemind and RE7 Labs.
For users, choosing a strategy through a single entry point simplifies the work of finding protocols, moving assets and maintaining multiple positions. For the platform, services extend from one-off trade execution to ongoing asset management. Jupiter and the managers can both charge management and performance fees, broadening potential revenue opportunities to capital retention and strategy operation. The product announcement says initial vault testing was open to the waitlist and eligible JUP stakers. Subsequent business performance will still depend on actual deposits, redemptions, fees and asset performance.
Looping strategies can add leverage; some redemptions may take up to 30 days

As access to yield becomes simpler, more strategy selection is entrusted to managers. The official risk disclosures identify several risks: looping strategies increase asset exposure through leverage; Offerbook loans have fixed terms, and if a borrower defaults and collateral recovery is insufficient, losses flow through to vault share prices; and some standard redemptions require a waiting period of up to 30 days. Publicly visible onchain operations and contract limits give users a basis for monitoring, but repayment sources and available liquidity still determine whether redemptions proceed smoothly.
This also explains why tokenized assets need further integration with lending and trading. Bringing an asset onchain is only the starting point; convenient collateralization, financing and exit channels are what support continued use. Jupiter is competing to become a distribution gateway for asset allocation and yield services. Whether that advantage materializes depends on whether the new strategies attract sustainable capital and maintain transparent pricing and effective redemptions during market volatility.
This week's data already show that asset valuations, trading activity and service fees can move in different directions. For onchain applications, operating capability ultimately comes down to specific functions such as retaining capital, delivering services that users use and distributing revenue.
Click through to the original article for further details.