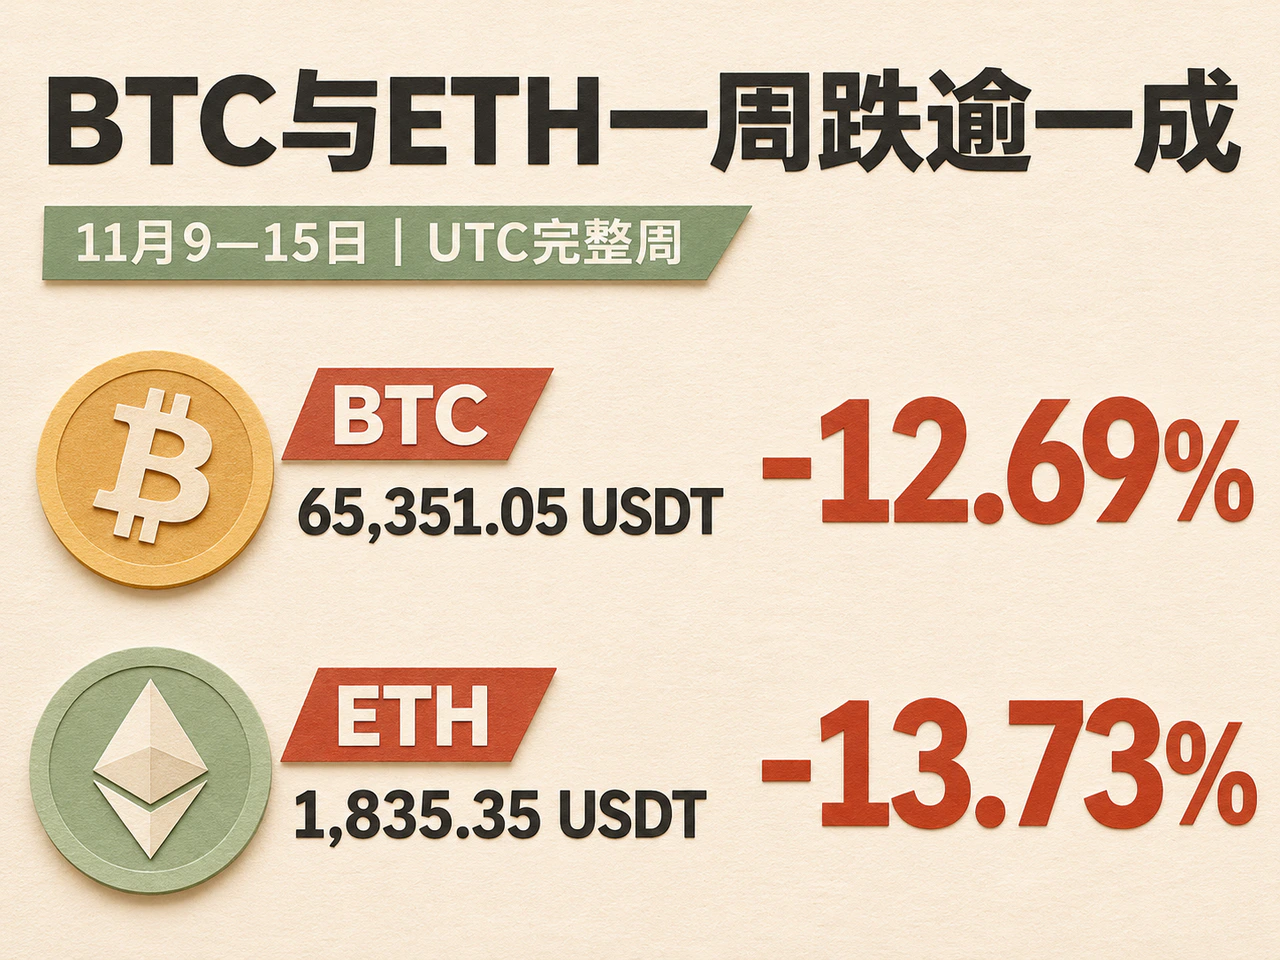
On November 15, 2026, Bitcoin fell to an intraday low of 62,006 USDT on Binance's spot market before rebounding to close 1.87% higher for the day. ETH gained 3.74%. Both recovered only a small fraction of their earlier losses. This report covers November 9, 2026, at 08:00 through November 16 at 08:00 Beijing time, corresponding to the seven complete UTC daily candles from November 9 to 15. All prices are Binance spot quotations in USDT. BTC ended the week at 65,351.05 USDT, down 12.69% from the previous weekend; ETH closed at 1,835.35 USDT, down 13.73% for the week.
Tighter macroeconomic financing conditions coincided with weaker buying demand in crypto markets this week. US inflation data and comments from Federal Reserve officials raised expectations of interest-rate increases, while persistent net outflows from spot ETFs weakened the market's capacity to absorb selling. Once prices broke lower, forced liquidation of leveraged positions amplified volatility. The weekend rebound brought a short-term recovery, but the combination of steep weekly losses, higher turnover and net ETF outflows shows that reducing risk exposure remained the dominant theme. Whether the rebound can continue depends on sustained buying support from spot-market capital.
Rate-hike expectations rise; roughly $2.02 billion liquidated in a late-week 24-hour period

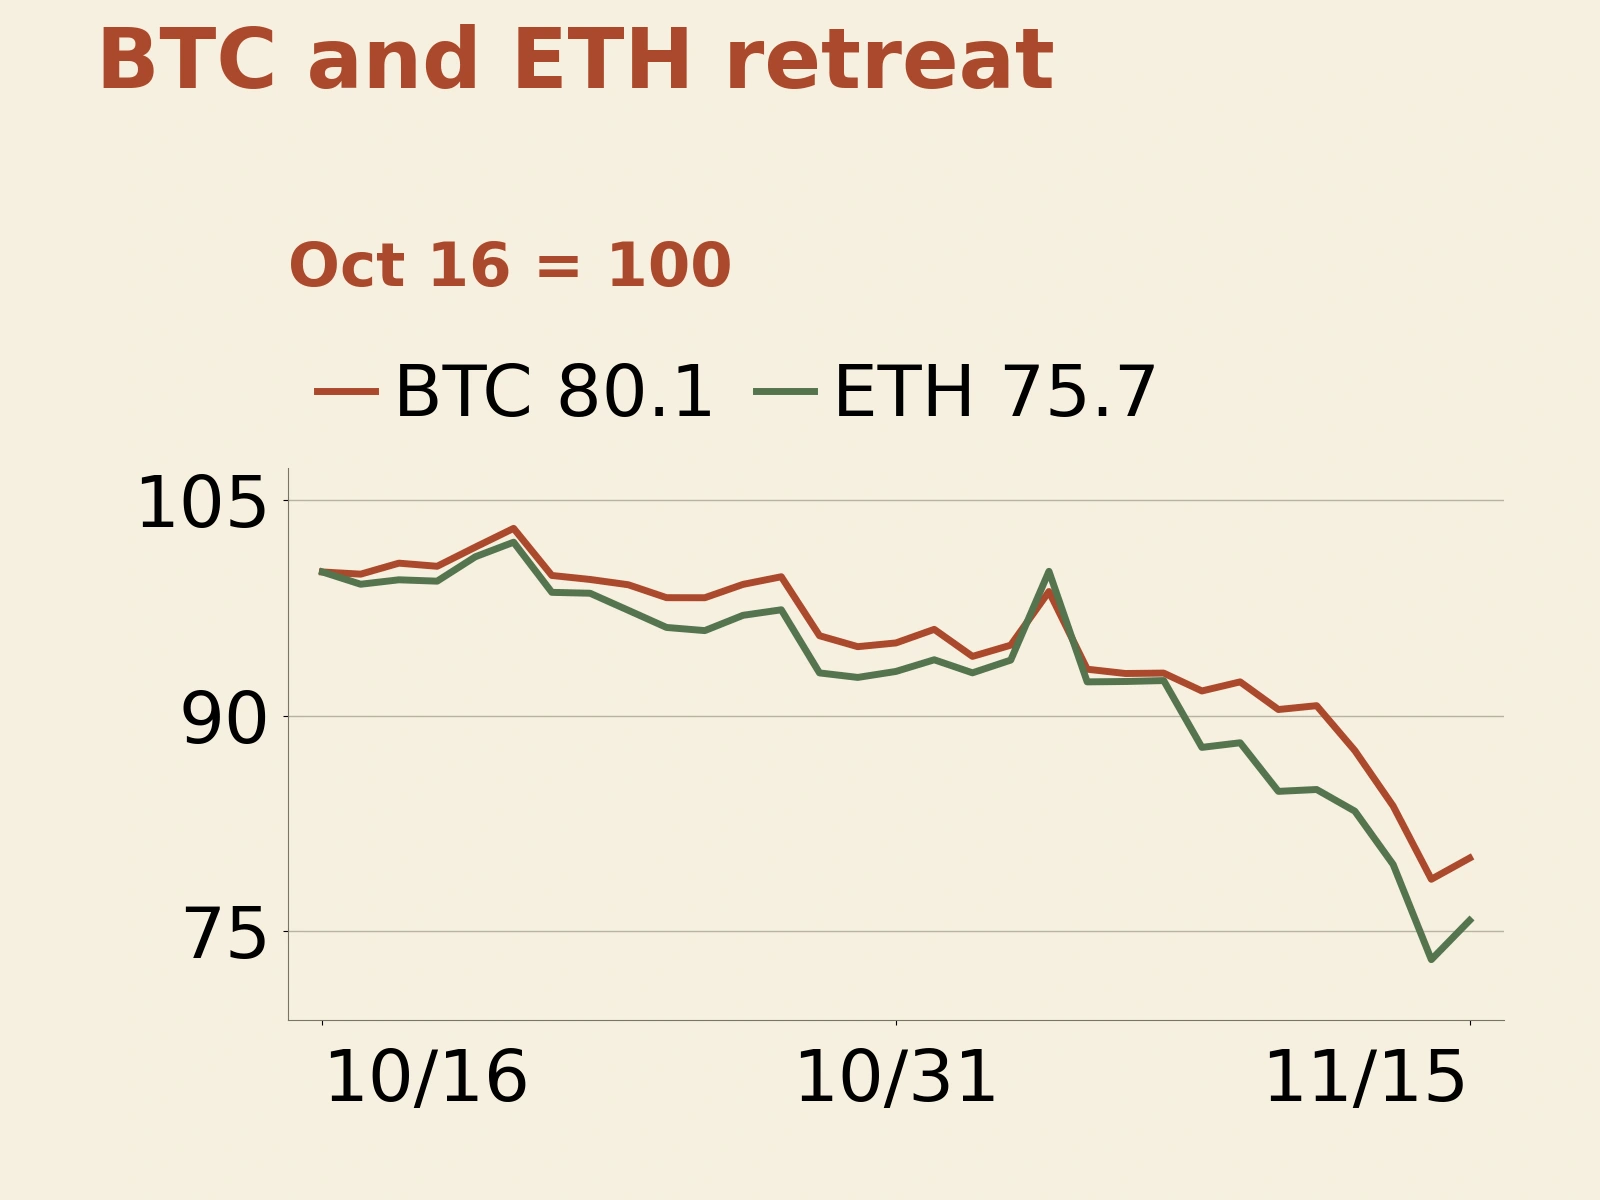
On November 9, BTC and ETH edged up 0.69% and 0.37%, respectively. On November 10, the US Bureau of Labor Statistics reported that October CPI rose 0.4% month on month, while core CPI increased 0.3%. That same day, Fed Governor Waller said he leaned toward supporting a 25-basis-point rate increase in December even if inflation improved as expected; a 50-basis-point increase should be considered if monthly core inflation remained around 0.3% or higher. BTC fell 2.09% that day and ETH dropped 3.84%. Rising expectations of rate increases raised the opportunity cost of holding crypto assets that generate no cash income.
In its November 13 weekly report, Coinbase Institutional estimated that the market was pricing in 64 basis points of rate increases over the next 12 months, up from approximately 37 basis points at the start of the month. It also noted that Bitcoin had failed to recover alongside technology shares when those shares briefly recouped earlier losses. This divergence suggests that crypto's own supply and demand for capital were influencing prices alongside macro interest rates and volatility in technology stocks.
On November 11, MSCI released the final list of companies affected by its methodology changes for non-operating companies. Reuters reported that Strategy would be removed from the relevant indexes. Index changes first affect equity portfolio rebalancing. Companies of this kind finance coin purchases through equity and debt issuance; if demand for their shares and their financing capacity weaken, expectations for future coin buying also adjust. The effect on Bitcoin therefore operates mainly through corporate financing and expectations of future purchases. The index adjustment itself does not directly trigger Bitcoin sales.
Price pressure intensified in the latter part of the week. From November 12 to 14, BTC fell 3.45%, 4.40% and 6.10%, respectively, while ETH declined 1.78%, 4.45% and 8.33%. Over just the two UTC trading days of November 13 and 14, BTC lost a cumulative 10.23% and ETH 12.40%, substantially exceeding the moves early in the week. Citing hourly CoinGlass data, The Block reported approximately $2.02 billion in market-wide liquidations between 08:00 on November 14 and 08:00 on November 15, US Eastern time, including roughly $1.68 billion in long liquidations. These figures measure forced position closures within that rolling 24-hour window.
Exchange-related developments also unsettled sentiment. Reuters reported on November 14 that Binance said it had restored withdrawals on 87 networks during the week and aimed to restore withdrawals for the remaining networks and assets by the following weekend. On November 15, Changpeng Zhao publicly denied that Binance was selling crypto assets. Some market participants speculated that users might sell once they regained the ability to dispose of their assets. Comprehensive customer-flow data directly linking this explanation to the week's selling pressure remain unavailable. ETF redemptions, realized liquidations and interest-rate pricing provide clearer observable evidence.
All ten sampled coins fall; BTC turnover rises 32.42%
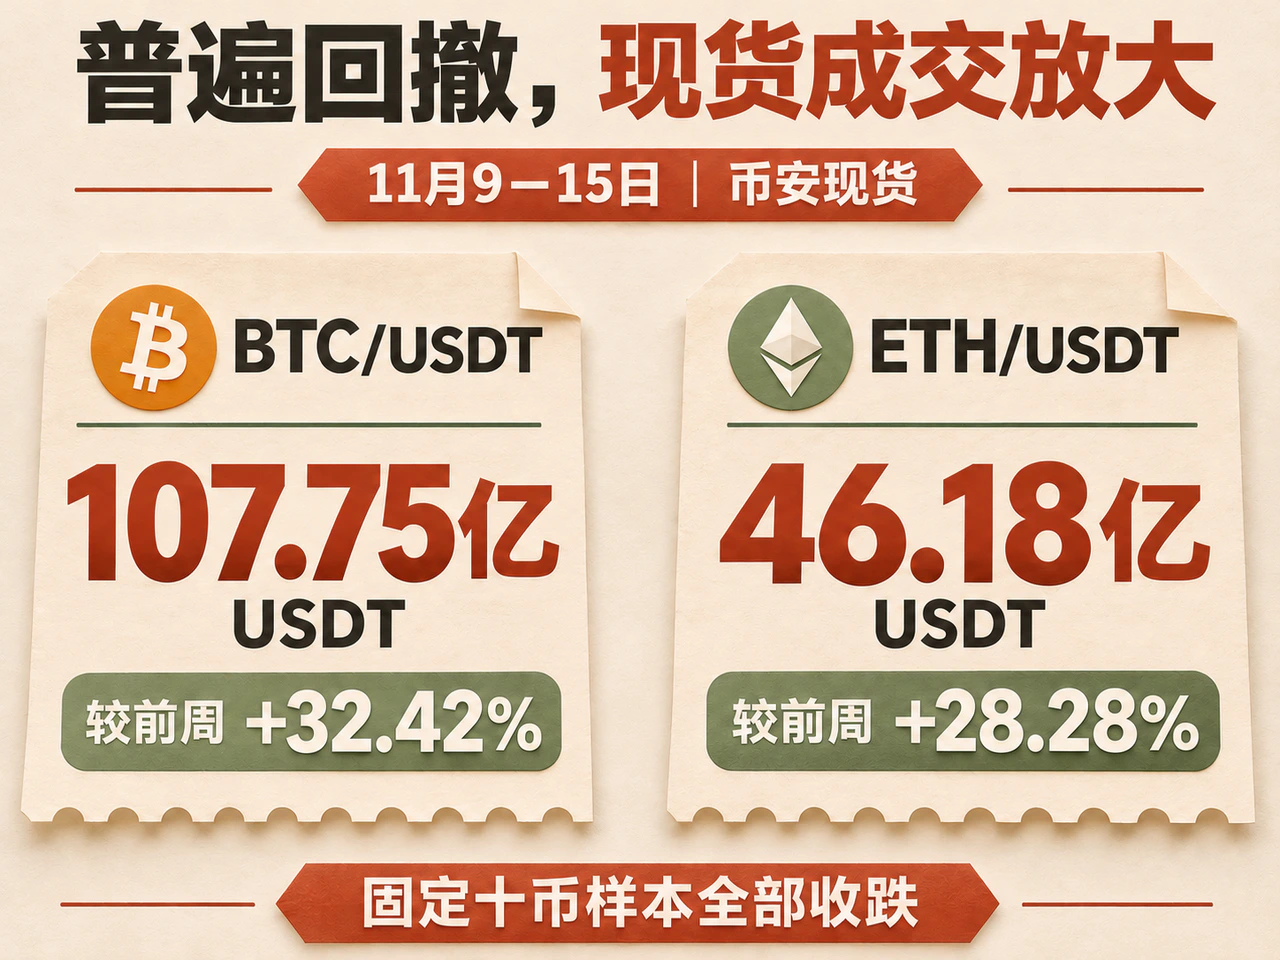
All ten highly liquid coins in the report's fixed weekly sample finished lower. Beyond BTC and ETH, SOL fell 15.91%, BNB 12.90%, XRP 12.49%, DOGE 13.18%, ADA 11.29%, LINK 10.70% and SUI 10.18%. Even AVAX, which suffered the smallest decline, lost 7.88%. The broad retreat across this same-platform spot sample shows that pressure was not confined to a single project. AVAX's relative resilience did not change that pattern.
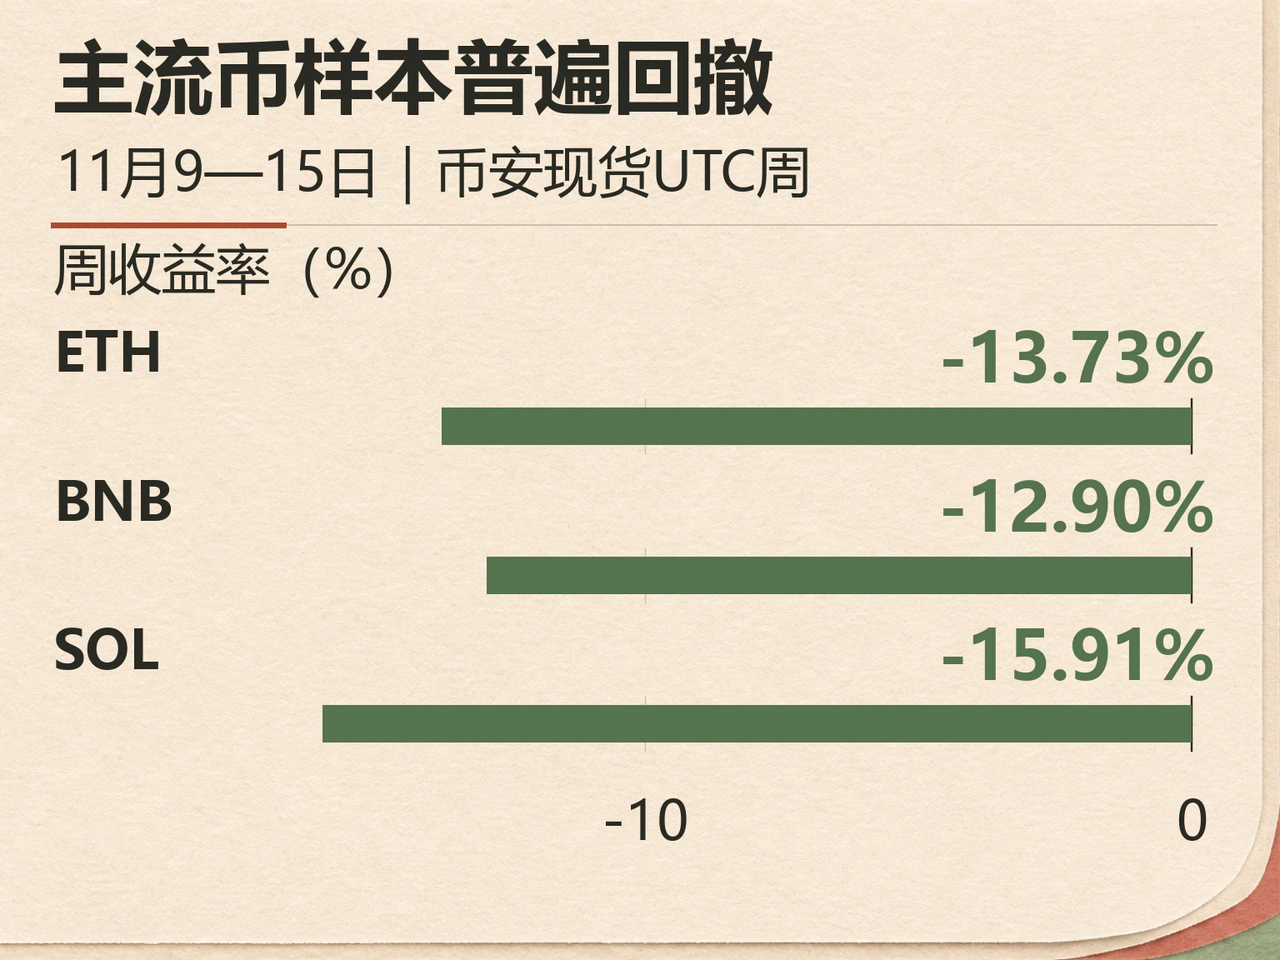
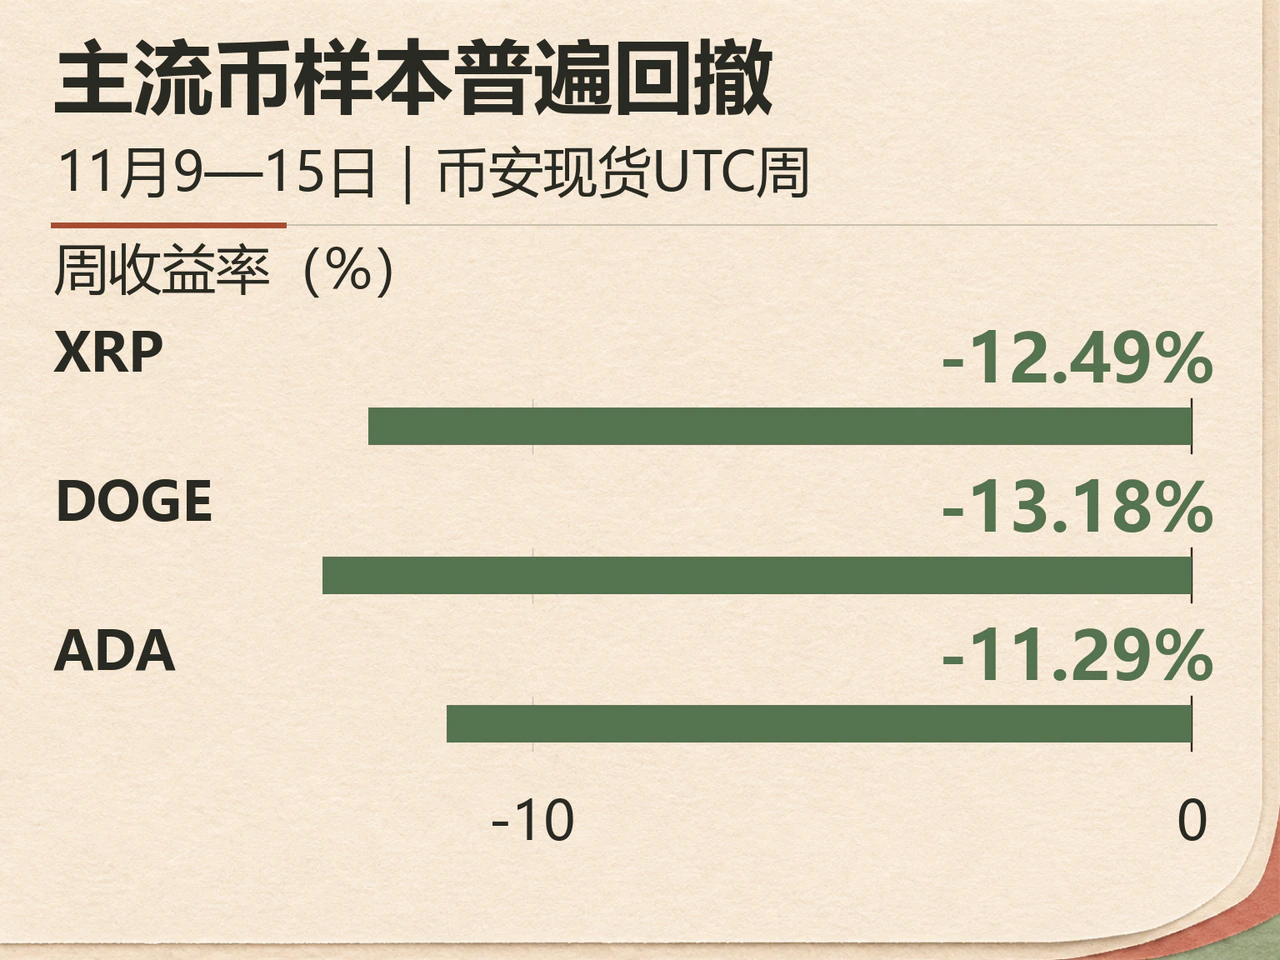
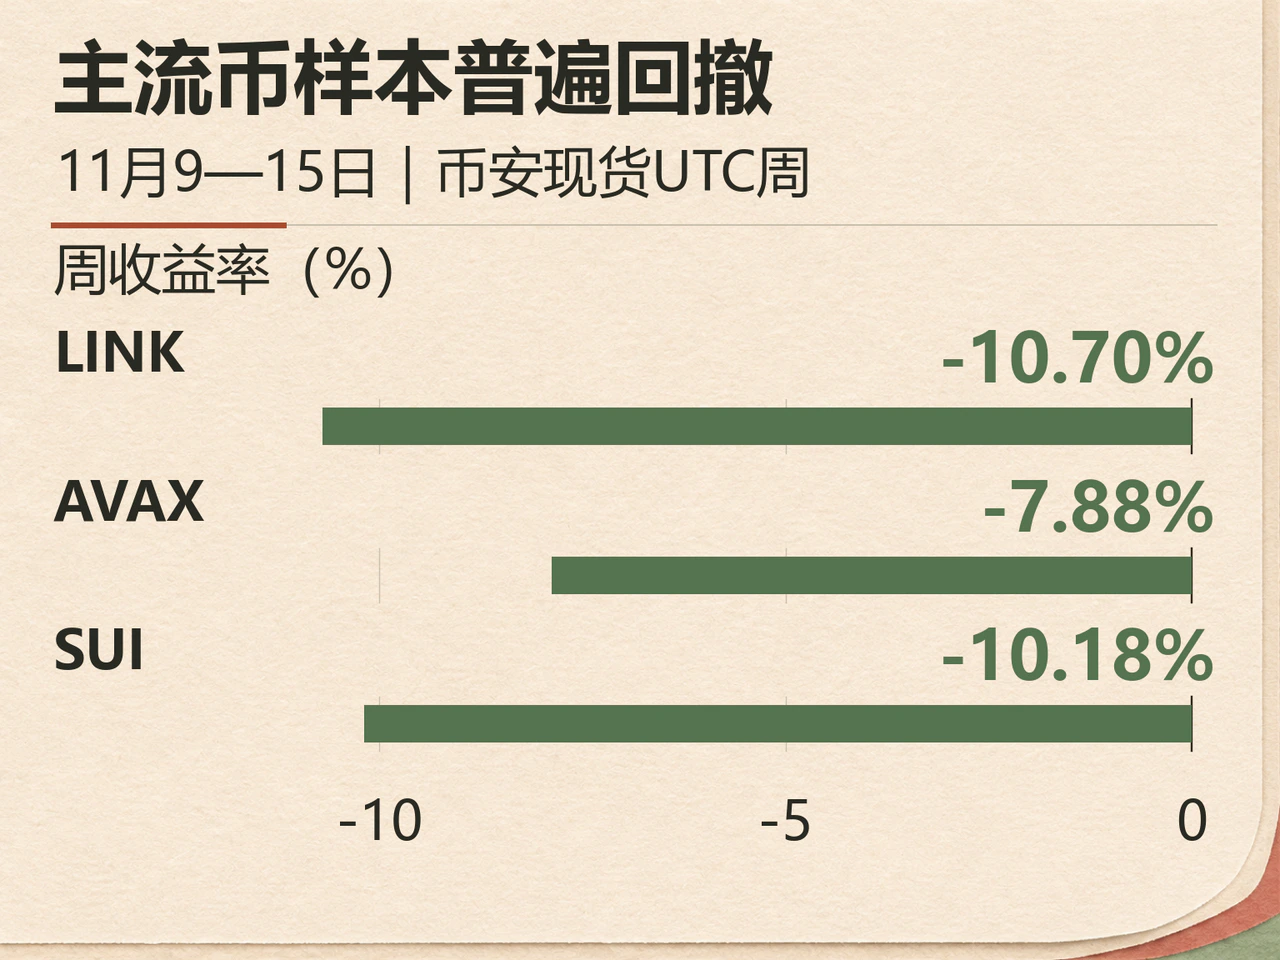
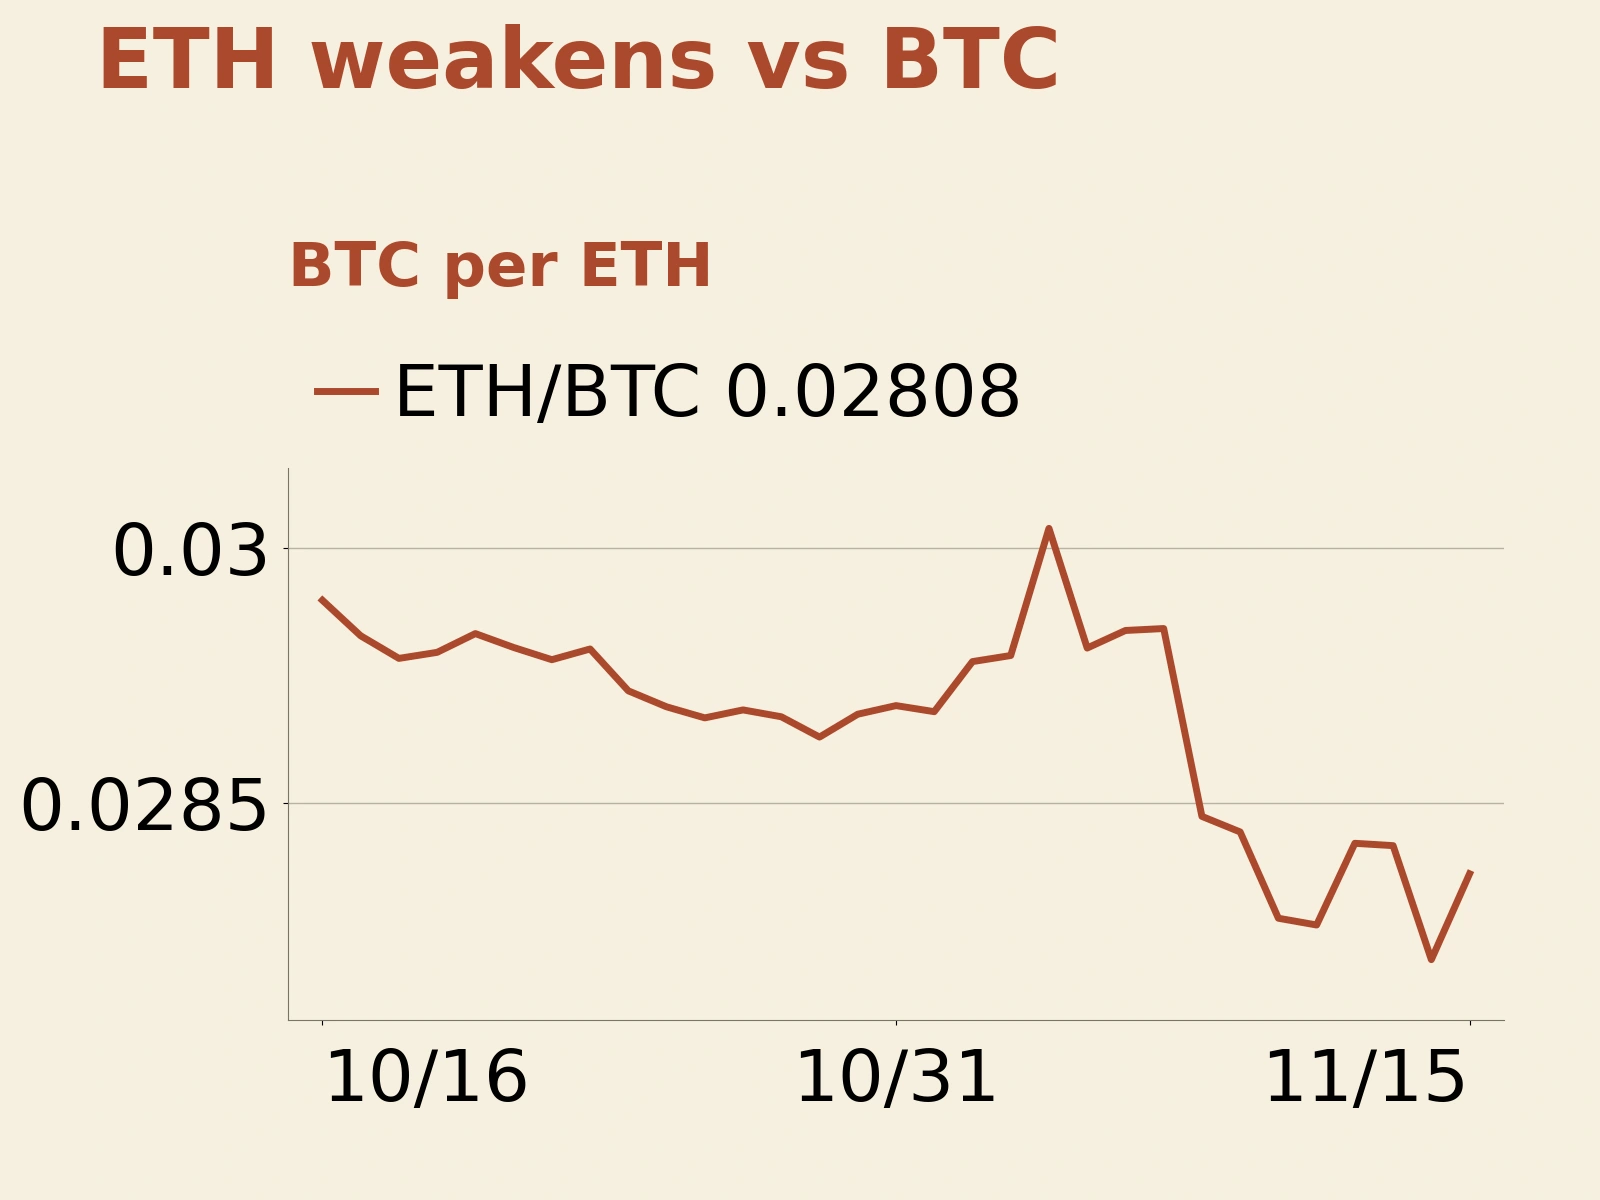
ETH continued to weaken against BTC. Dividing the ETHUSDT closing price by the BTCUSDT closing price at the same point in time gives an implied weekend ratio of 0.02808 BTC, down 1.19% for the week. This price structure reinforces the broad declines across the ten-coin sample: the sector retreated as a whole, with no widespread rotation out of BTC into other major assets yet evident.
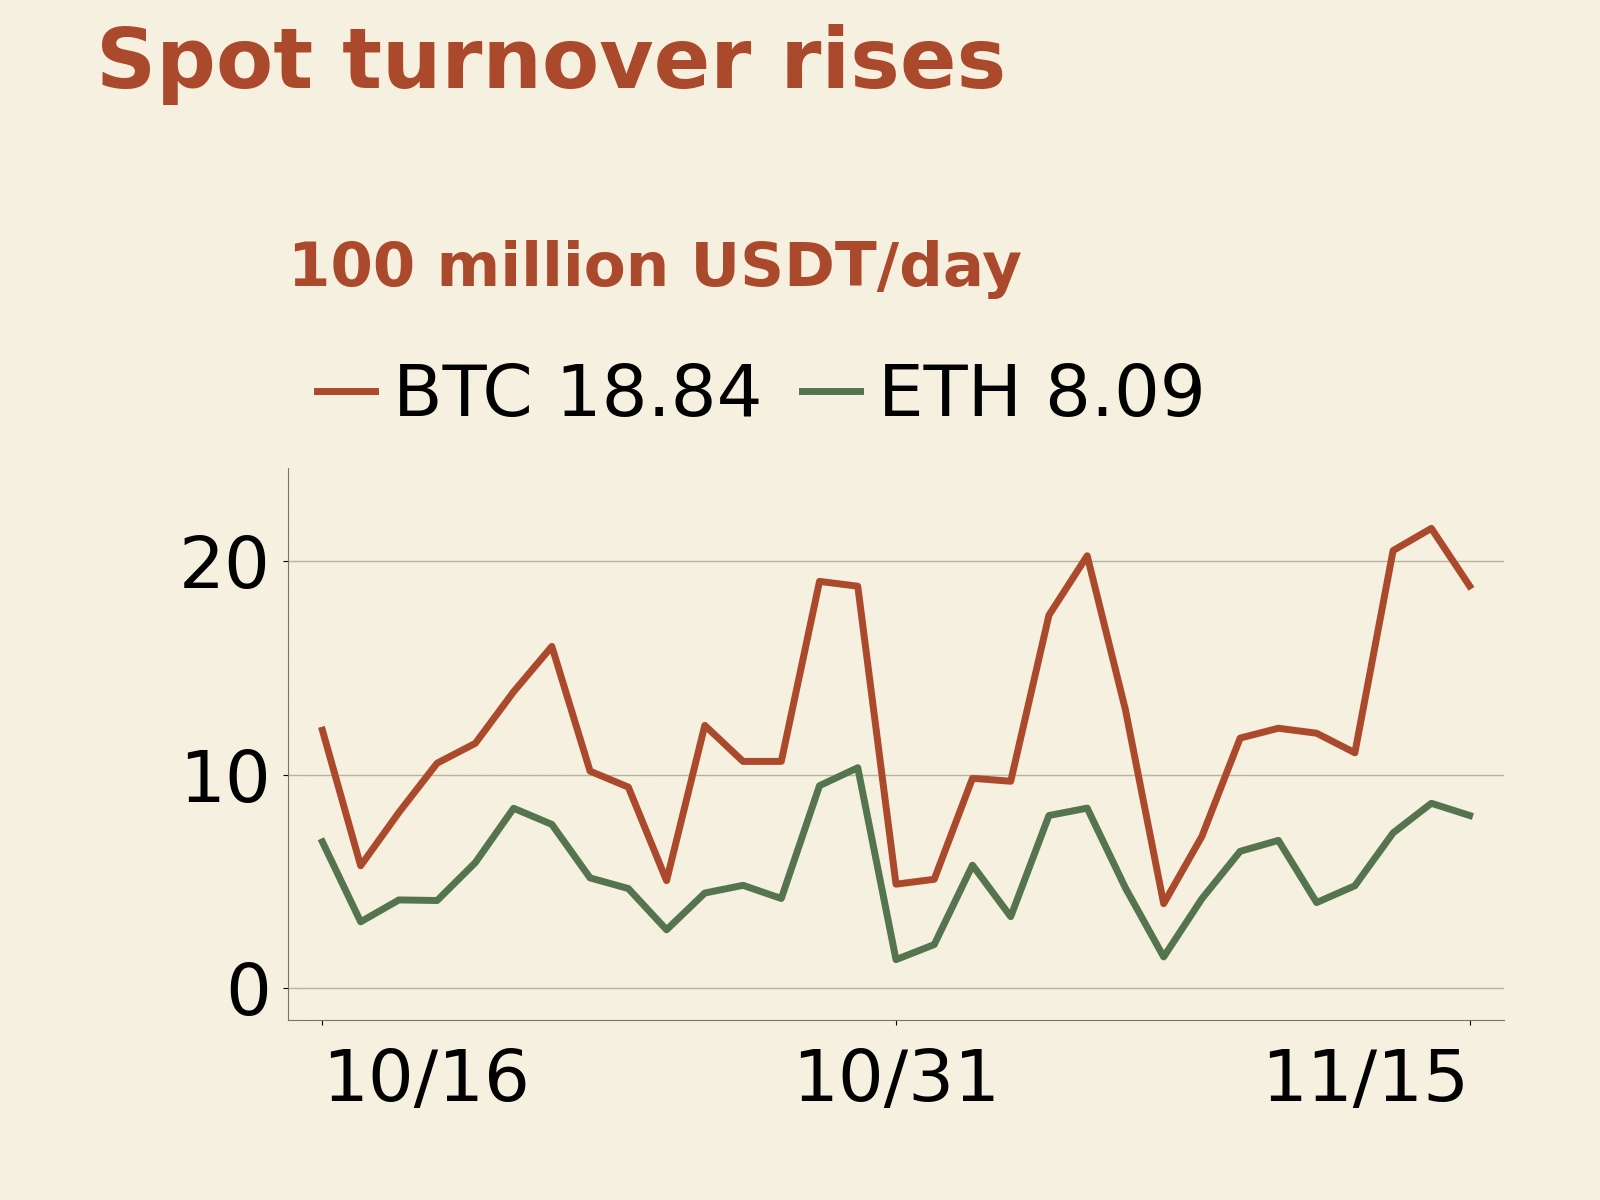
Turnover increased at the same time. Weekly Binance BTC/USDT turnover totaled 10.775 billion USDT, up 32.42% from the preceding week; ETH/USDT turnover reached 4.618 billion USDT, up 28.28%. Higher turnover during a sharp price decline reflects concentrated matching of sellers and buyers at lower prices. Taker-buy turnover accounted for approximately 48.93% of BTC turnover and 46.51% of ETH turnover. ETH's lower share indicates a stronger seller tilt in market-order activity. These figures cover only two Binance spot pairs and help assess buying and selling strength within that platform sample. Assessing market-wide order flow requires other data as well.
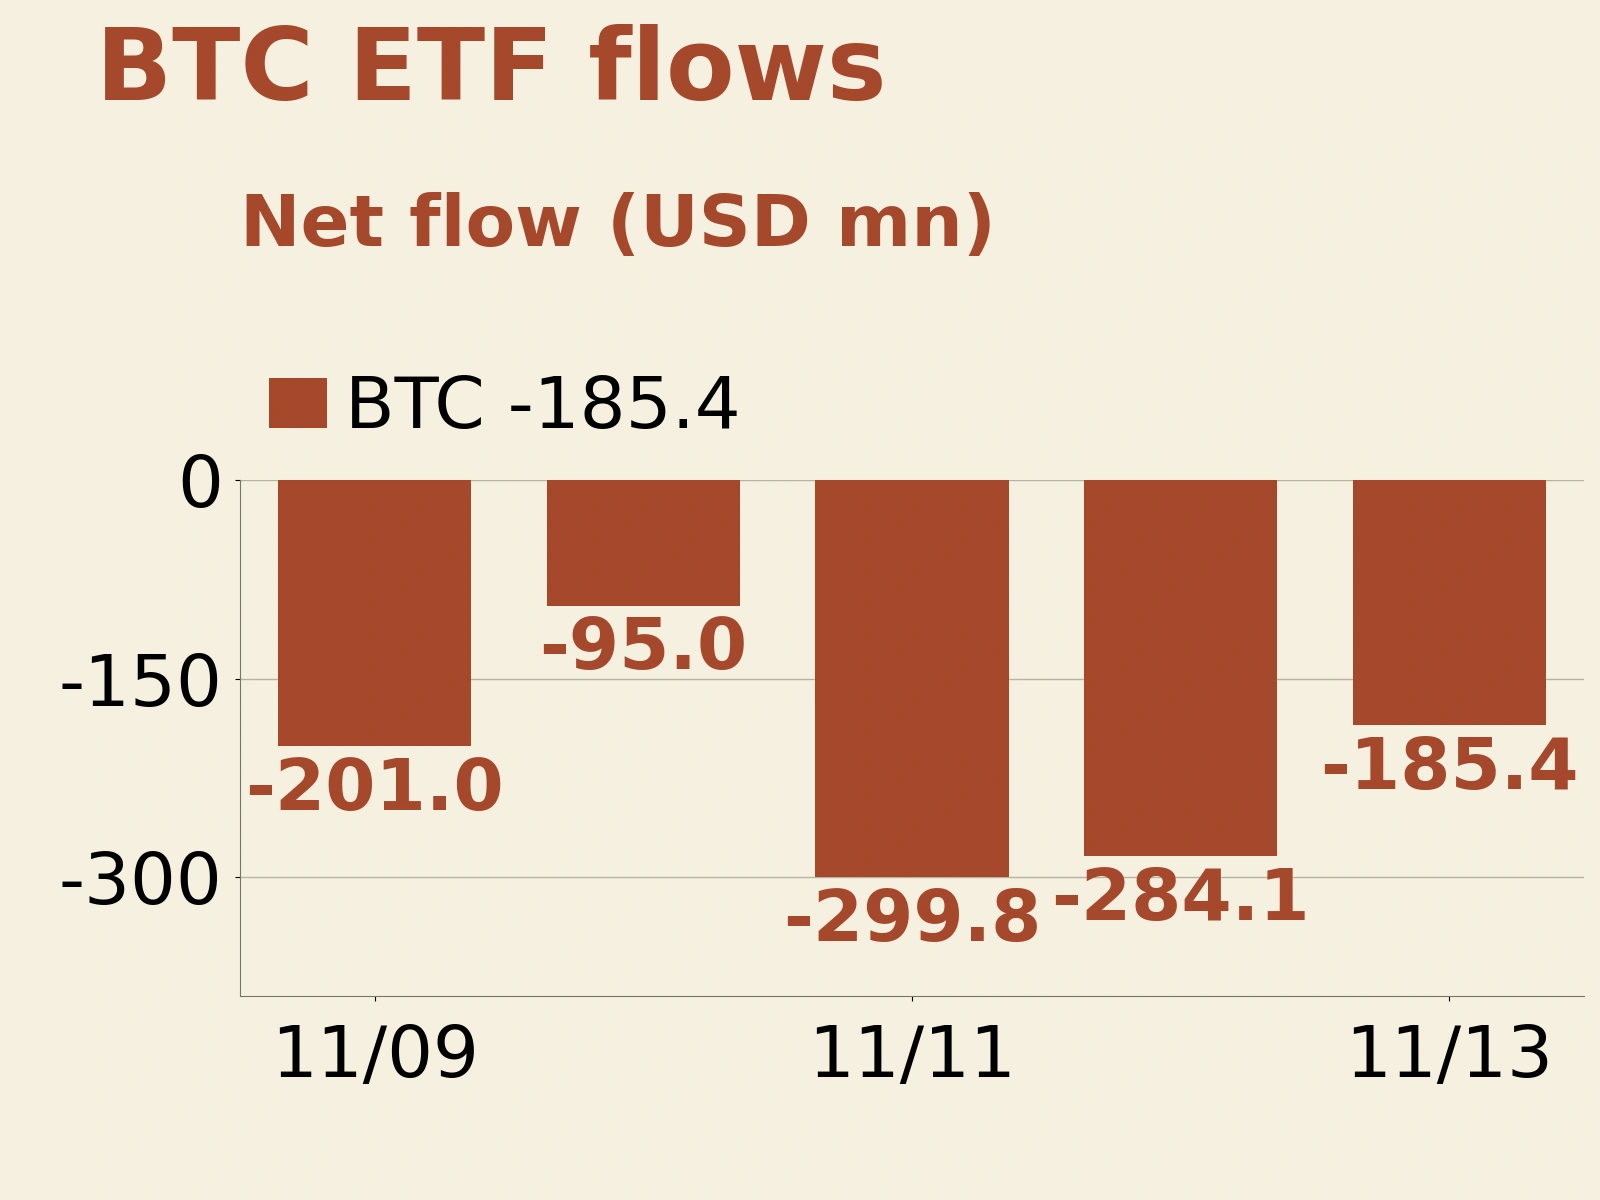
External capital had yet to provide an offsetting source of support. Aggregating Farside data for the five US trading days from November 9 to 13 shows net outflows of $1.0653 billion from US spot BTC ETFs and $398.9 million from spot ETH ETFs. US spot ETFs do not trade on weekends, so Sunday's price recovery took place in other markets. The next indicators to watch are the direction of ETF creations and redemptions when trading resumes, and whether spot turnover can keep pace with rising prices.
On Sunday, BTC rebounded from its weekly low to around 65,351 USDT, still below the previous weekend's 74,851 USDT. For that rebound to develop into a more durable recovery, fresh spot-market capital needs to absorb supply associated with redemptions and leveraged-position adjustments. A price recovery accompanied by sustained capital inflows would carry more weight than a brief round of covering after liquidations subside. Complete daily closes, ETF creations and redemptions, and spot taker activity will provide useful indicators. The central question left by last week is whether crypto markets can rebuild a stable base of spot buying after interest-rate expectations tightened.
Click the original article link for more details.