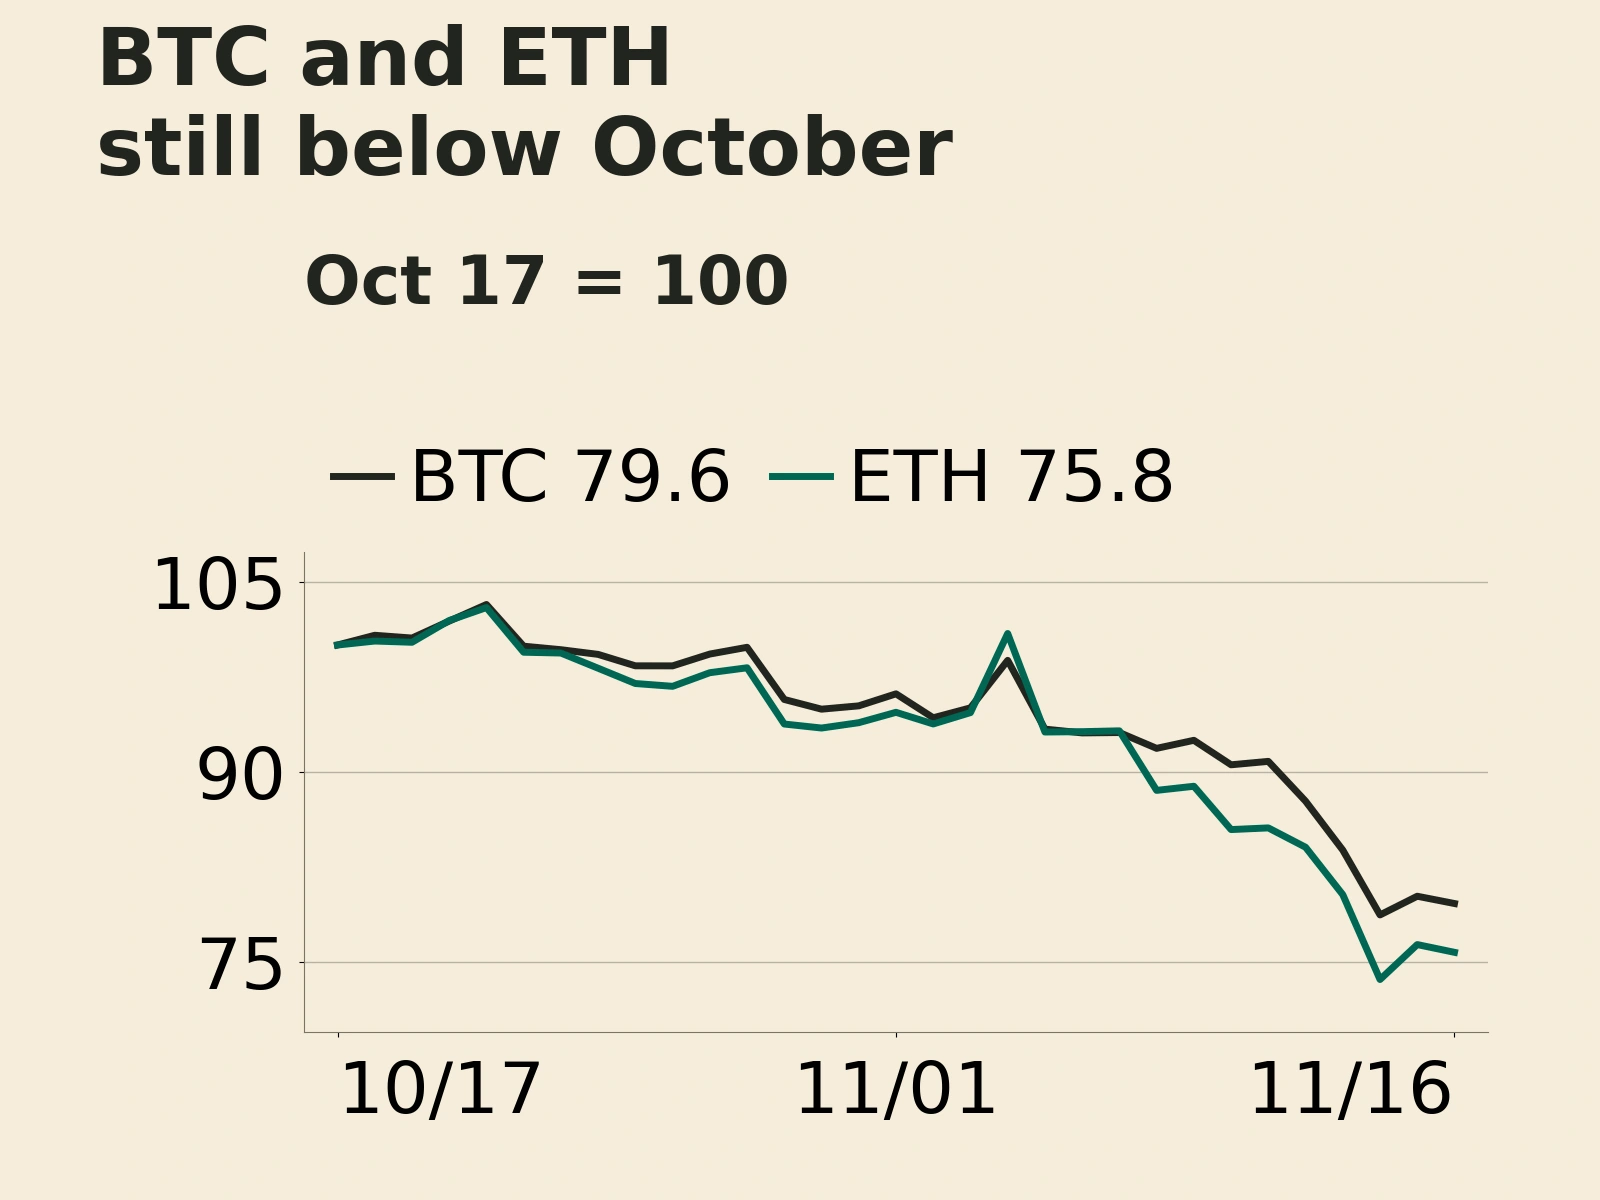
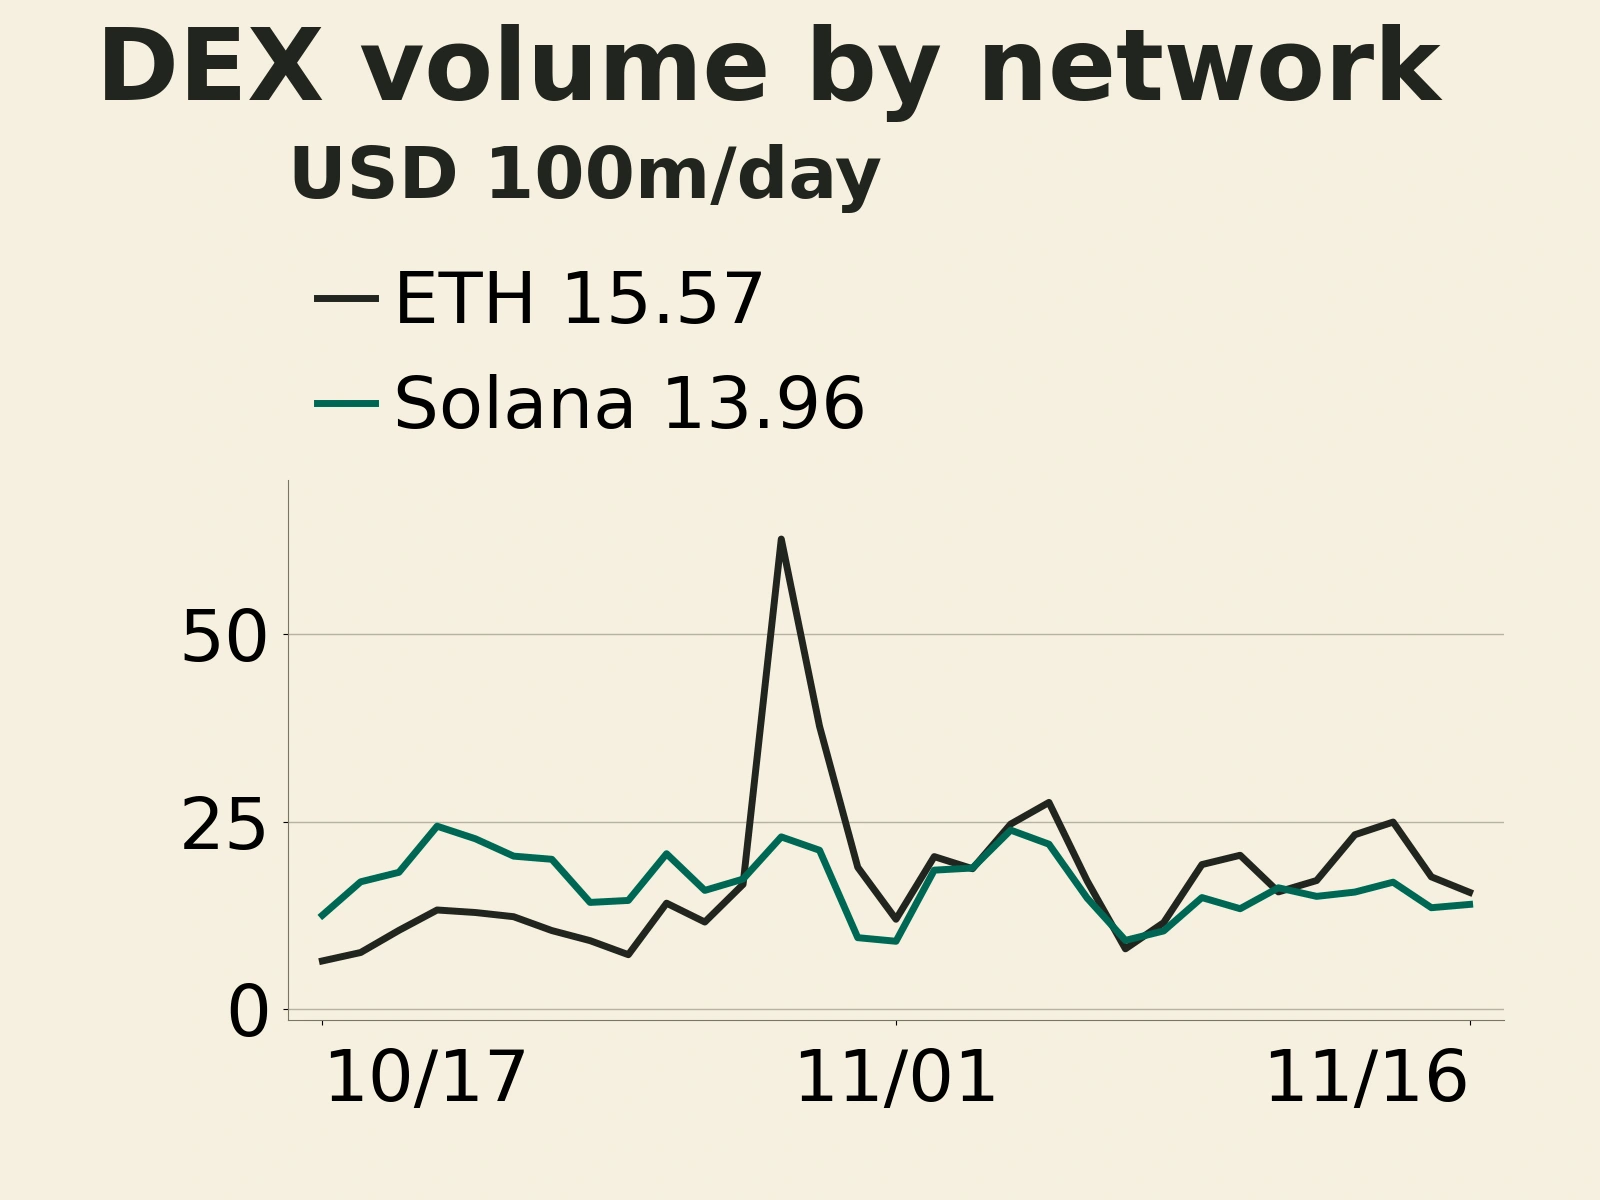
On November 16, 2026, the eight-hour funding rates on Binance’s BTCUSDT and ETHUSDT perpetual contracts turned positive in succession, while open interest in both contracted from the start of the period. This report covers trading from 08:00 on November 16 to 08:00 on November 17, 2026 (Beijing time). ETF creations and redemptions and the stock of stablecoins have yet to show a simultaneous return of allocation capital. Position adjustment remains the main theme in funding conditions: leverage and volatility expectations are cooling, while sustained allocation demand still needs confirmation from subsequent ETF flows and supply data.
Bitcoin ETFs lose $1.9074 billion over seven trading days; stablecoin market capitalization is broadly flat on the day
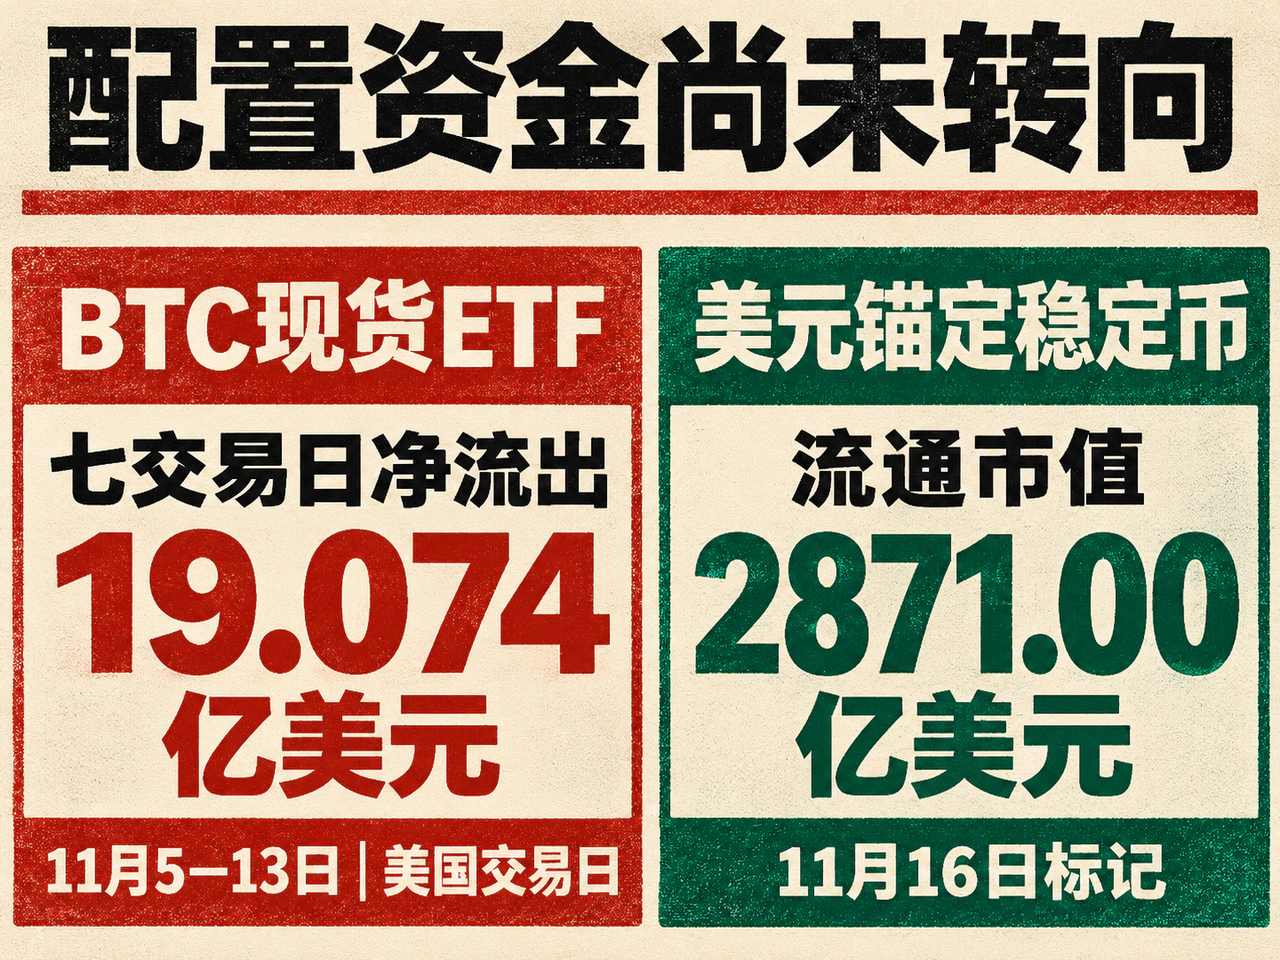
The latest complete disclosures available for this report on U.S. spot Bitcoin ETFs are for November 13. On Farside’s consistent reporting basis, net outflows that day were $185.4 million. The funds recorded seven consecutive trading days of net outflows starting November 5, totaling $1.9074 billion. On November 13, BlackRock’s IBIT lost $143.5 million and Fidelity’s FBTC lost $41.9 million. Together, these matched the day’s total net outflow, showing that exposure reductions extended to mainstream allocation vehicles.
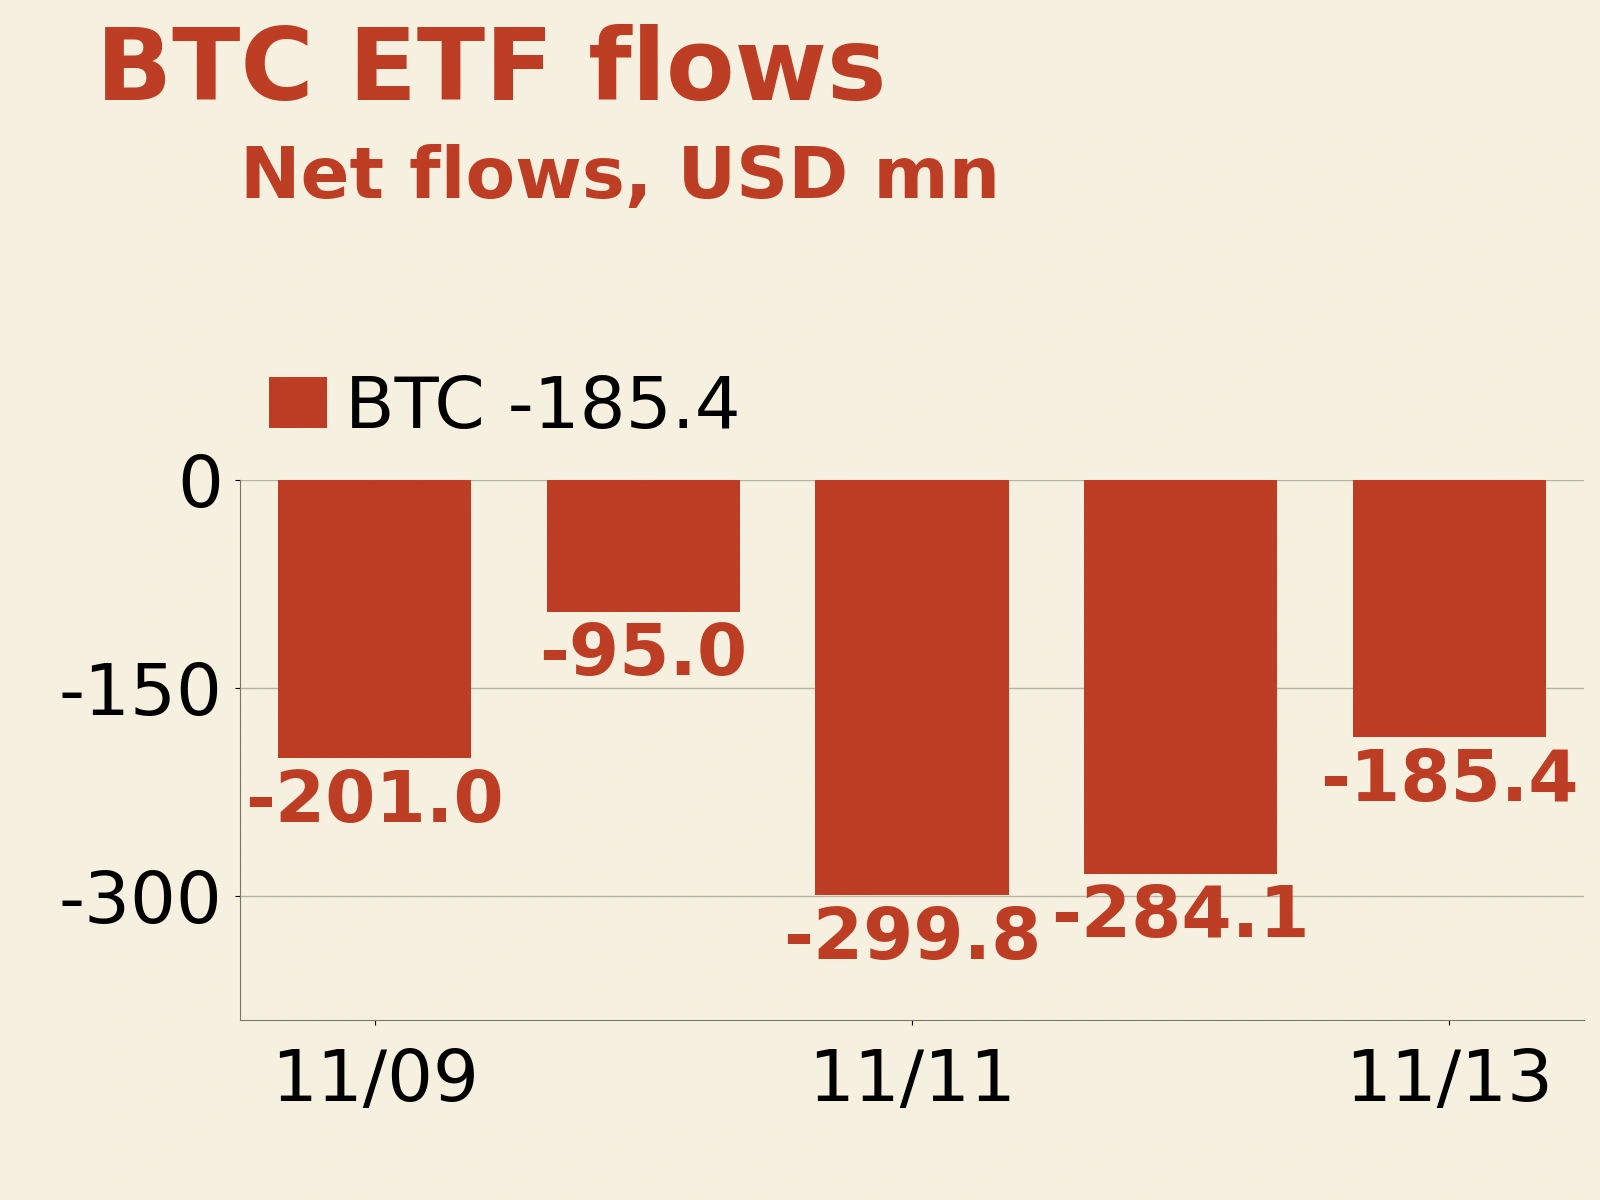
Net ETF creations and redemptions reflect the outcome of investors increasing or reducing exposure through these vehicles. Their motives may include long-term allocation, unwinding arbitrage positions or portfolio adjustments. As of November 13, this channel had yet to produce a sustained run of net buying to offset redemptions. The price recovery from the weekend low still faces pressure left by earlier withdrawals through this allocation channel.
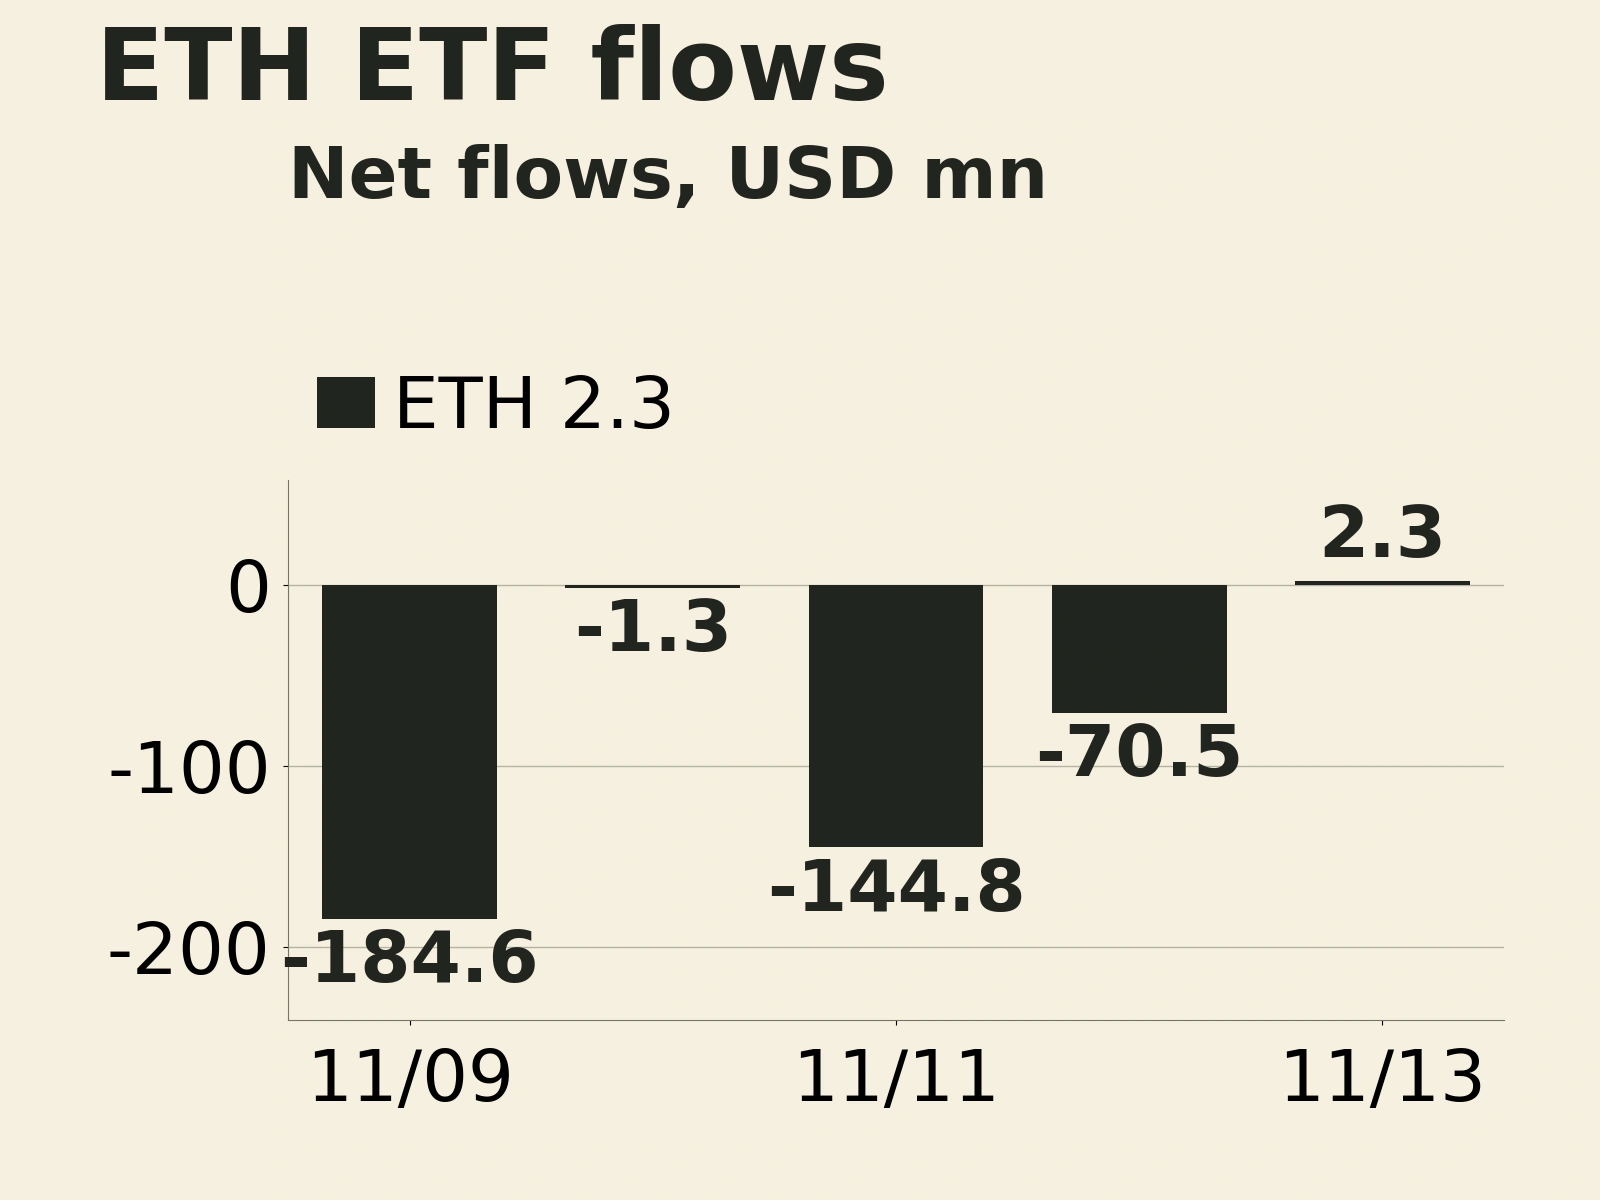
Ethereum ETFs showed a modest divergence. They received net inflows of $2.3 million on November 13, comprising $11.6 million into FETH and $9.3 million out of Grayscale’s ETH product. Despite turning positive for the day, cumulative net outflows over the latest seven trading days through that date were still $592.1 million. The single day’s inflow was small relative to the preceding withdrawals; whether it marks sustained improvement depends on subsequent creations and redemptions.
The latest daily change in stablecoin supply was broadly flat. DefiLlama’s circulating market capitalization for dollar-pegged stablecoins, with a date label of November 16, was approximately $287.100 billion, up only about $3.32 million from the previous day. It was down $4.123 billion from seven days earlier and $15.631 billion from 30 days earlier.
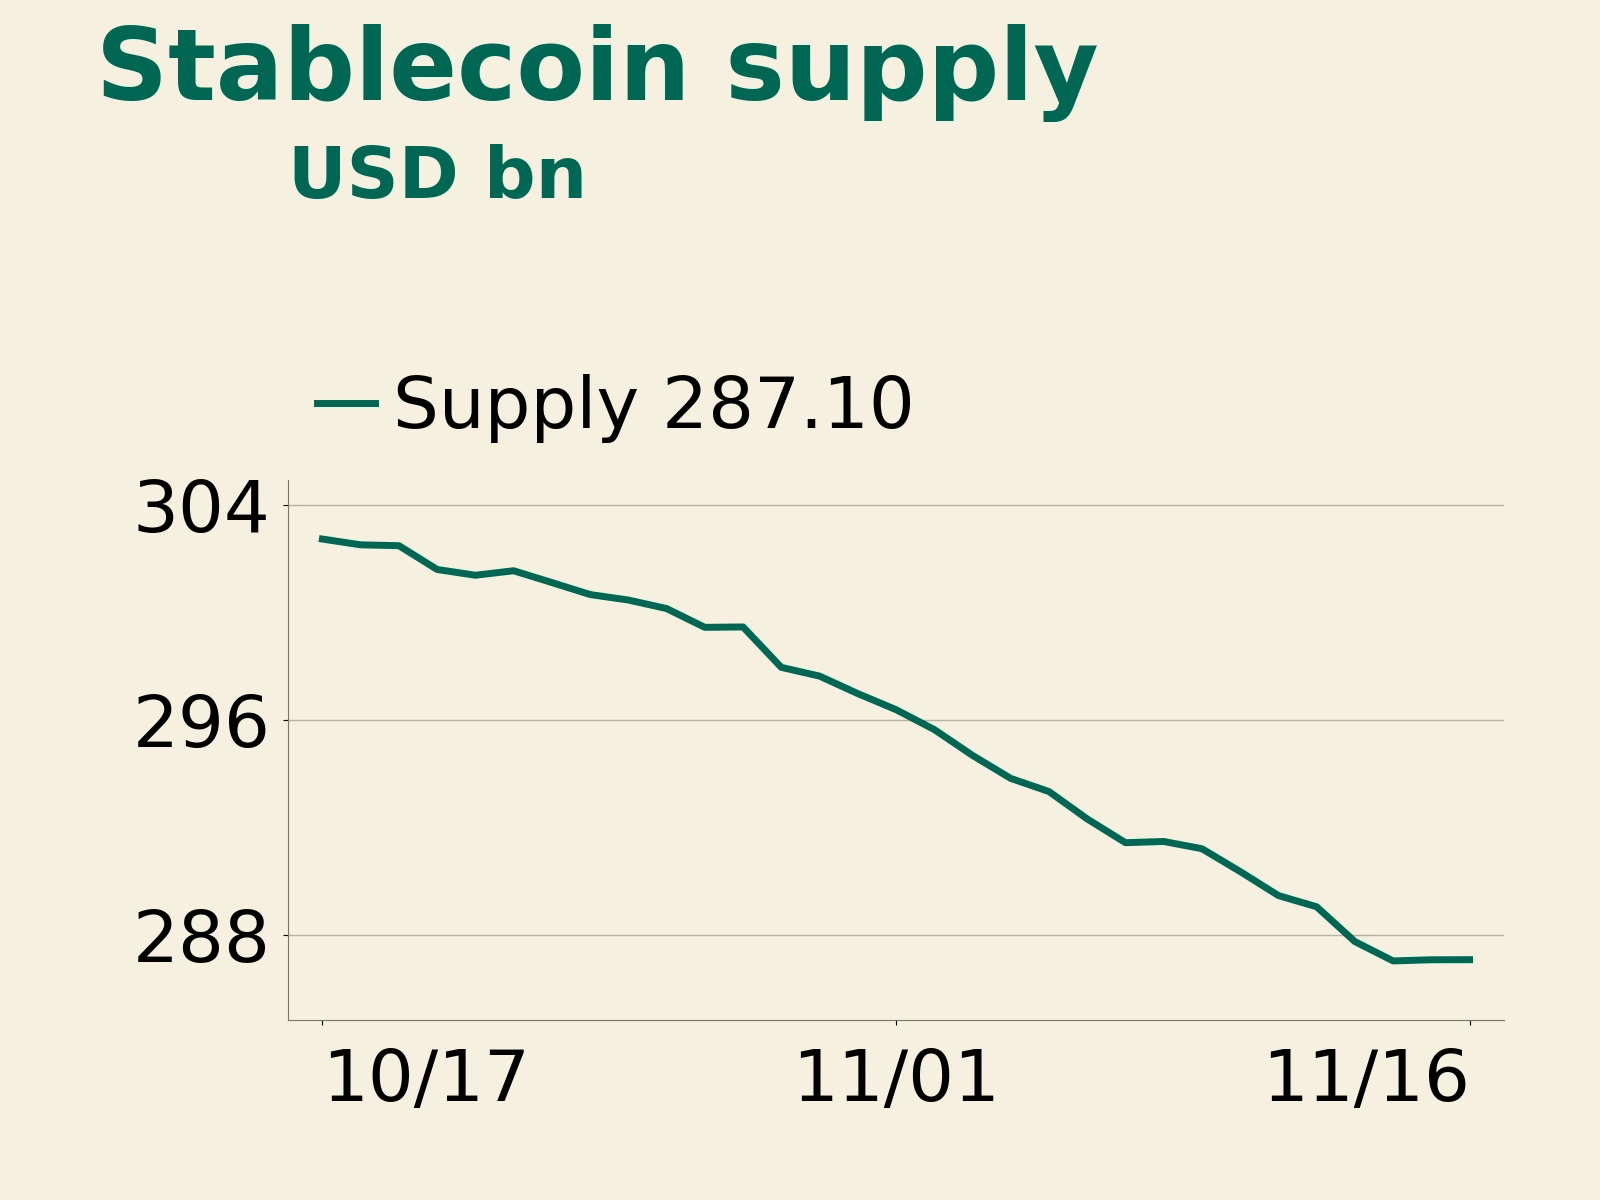
This stock measures the scale of dollar settlement instruments within the crypto system. Changes reflect issuance, redemptions and circulation status, as well as valuation effects when stablecoin prices deviate from their pegs. The latest daily change has flattened out, but the seven-day and 30-day windows still show contraction. Taken together with ETF flows, allocation channels remain net sellers and the on-chain dollar liquidity pool has yet to expand again.
Bitcoin’s final funding rate rises to 0.006177%; open interest and DVOL keep falling
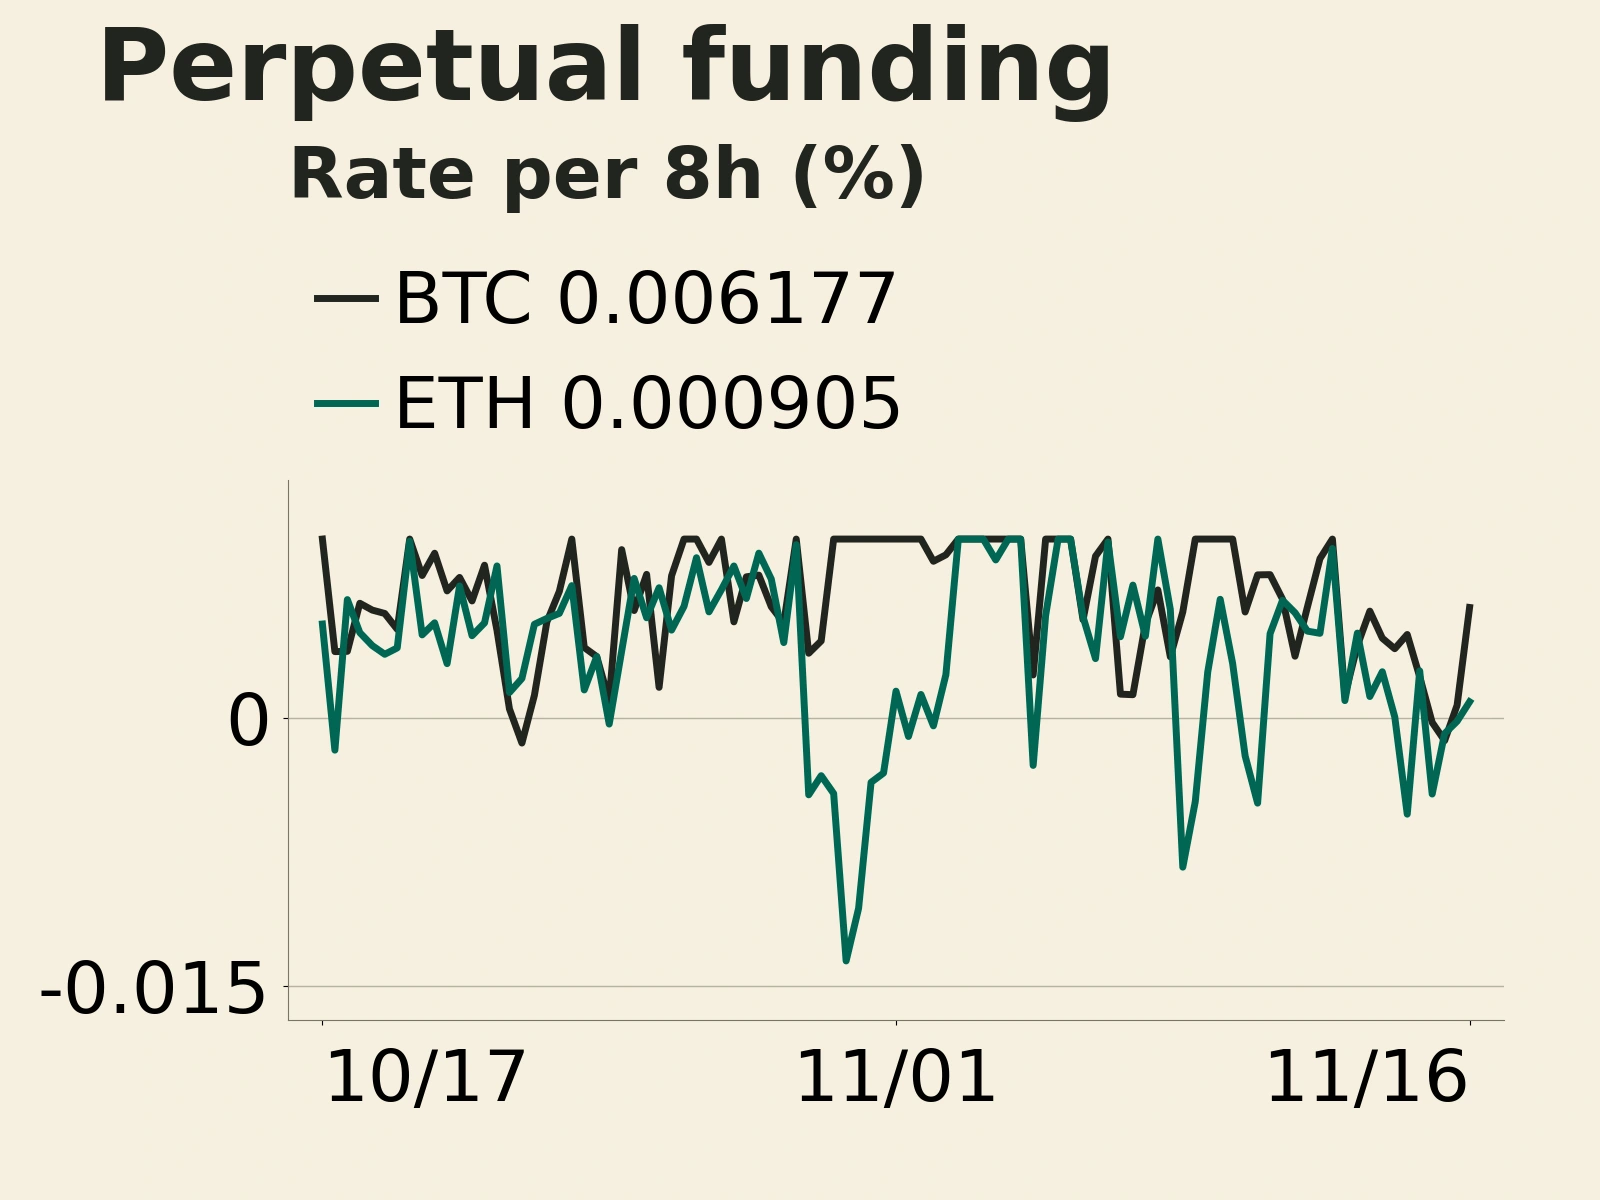
Leveraged markets adjusted more quickly. The table below shows the actual settled eight-hour funding rates for Binance perpetual contracts at the three settlements on November 16:
| Contract | UTC 00:00 | UTC 08:00 | UTC 16:00 |
|---|---|---|---|
| BTCUSDT perpetual | -0.001265% | 0.000717% | 0.006177% |
| ETHUSDT perpetual | -0.000867% | -0.000184% | 0.000905% |
BTCUSDT turned positive at 08:00, followed by ETHUSDT at 16:00. At the final settlement, longs paid funding to shorts in both contracts, with BTCUSDT carrying the higher rate. These actual settlement rates show the direction of funding payments between longs and shorts at each point in time.
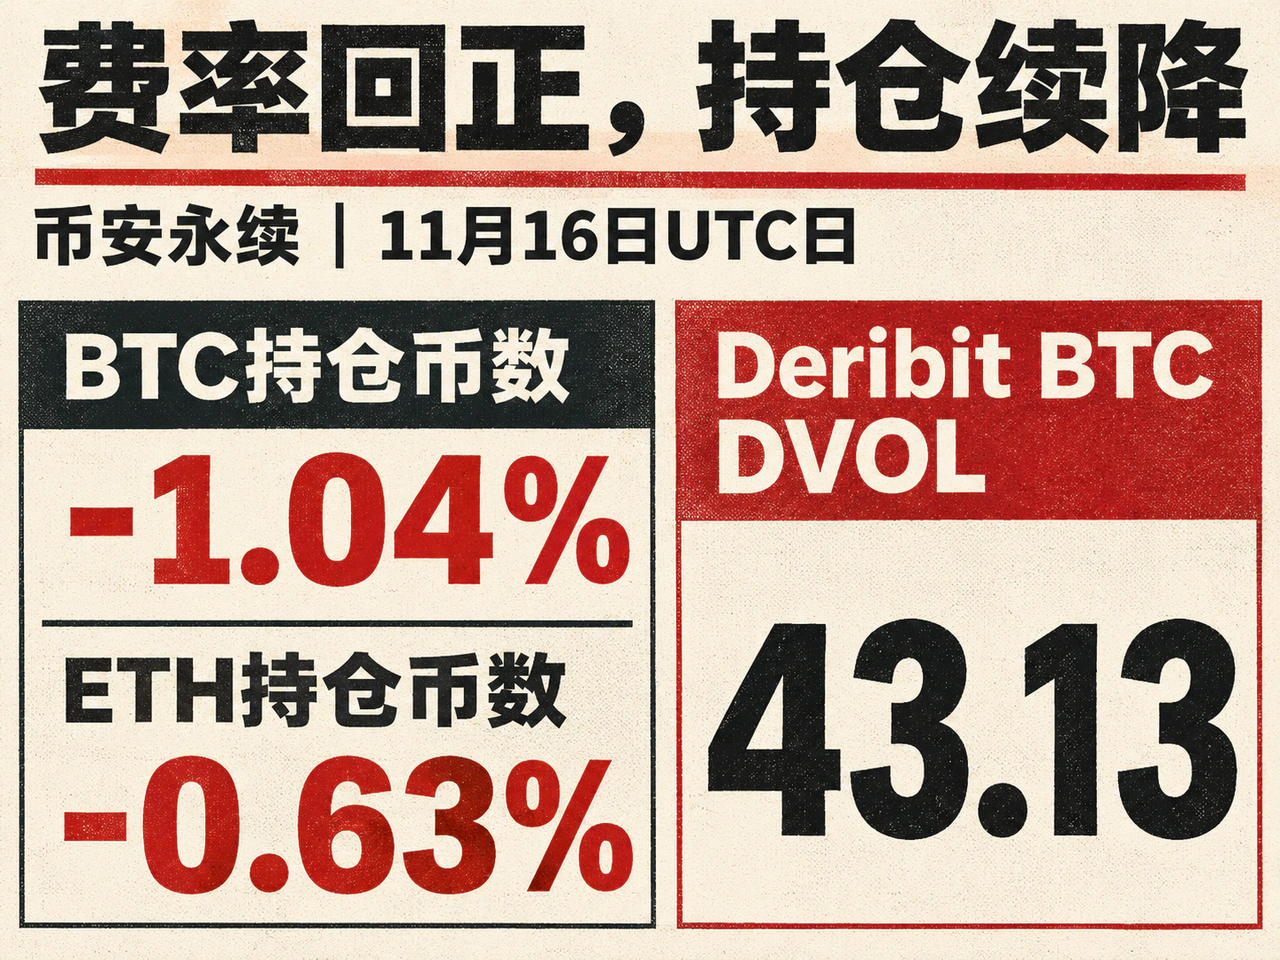
The recovery in funding rates coincided with a contraction in open interest. At 00:00 UTC on November 17, the closing boundary of this report’s trading window, Binance BTCUSDT open interest stood at 92,552.81 BTC, down 1.04% from the period’s starting point at 00:00 UTC on November 16. ETHUSDT open interest was 2,284,265.26 ETH, down 0.63%. In dollar notional terms, the respective declines were 1.74% and 1.43%. The smaller declines in coin-denominated quantities show that the fall in position values reflected both a contraction in contract exposure and lower coin prices.
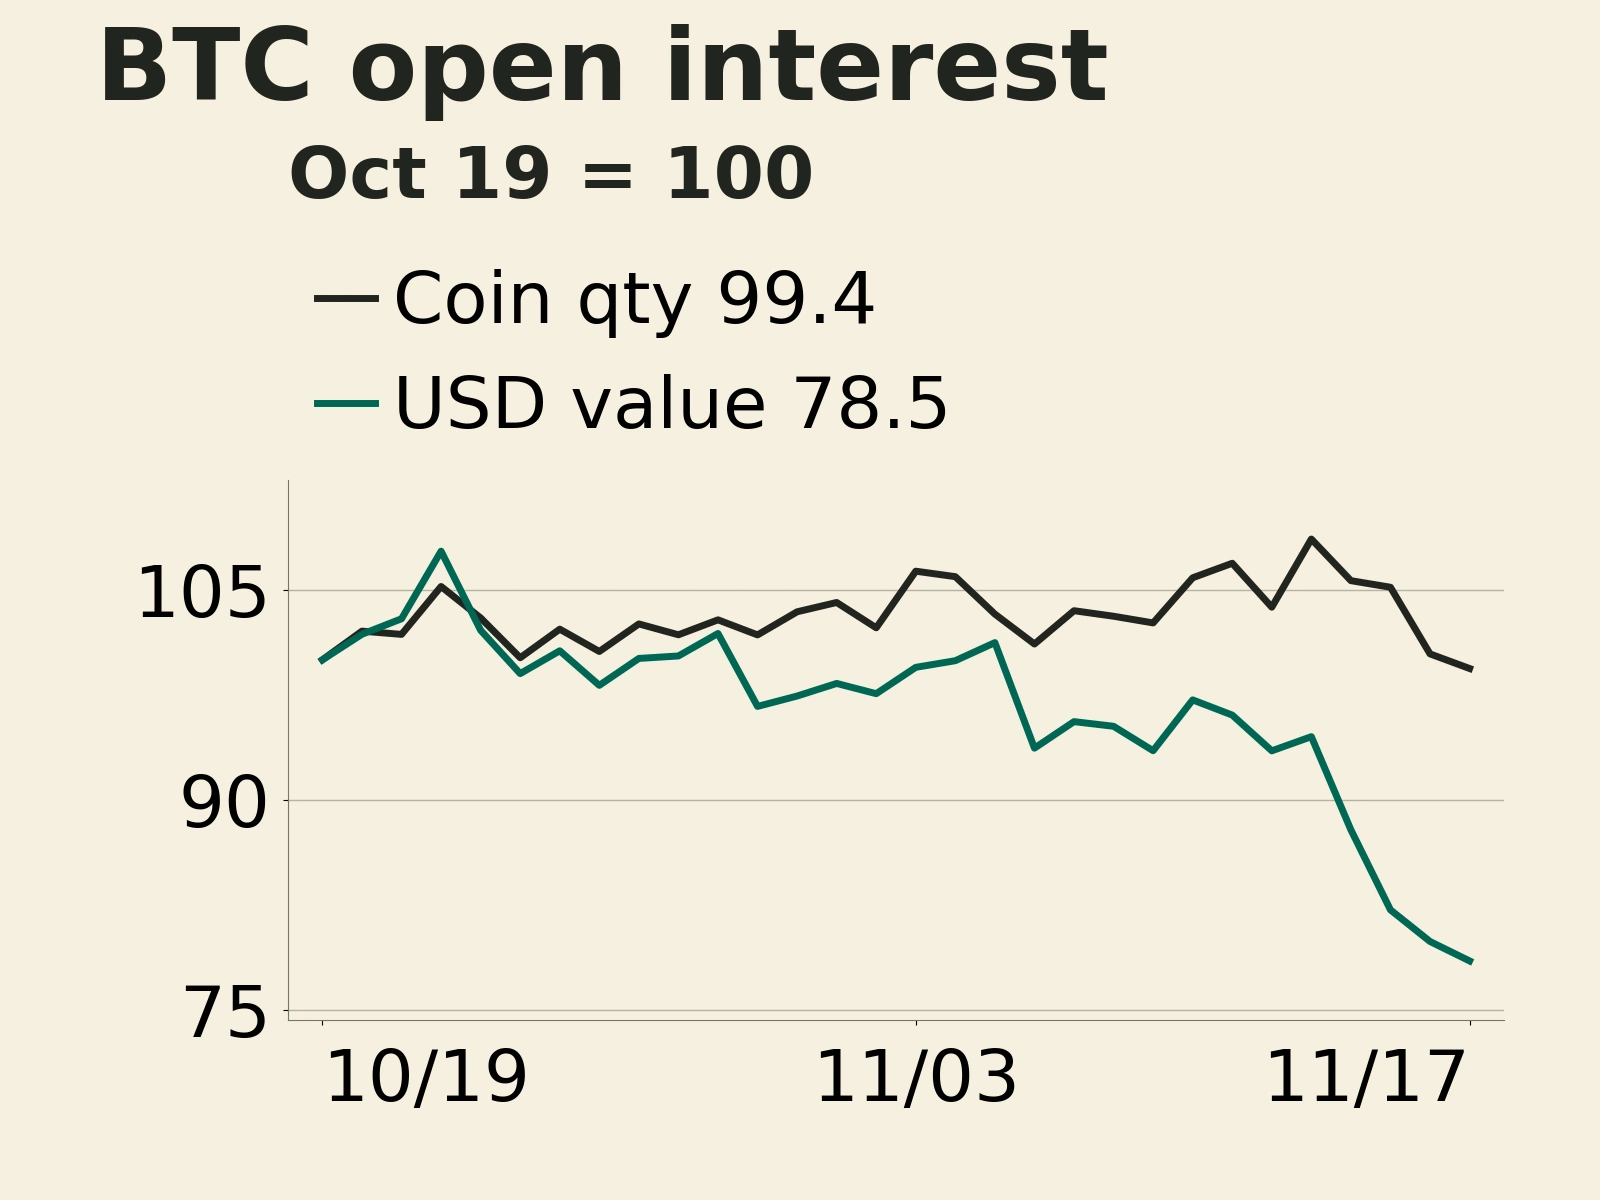
Every outstanding contract has both a long and a short, so a decline in aggregate open interest cannot identify which side actively exited. Nevertheless, longs had become the paying side by the final settlement while outstanding contracts were still declining: positive funding rates had yet to be accompanied by a fresh expansion in risk exposure. Position clearing can ease forced selling pressure, but whether the price recovery lasts still depends on spot-market capital taking over.
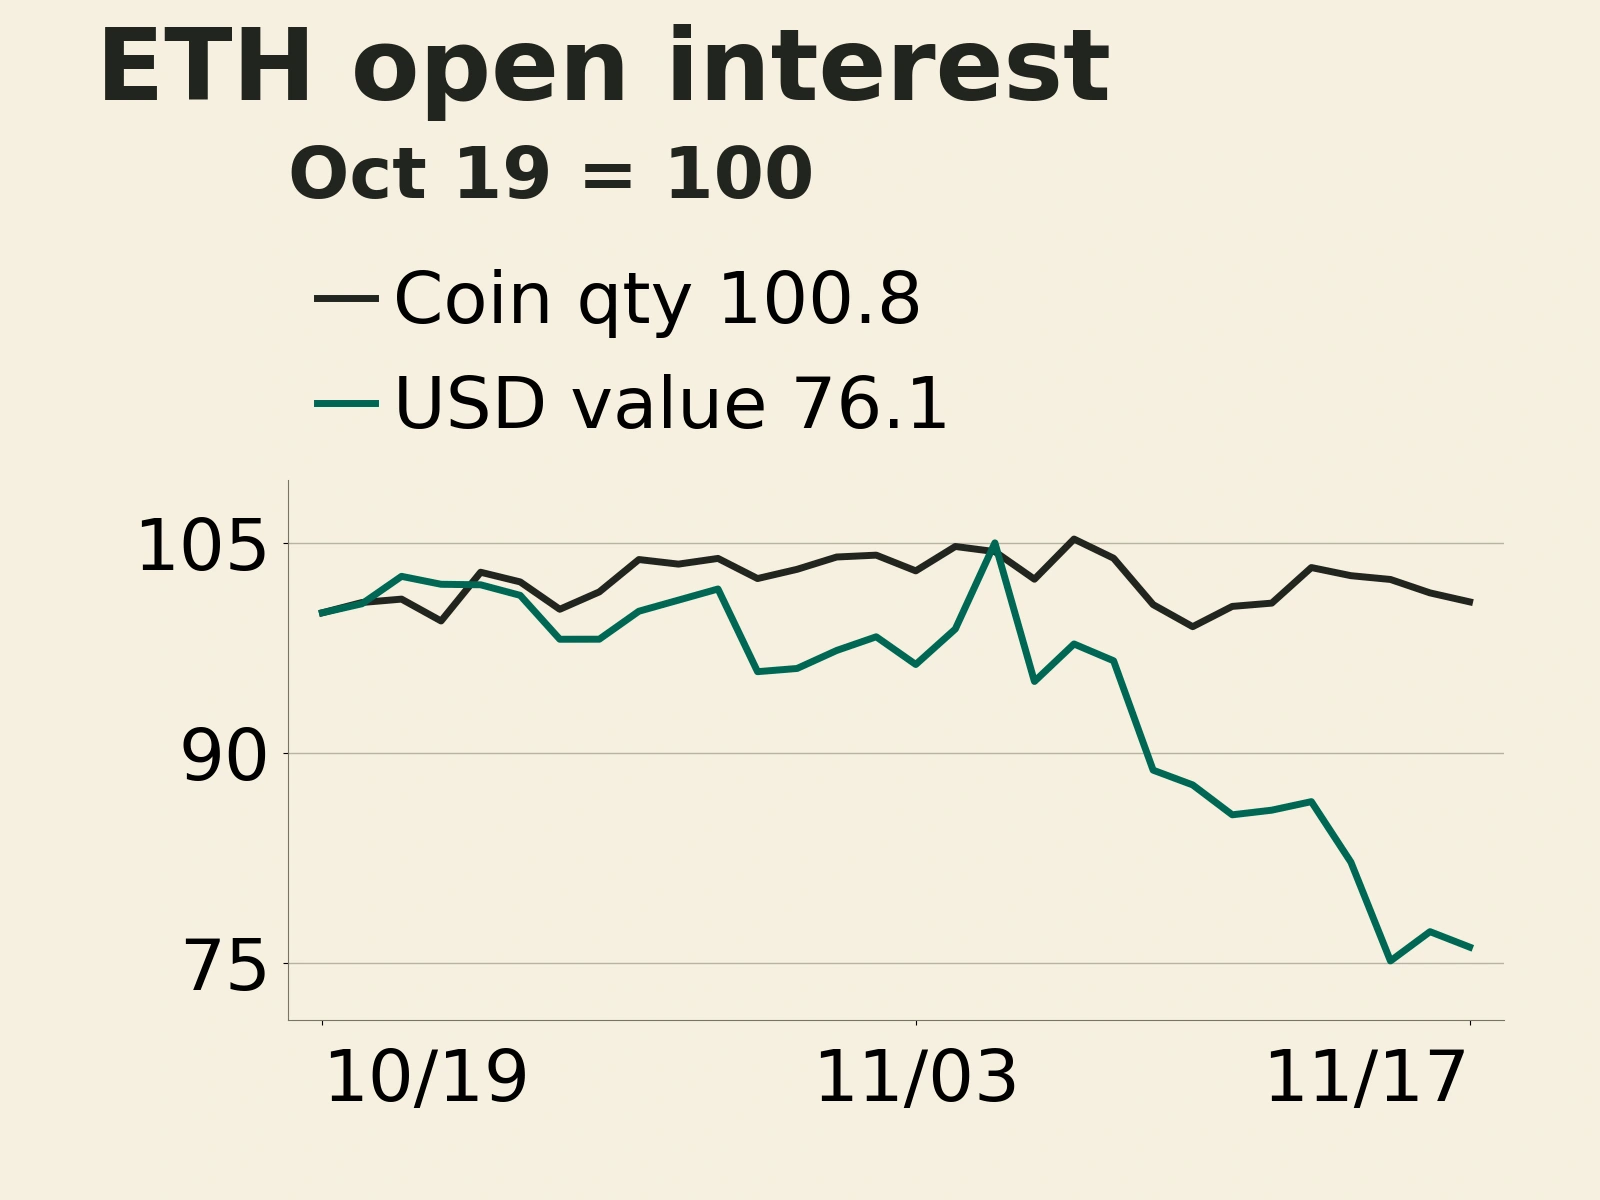
Research published by Bitfinex on November 16 attributed the weekend rebound mainly to short covering and noted that new positions had repeatedly replaced liquidated positions during the preceding price decline. This cross-market observation contrasts with the decline in Binance open interest at the period’s end, indicating that the pace of adjustment differs across venues and time windows. Assessing deleveraging requires tracking both coin-denominated open interest and actual settled funding rates; dollar notional open interest also needs to be interpreted alongside price changes.
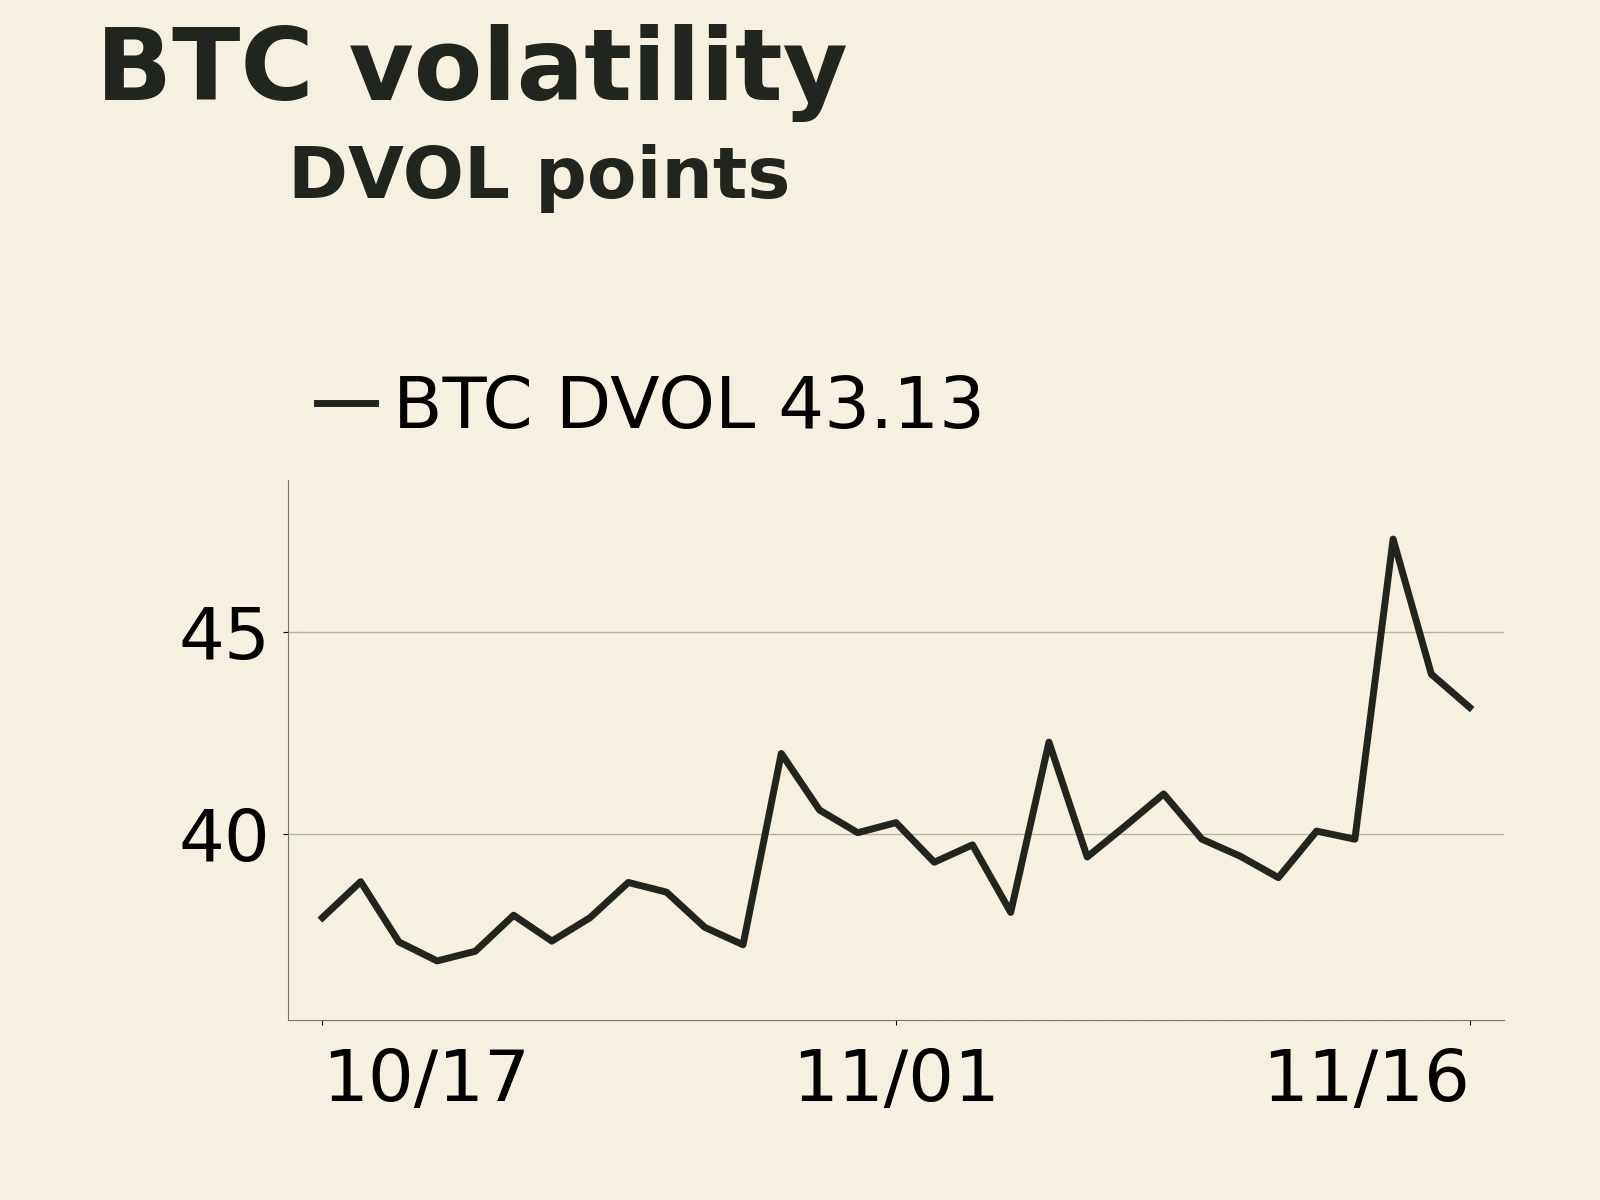
Options pricing is cooling too. Deribit’s Bitcoin volatility index, DVOL, closed its November 16 daily session at 43.13, below the previous day’s 43.95, reflecting lower pricing of future volatility in the options market. Across the data, the initial improvement in funding conditions takes the form of less crowded risk positions: funding rates have turned positive and open interest and volatility expectations have fallen, while ETFs and stablecoins have yet to expand in tandem. Whether ETFs shift to consecutive net inflows and whether stablecoin market capitalization reverses its medium-term contraction are two indicators to watch for a recovery in allocation demand.
Click through to the original article for further details.