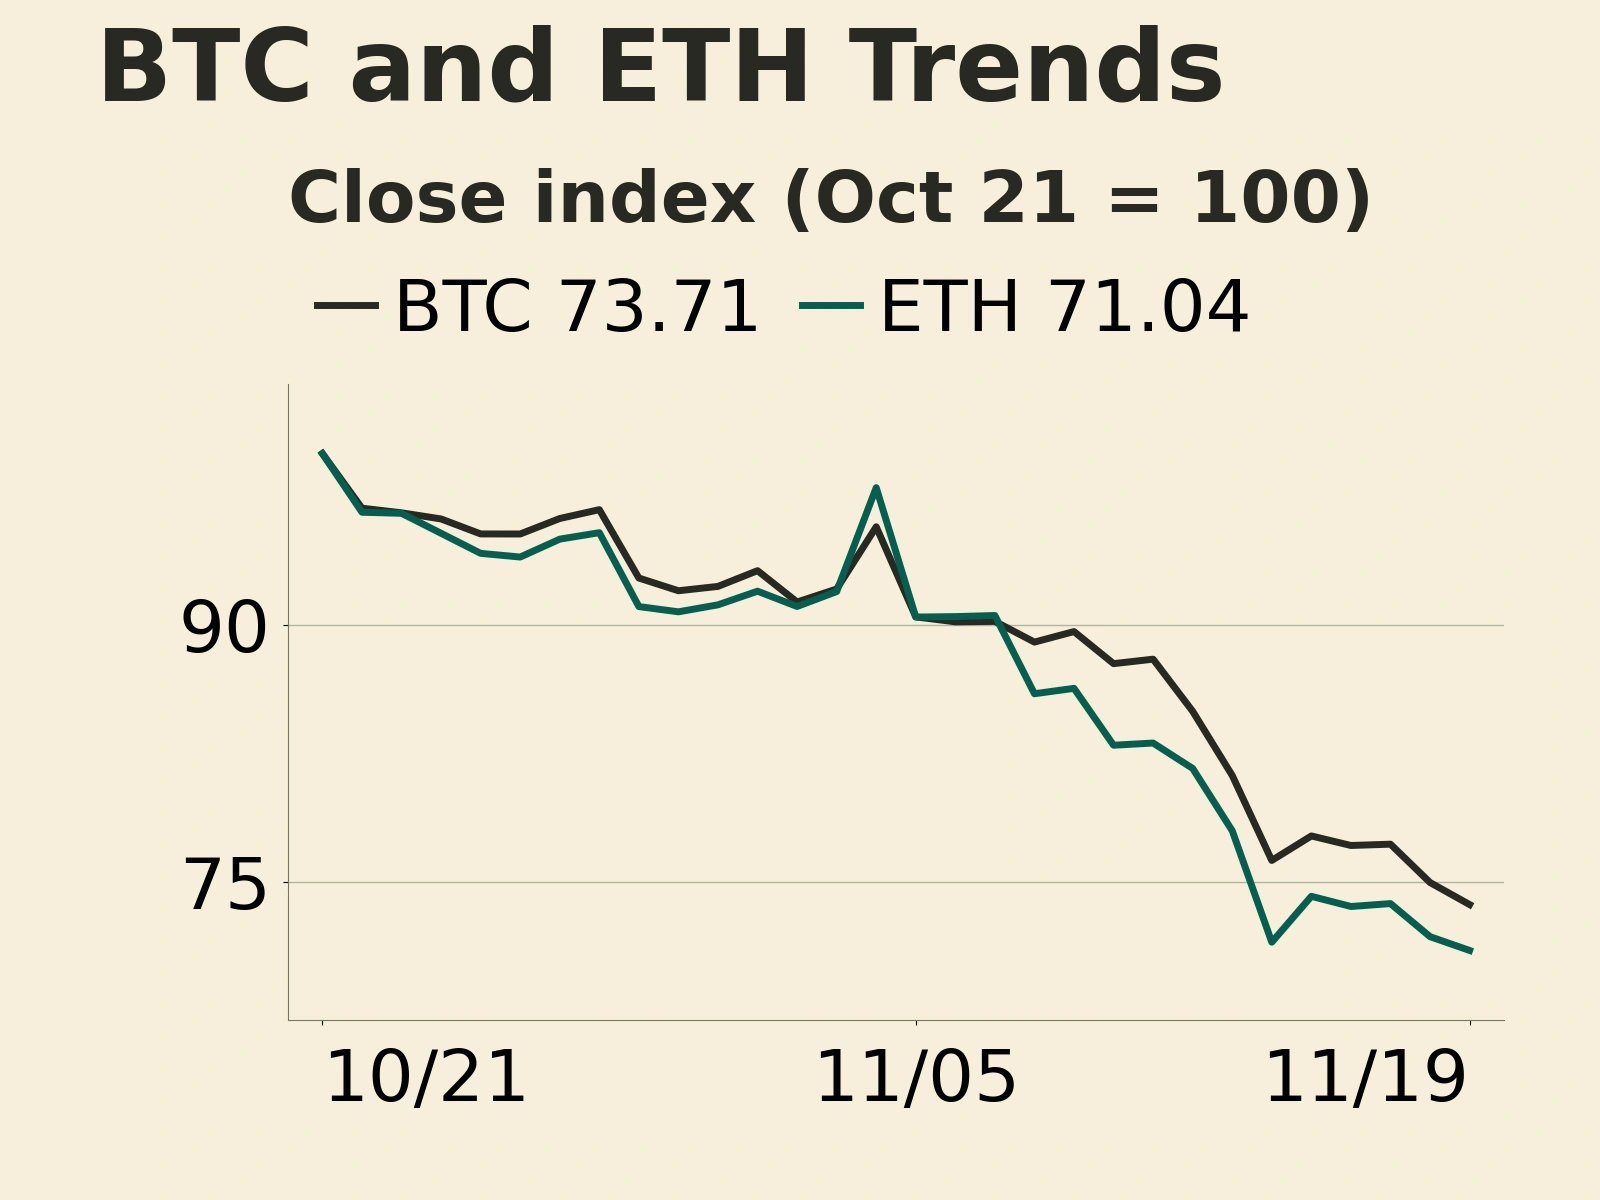
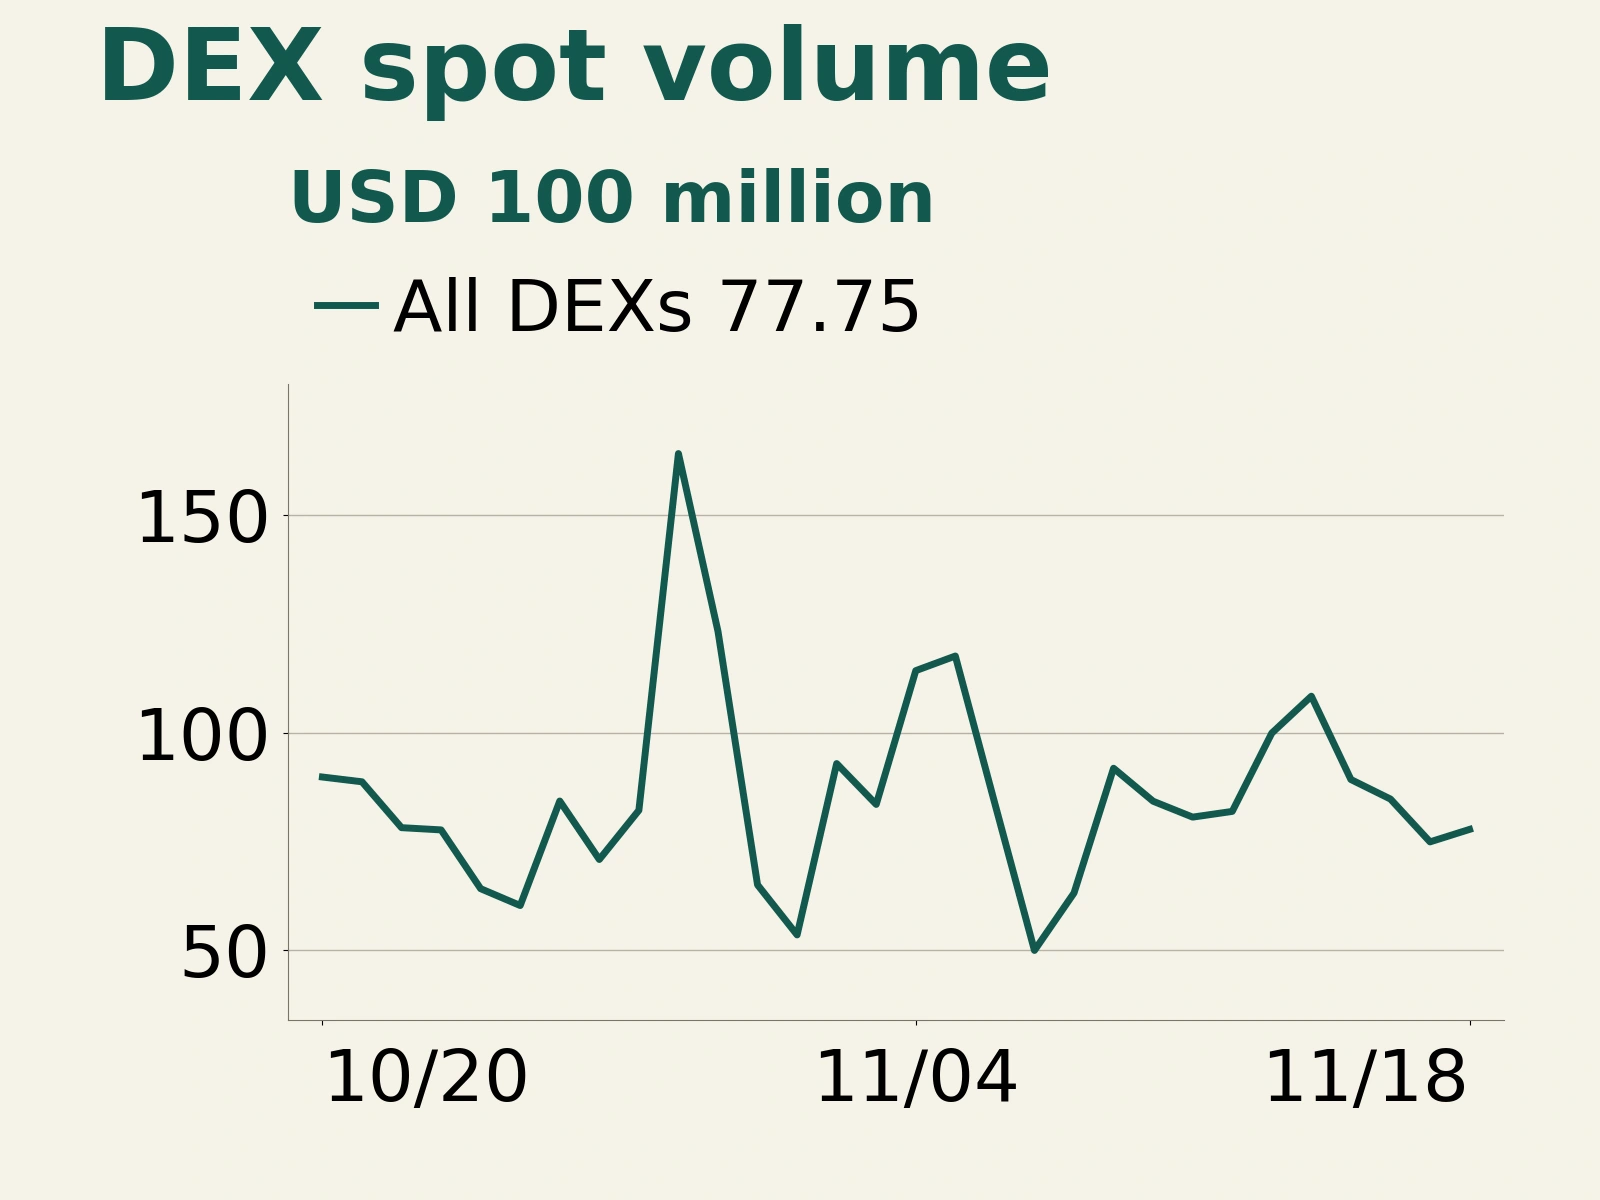
On November 19, 2026, measured over the UTC trading day, the USDT value of open interest in Binance's bitcoin perpetual contracts fell by nearly 1%, while open interest measured in bitcoin rose by 701 BTC. Over the preceding two U.S. trading days, U.S. spot bitcoin ETFs recorded combined net outflows of $546 million, reflecting actual redemptions of fund shares. In the perpetual market, traders continued to carry positions through the close and pay to retain long exposure. Demand for spot allocations weakened, while leveraged positions did not contract in step.
ETF redemptions grow as stablecoin balances shrink

Farside's fund-level data show that U.S. spot bitcoin ETFs still attracted $7.9 million in net subscriptions on November 16, before recording net outflows of $239.9 million on November 17 and a larger $306.5 million on November 18. Redemptions on November 18 were spread across multiple products: BlackRock's IBIT lost $148.7 million and Fidelity's FBTC lost $69.3 million, together accounting for roughly 70% of that day's net outflows. Over the same period, net outflows from U.S. spot ether ETFs also increased, from $29.1 million on November 17 to $39.8 million on November 18. Complete subscription and redemption figures for November 19 were not yet available.
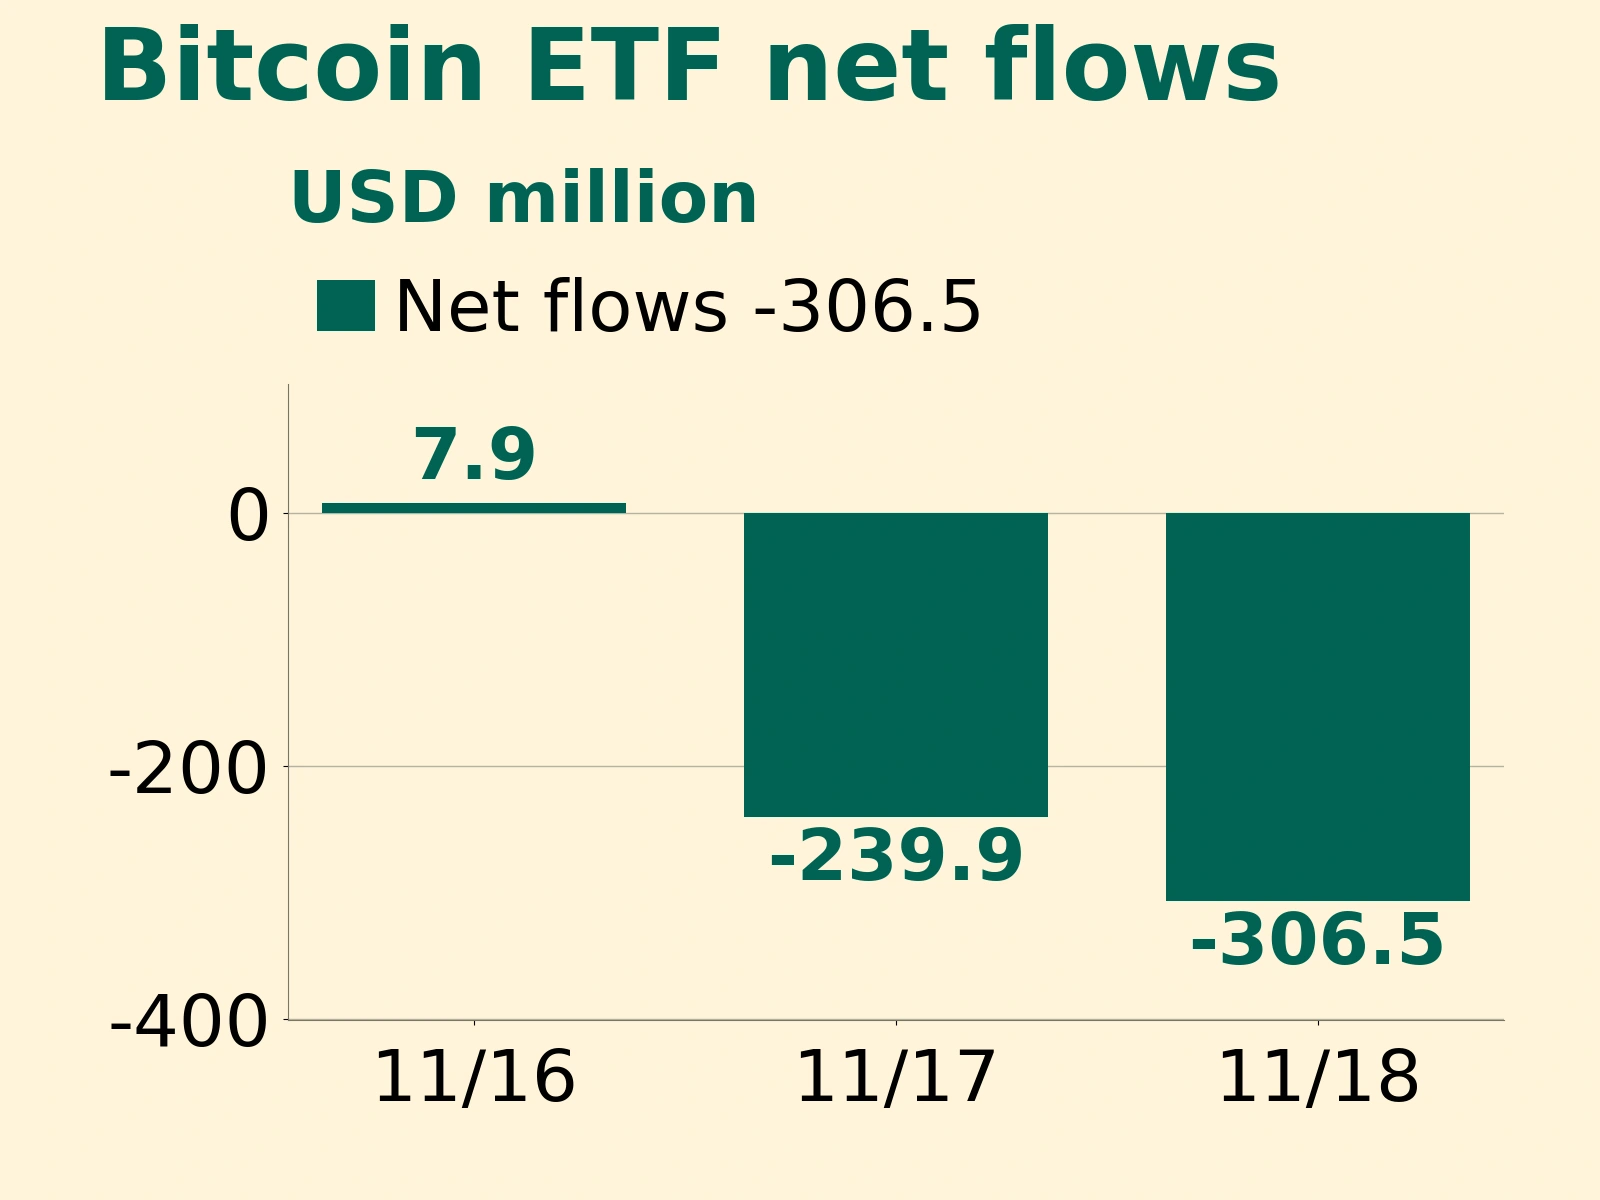
Falling coin prices reduce fund assets even when the number of shares is unchanged. Net flows, by contrast, directly measure the difference between subscriptions and redemptions, providing a clearer view of where allocation capital is moving. Over these two trading days, demand to hold both bitcoin and ether through U.S.-listed funds weakened. As coin prices fell, continued withdrawals from these funds diminished one source of buying support.
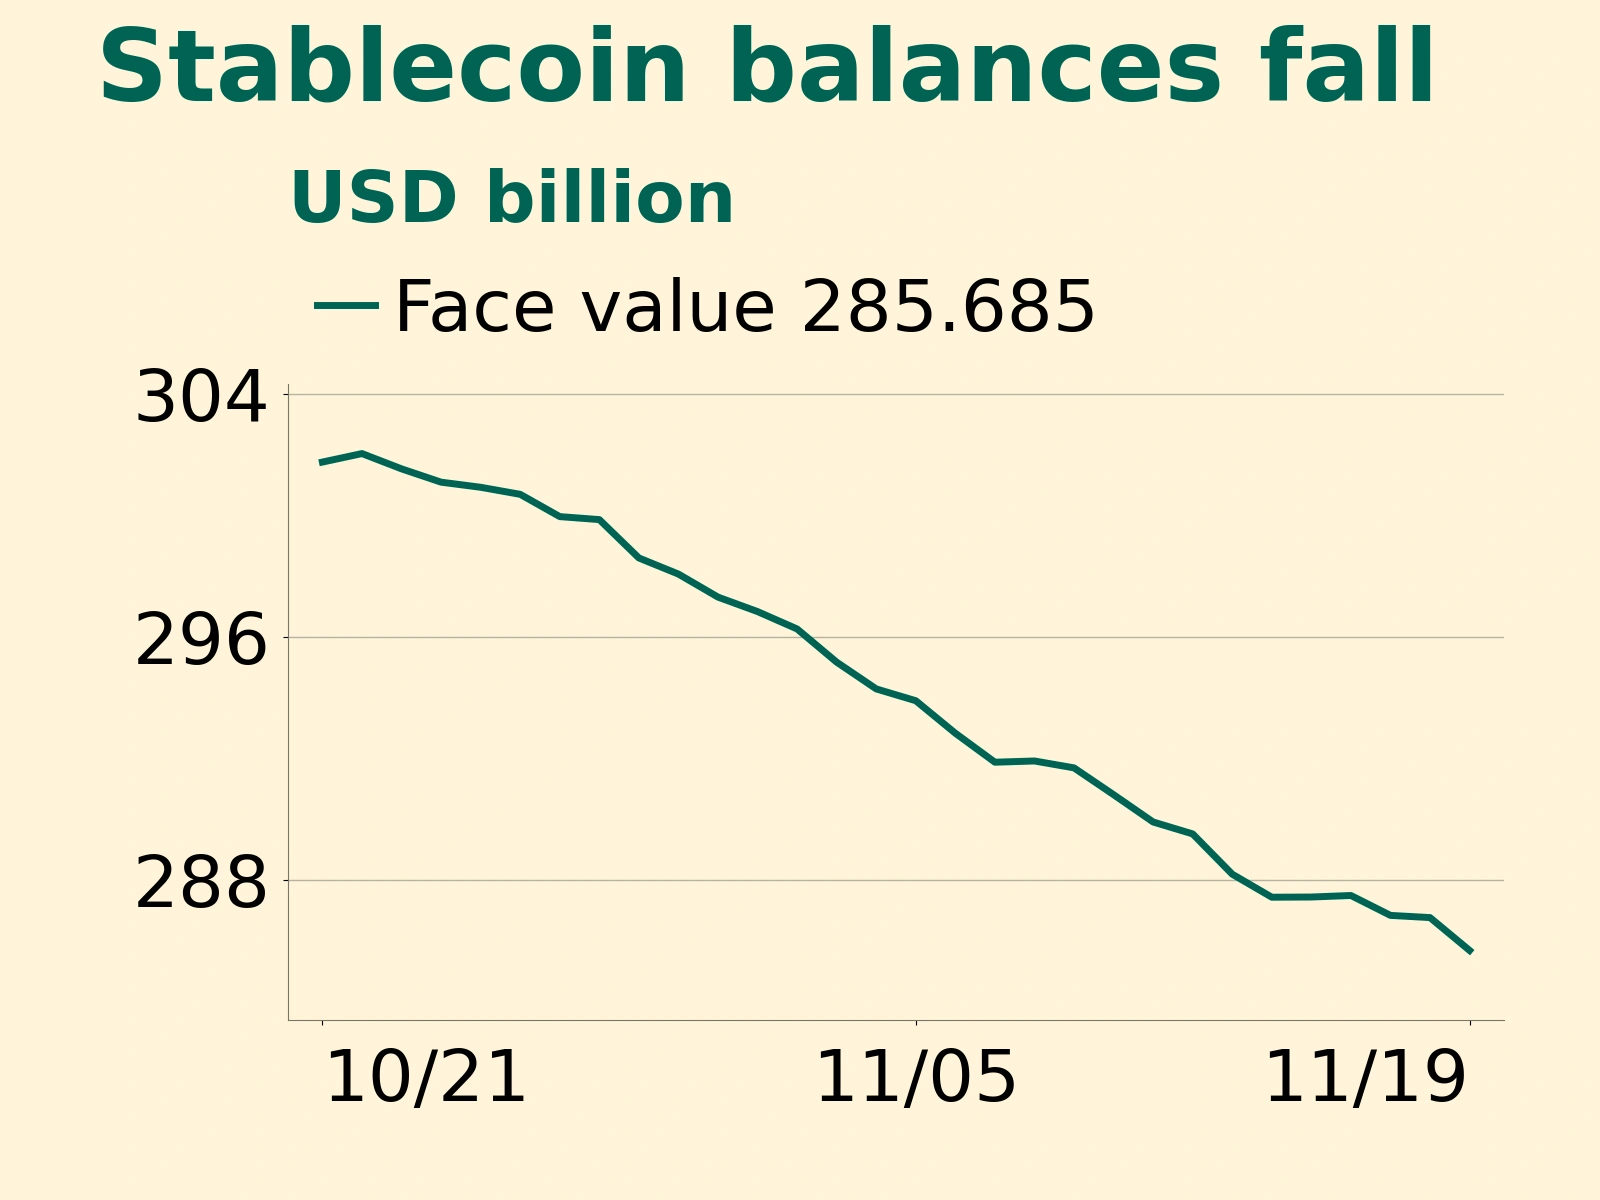
On-chain dollar balances moved in the same direction. DefiLlama data show that the circulating face value of dollar-pegged stablecoins was approximately $285.685 billion at 00:00 UTC on November 19, down $1.080 billion from the same time a day earlier and $3.833 billion from a week earlier. Stablecoins serve not only to buy cryptoassets but also for payments, lending and settlement. A decline in circulating face value means a smaller total pool of these dollar balances; the prices at which the remaining funds are willing to buy bitcoin still depend on their holders' intended uses. ETF flows and stablecoin balances measure different things, and adding them together would overstate the selling pressure that can actually be identified.
Coin-denominated open interest rises while its value falls
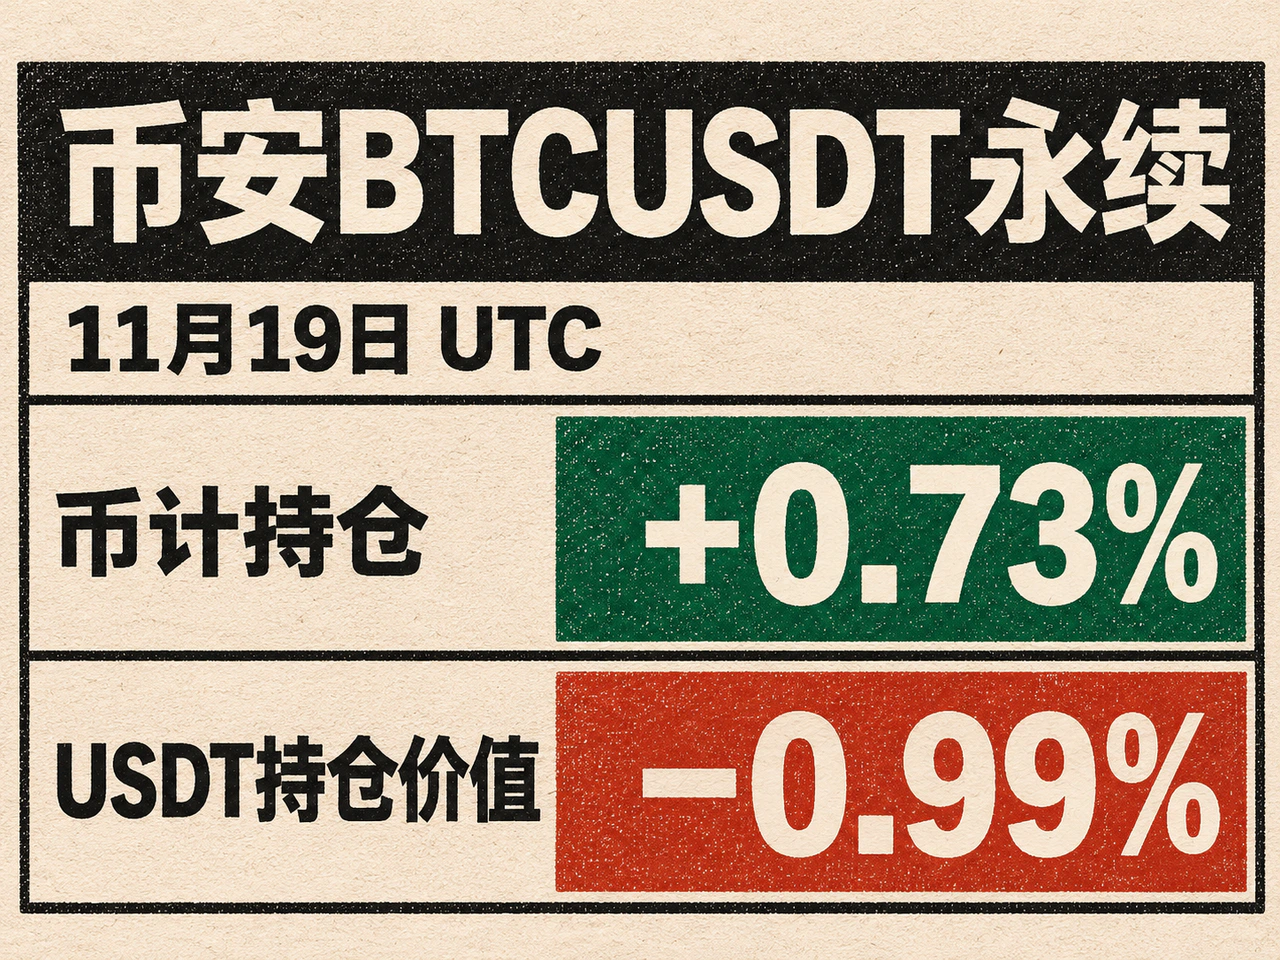
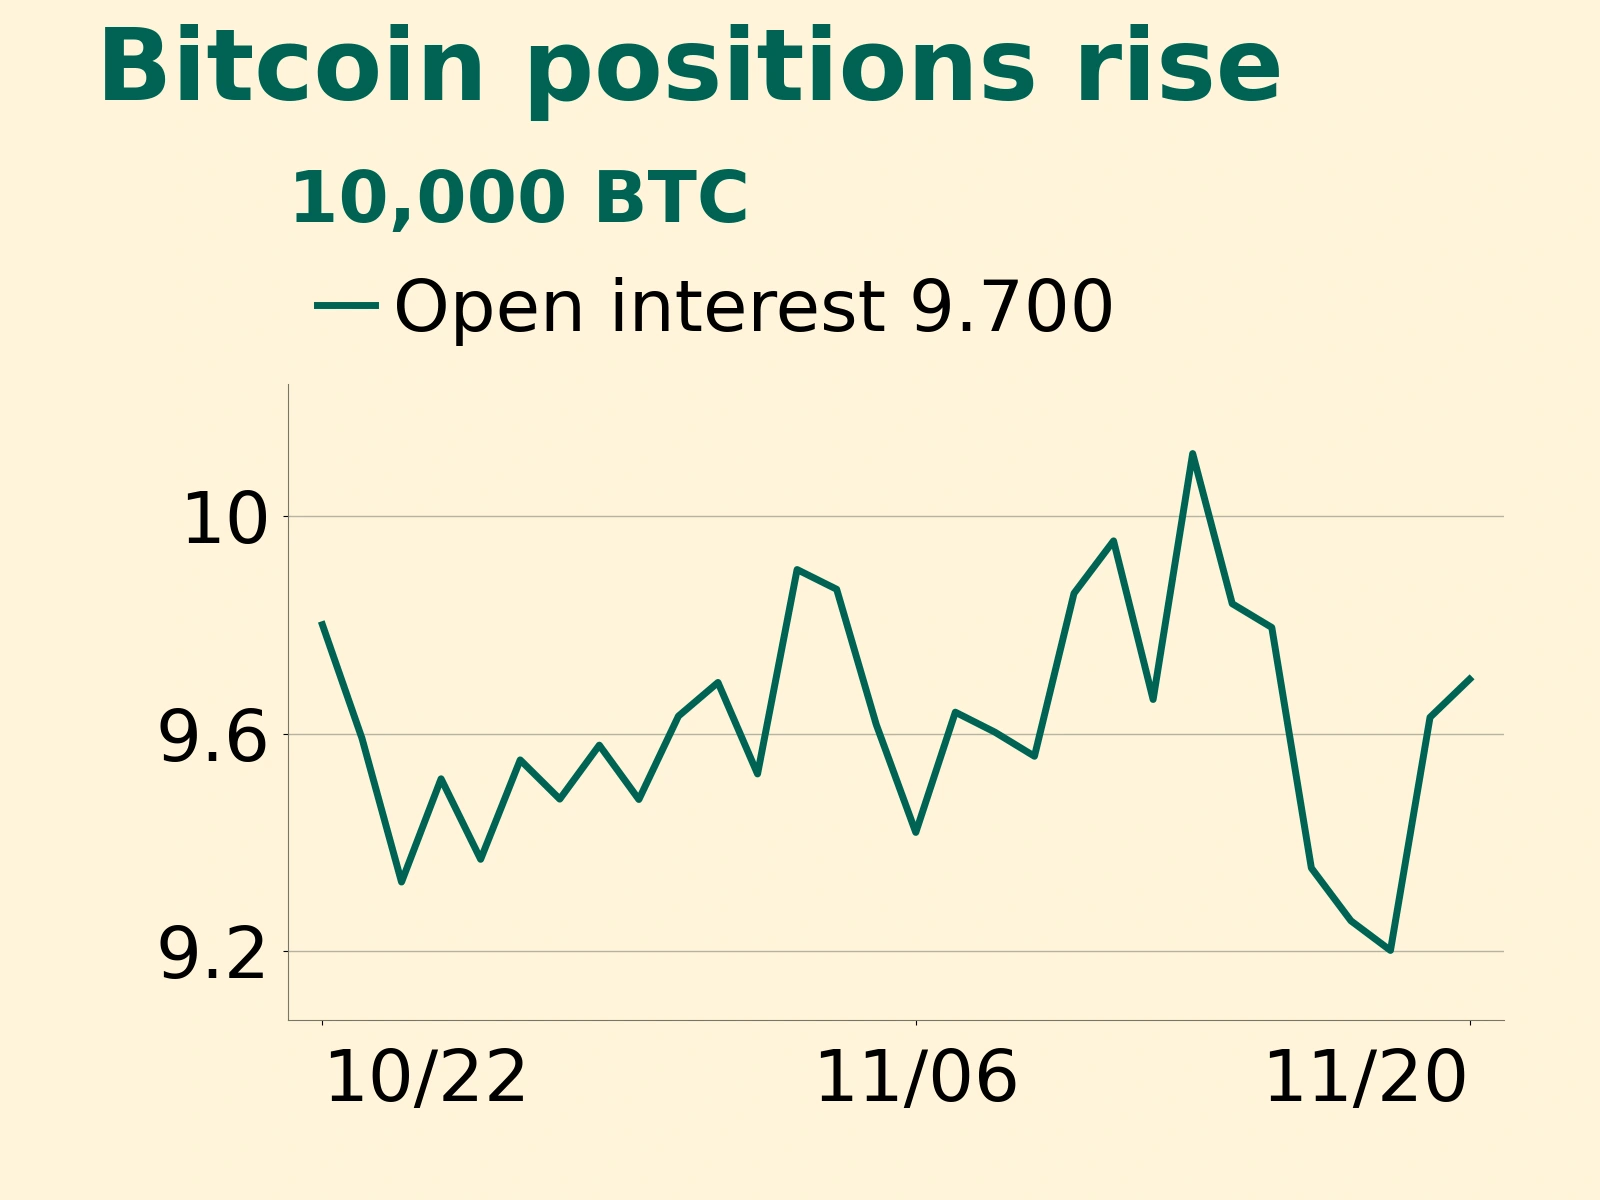
Using 08:00 Beijing time on November 20 as the closing boundary, open interest in Binance's BTCUSDT perpetual contract rose from 96,300 BTC to 97,000 BTC, an increase of 0.73%. Over the same period, its USDT value fell from 6.070 billion to 6.010 billion, a decline of 0.99%. The ETHUSDT perpetual contract showed the same divergence: open interest increased from 2.4457 million ETH to 2.4592 million ETH, up 0.55%, while its USDT value fell by 0.57%. Lower coin prices reduced the converted value of each contract. Looking only at the quoted monetary value can therefore lead to a price decline being mistaken for traders actively closing positions.
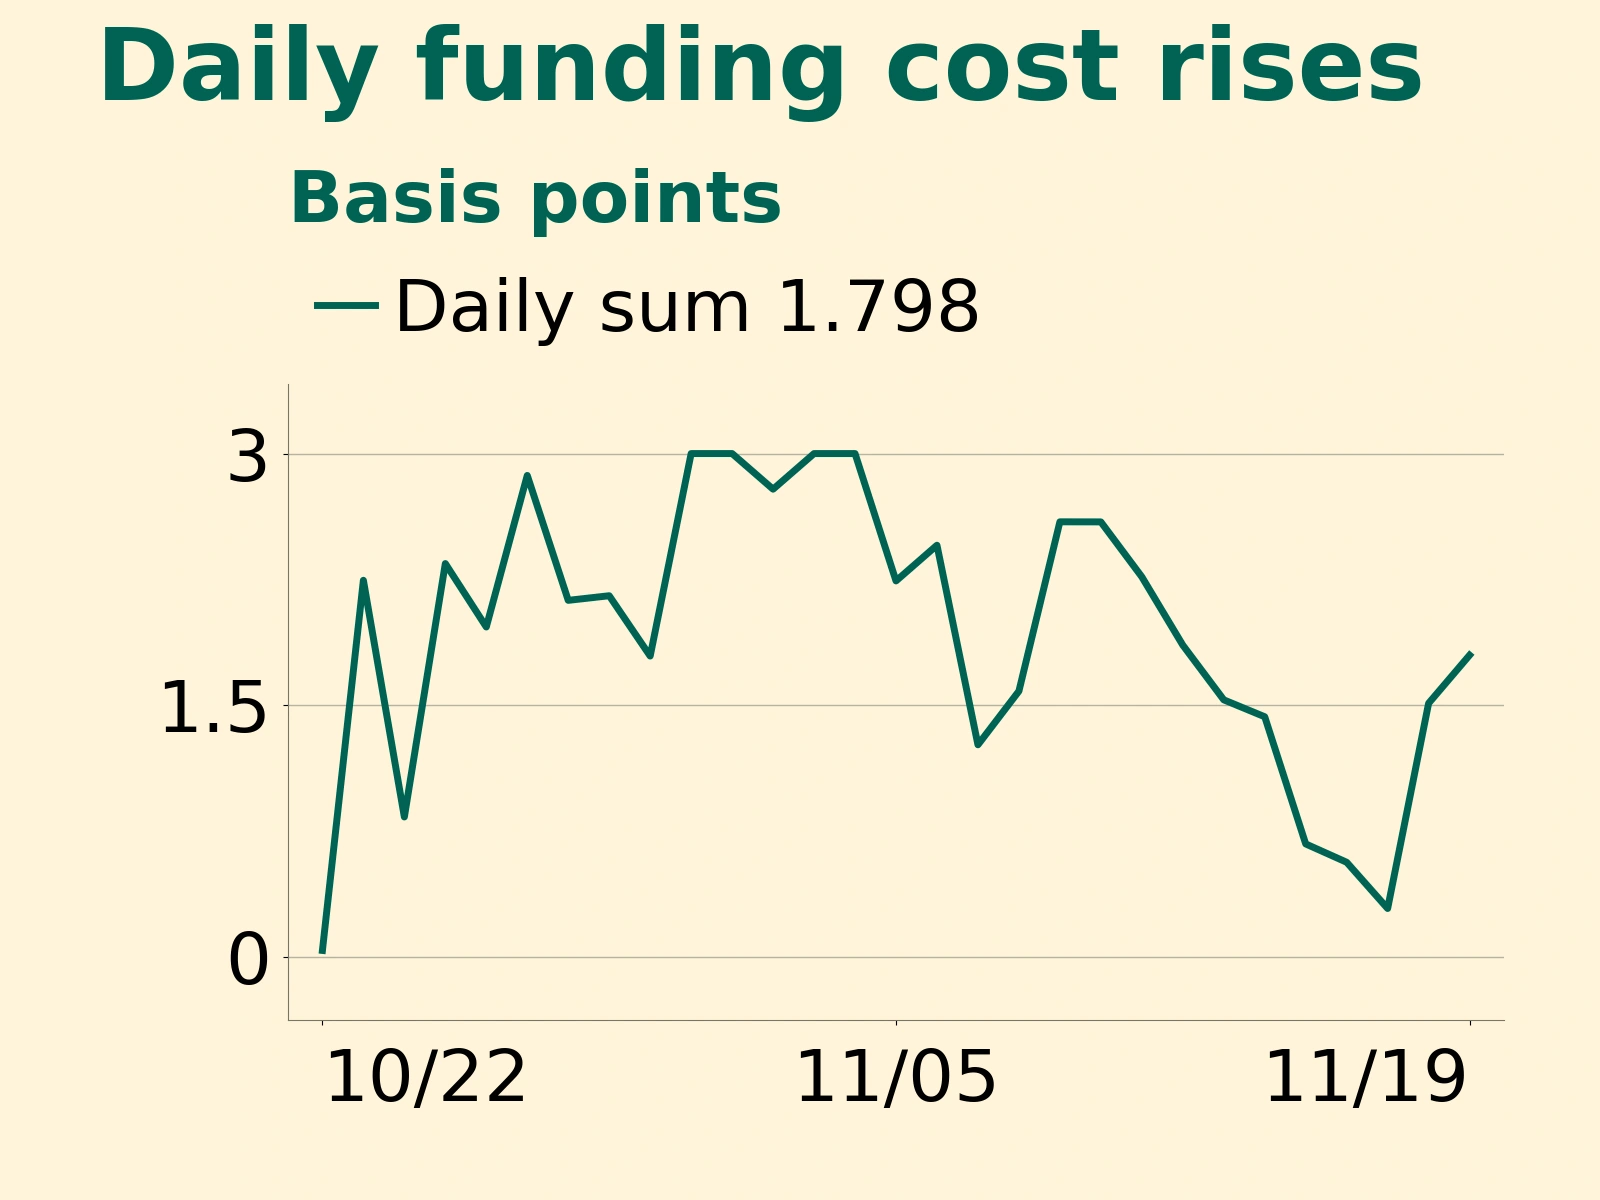
Every open contract has a matching long and short side, so understanding new positions also requires looking at which side is paying to hold them. Funding rates on Binance's BTCUSDT perpetual contract were positive at all three settlements on November 19, at 00:00, 08:00 and 16:00 UTC: approximately 0.00941%, 0.00678% and 0.00179%, respectively. Longs paid shorts throughout the day. However, the final rate was only about one-fifth of the first. Assuming the same notional exposure was maintained at every settlement, the total cost to longs for the day was approximately 0.01798%, still slightly above the previous day's 0.01511%. The cumulative daily cost and willingness to pay for financing late in the day tell different stories; rising open interest alone does not establish that longs were chasing prices into the close.
Downside protection was also part of this round of position adjustment. Citing Bloomberg and CoinDesk, Blockhead reported on November 19 that open interest in Deribit bitcoin put options with a $60,000 strike totaled approximately $900 million in notional value across all expiries. For coin holders, buying puts allows them to retain their spot holdings while limiting losses from a price decline at expiry. Concentrated open interest at this strike affects the profit and loss of many contracts. The notional amount alone, however, reveals neither how dealers are hedging nor where the coin price may stop falling. With fund redemptions occurring alongside an increase in perpetual contracts outstanding, the more informative signals from here are whether spot subscriptions and redemptions stabilize first, and how much longs are still willing to pay to maintain positions at lower prices.
Click “Read the original” for the full details.