On November 19, 2026, Bitcoin briefly broke above 64,000 USDT but closed below 62,000 USDT. On Binance spot UTC daily candles quoted in USDT, Bitcoin closed November 19 (8:00 a.m. Beijing time on November 20) at 61,986.73 USDT, down 1.71% from the previous close; Ether closed at 1,757.32 USDT, down 1.12%. Seven of the eight highly liquid spot pairs in the fixed sample fell, with Bitcoin posting the largest decline. U.S. equities also surrendered earlier gains. Anthropic drew strong demand on its trading debut, but other risk assets did not benefit broadly.
Bitcoin leads declines, with an intraday range exceeding 2,600 USDT

Binance 15-minute candles show that Bitcoin reached its daily high of 64,080.80 USDT before the U.S. stock market opened. After regular U.S. equity trading ended, it fell to 61,428.26 USDT during the 15-minute interval beginning at 21:30 UTC. Although it subsequently rebounded, the close remained only about 558 USDT above the daily low.
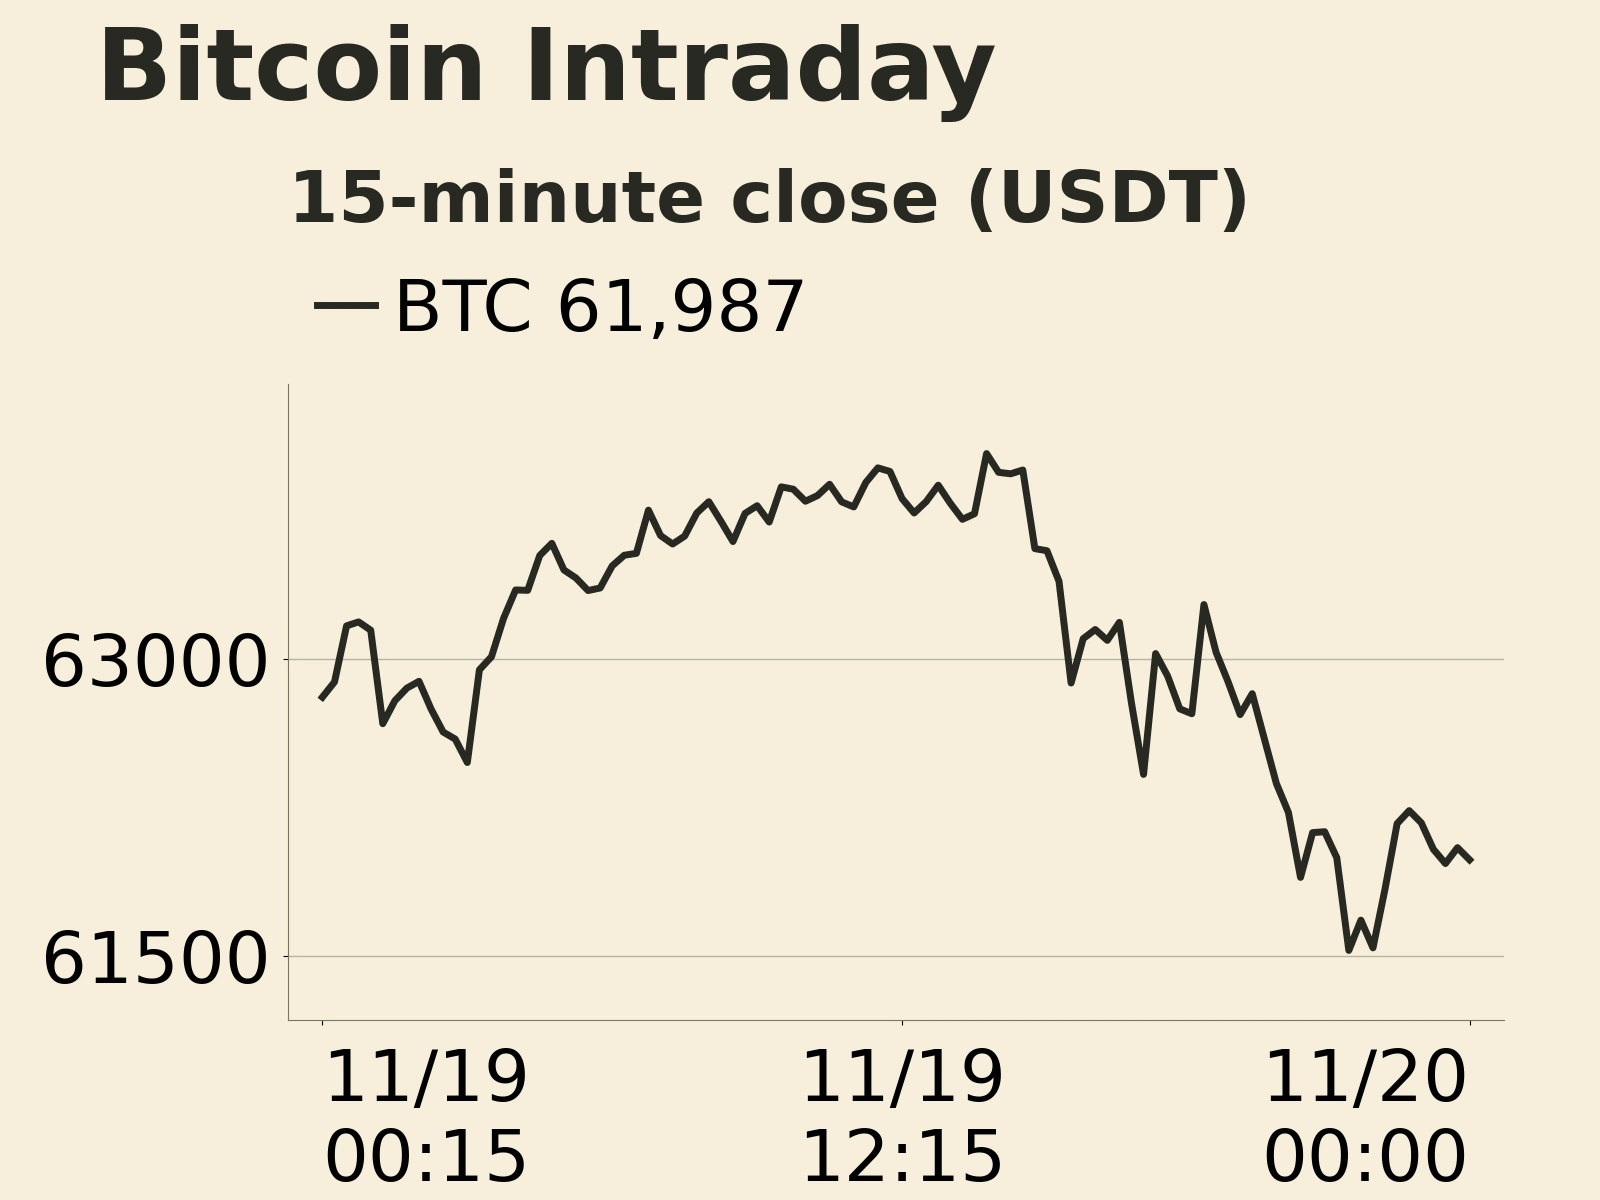
The daily high was about 1,013 USDT above the previous close. By the close, all of that gain had disappeared, leaving the price about 1,081 USDT below the previous close. For an investor holding throughout the day, the early breakout did not translate into a gain at the close.
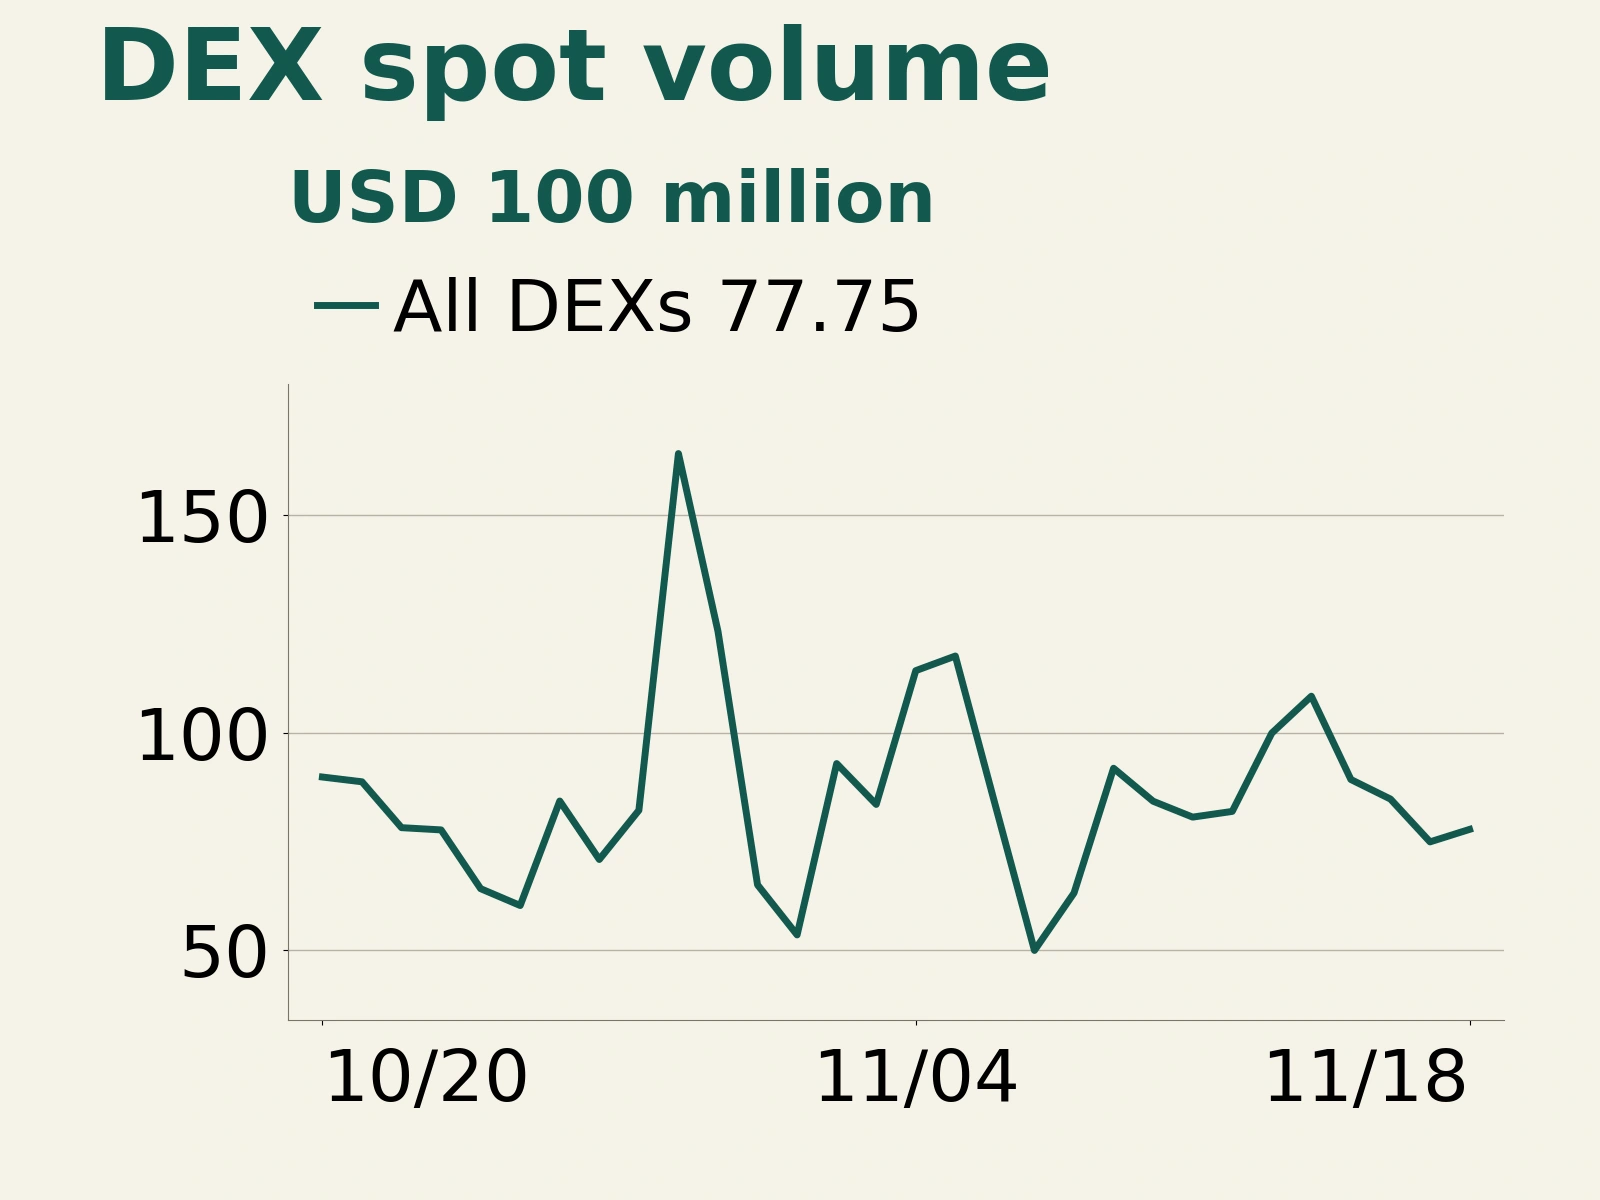
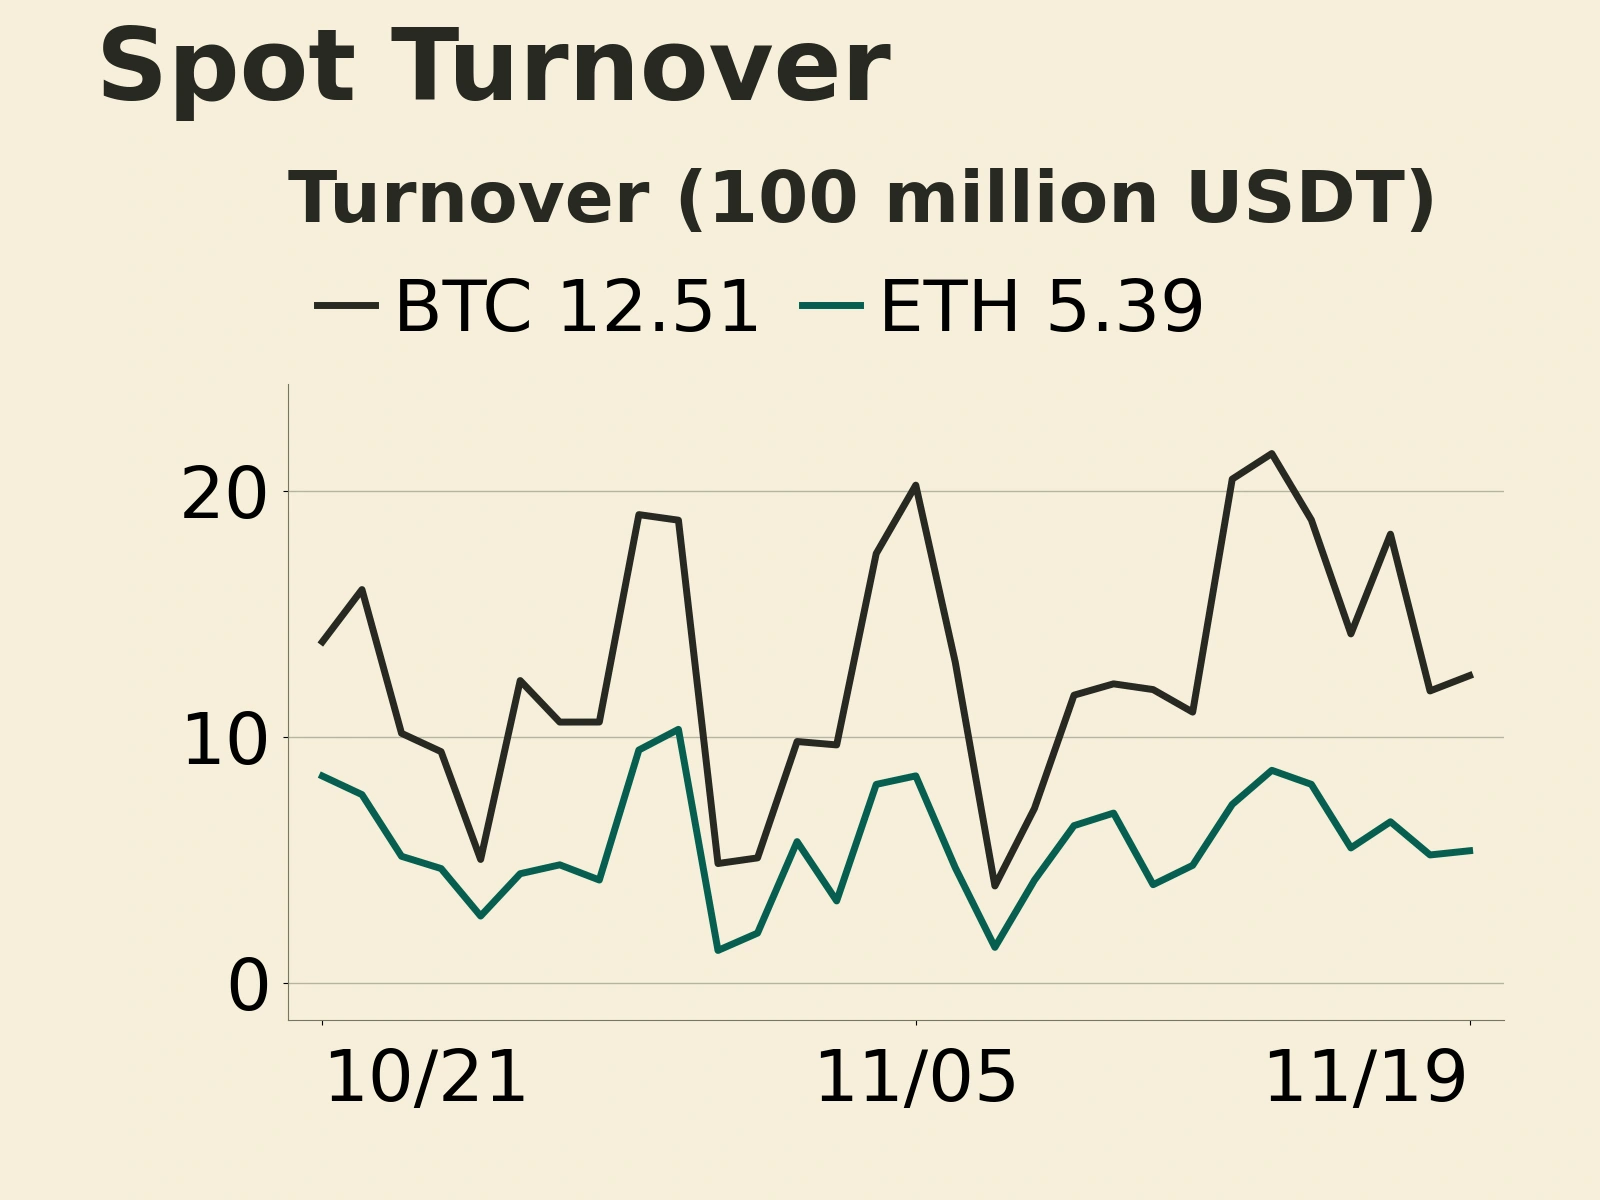
Turnover in the Bitcoin and Ether spot pairs was 1.251 billion and 539 million USDT, respectively, up approximately 5.2% and 3.3% from the previous day. Turnover measures the total value of completed trades between buyers and sellers. A modest increase in turnover as prices declined indicates that both the rebound and the retreat involved actual trading; turnover alone, however, cannot establish the scale of net redemptions or forced liquidations.
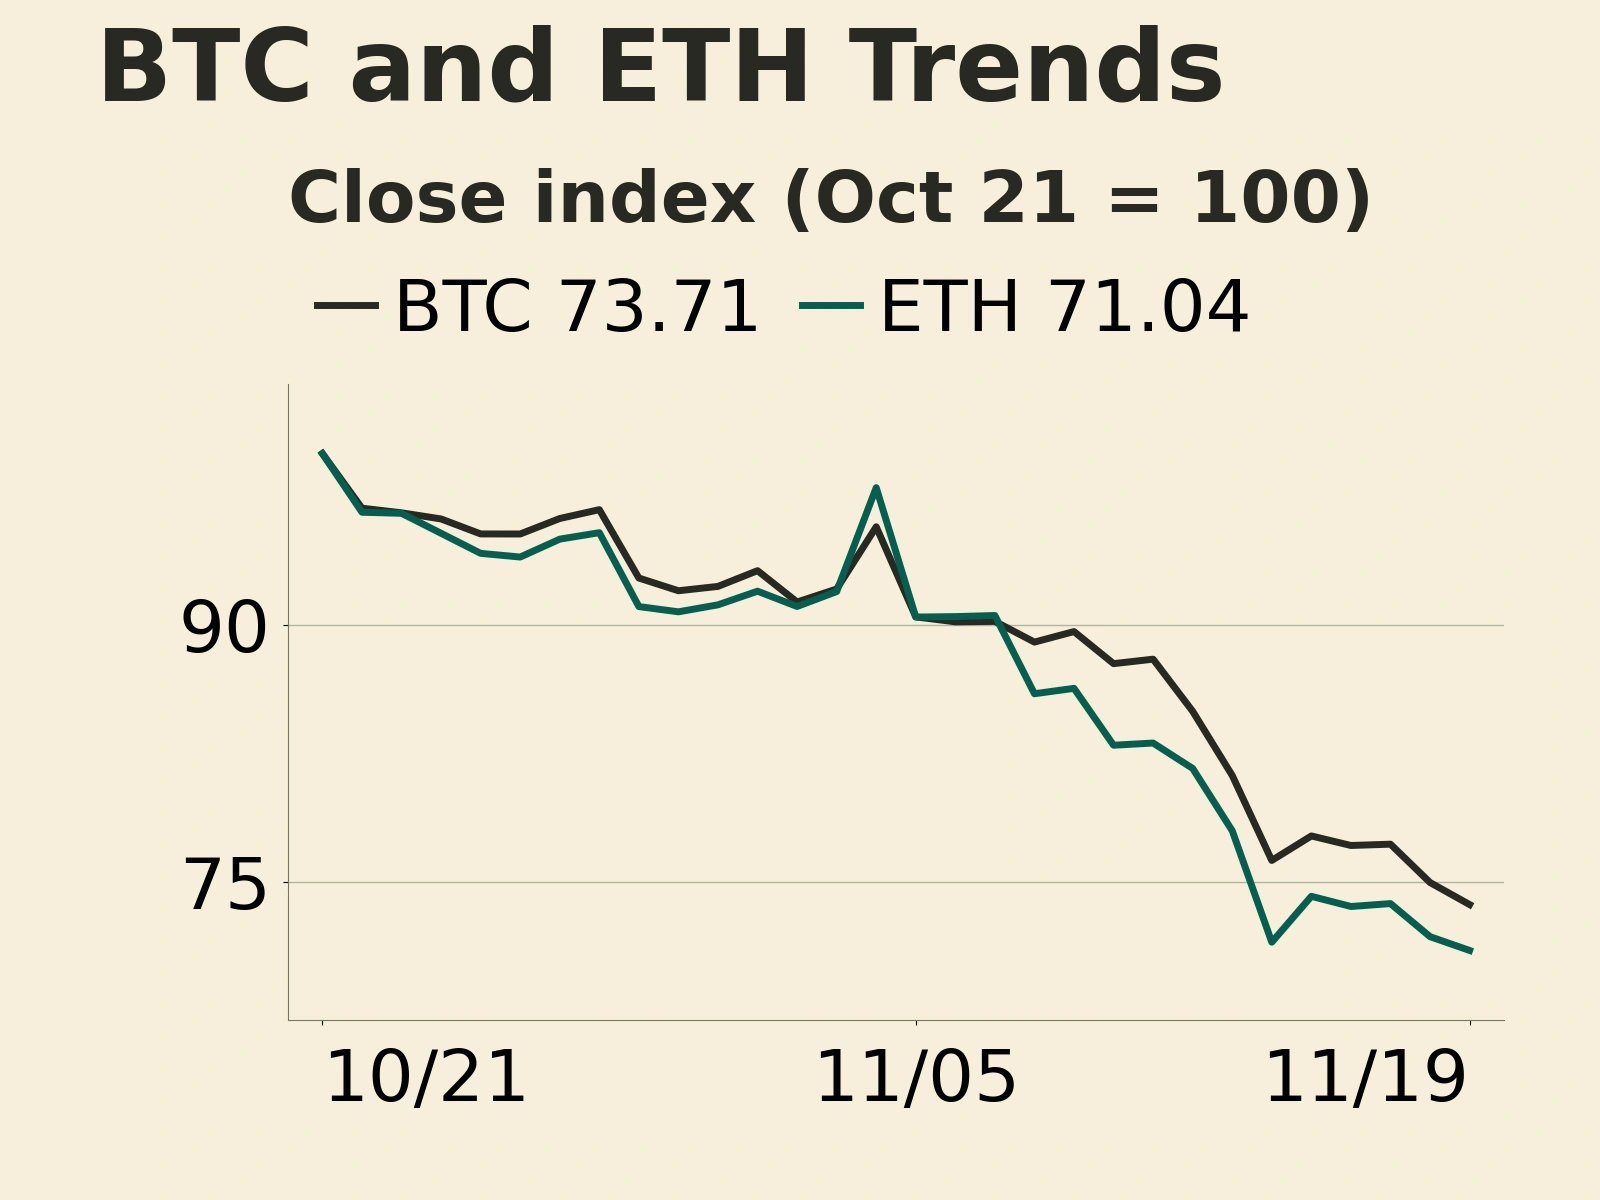
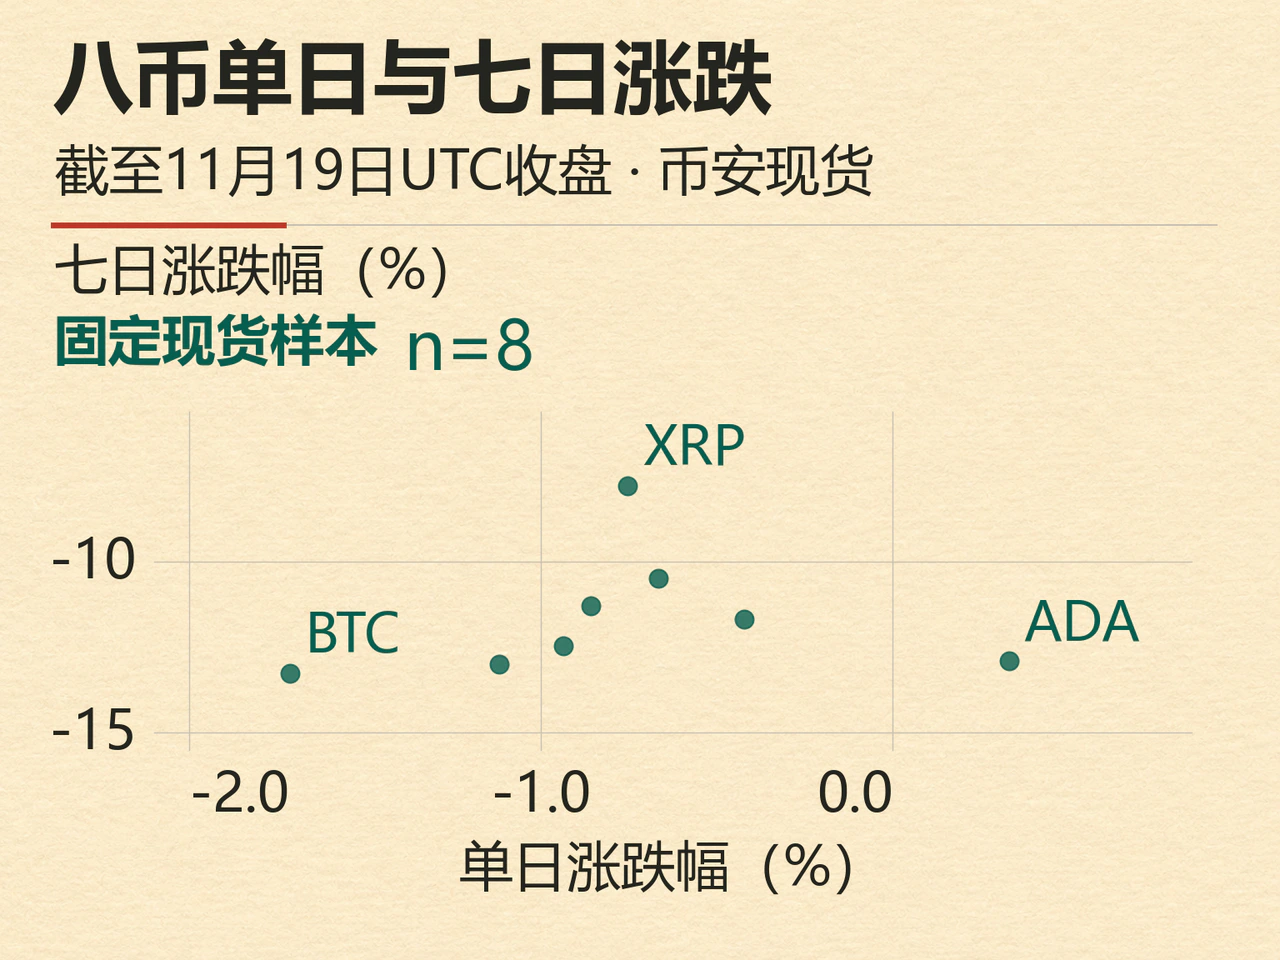
Among the eight assets in the sample—Bitcoin, Ether, BNB, SOL, XRP, DOGE, ADA and LINK—only ADA rose, gaining 0.33%. SOL and XRP fell 0.67% and 0.75%, respectively, both outperforming Bitcoin. Although Ether fell in USDT terms, converting the two pairs at their closing prices shows that it gained approximately 0.61% against Bitcoin.
Over seven complete trading days, all eight assets recorded cumulative declines, with ADA down about 12.9% and Ether down about 13.0%. ADA’s resilience for a single day is therefore insufficient evidence of a sustained rotation into other tokens.
Anthropic debut draws demand, but buying fails to spread to crypto

Anthropic’s listing offered a window into risk appetite that day. Its shares attracted strong demand on their first trading day, yet the Nasdaq Composite reversed an intraday gain to finish lower. Bitcoin peaked before U.S. equities opened and bottomed after they closed. That sequence shows that trading in Anthropic’s debut cannot explain Bitcoin’s entire intraday move, while enthusiasm for the new listing also failed to help Bitcoin retain its early gains. The price paths in the two markets alone cannot establish whether subscribers to the new shares and sellers of Bitcoin were the same investors.
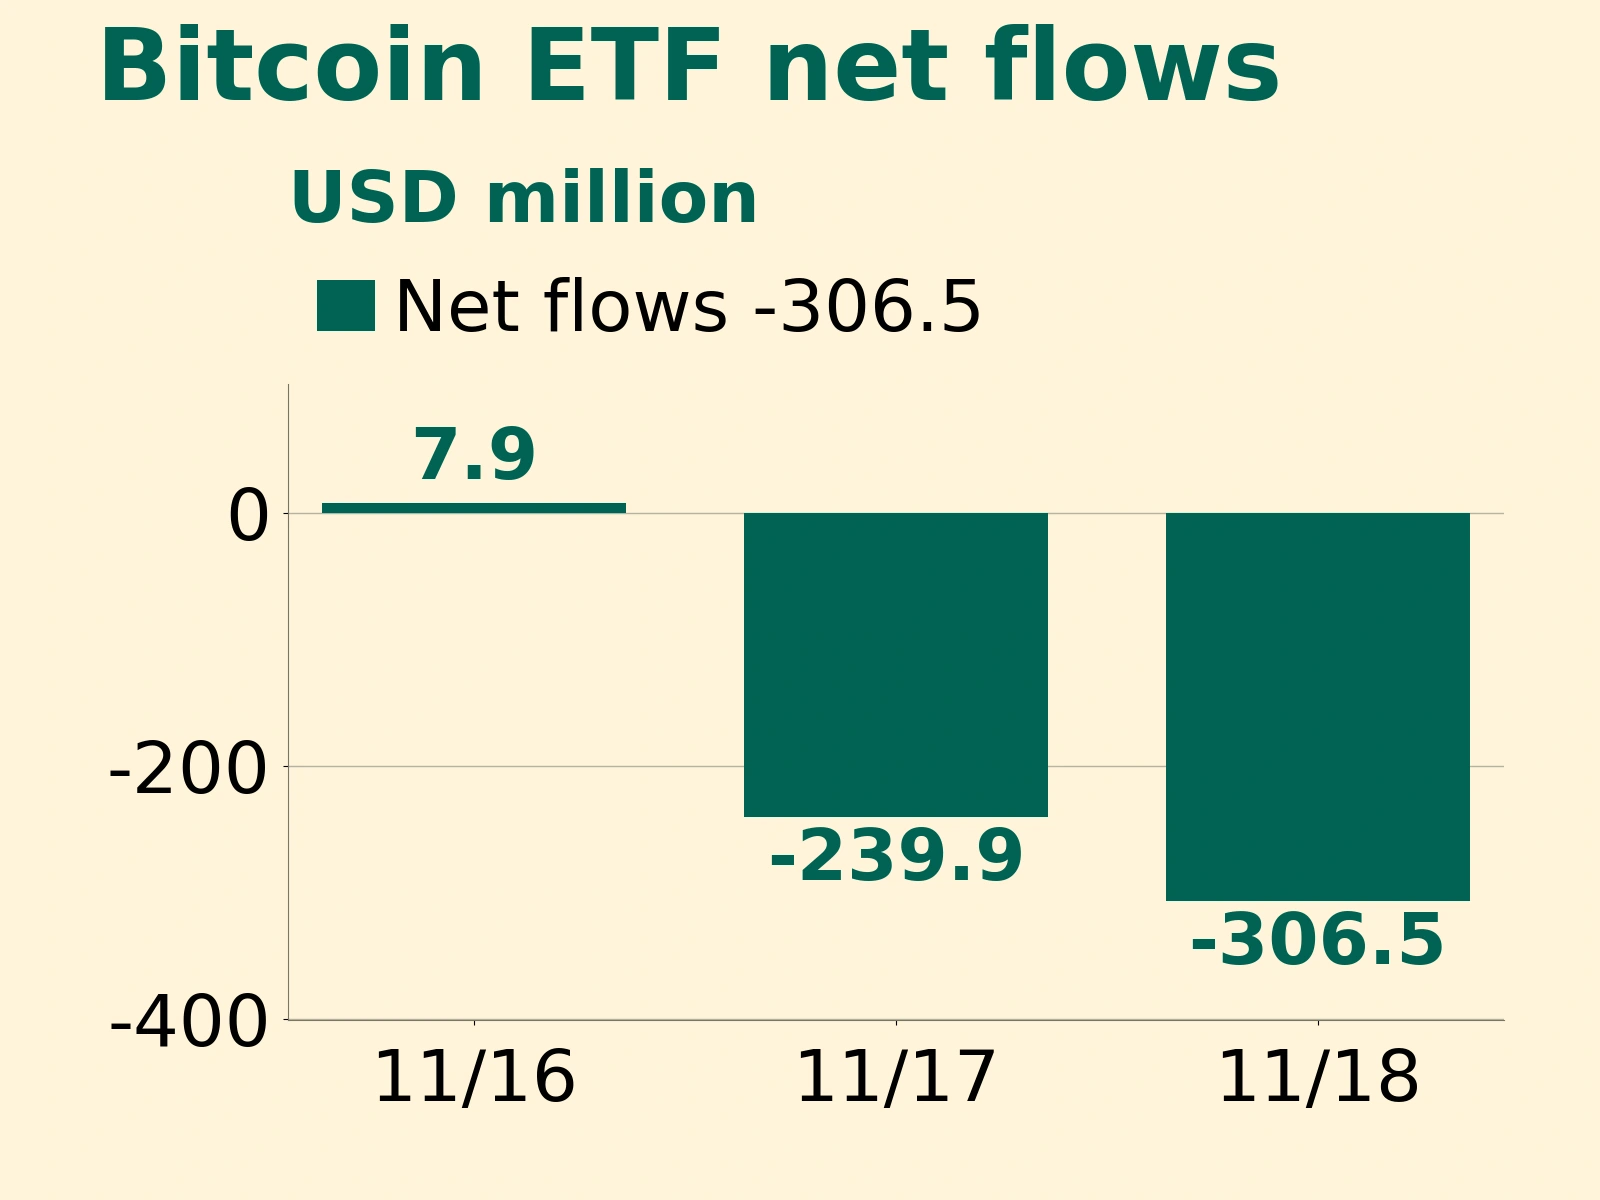
Fund flows offer another clue. The Motley Fool, citing CoinDesk figures that day, reported net outflows of more than $300 million from U.S. spot Bitcoin ETFs on November 18. Those outflows occurred during the preceding U.S. trading session and describe the funding backdrop before the November 19 rebound: as Thursday’s rally began, the exchange-traded fund channel had just experienced a round of withdrawals, making the durability of spot buying particularly relevant. The outflow figure cannot be translated directly into sell orders at any specific moment on November 19.
Meanwhile, the minutes released by the Federal Reserve the previous day kept the possibility of further rate increases in focus. The appeal of cash and short-term interest-bearing assets was also being reflected in risk-asset pricing.
Two comparable indicators can help distinguish broad market pressure from changes in demand specific to Bitcoin. If Bitcoin repeatedly closes near the bottom of its daily range even after equities stabilize, while U.S. spot Bitcoin ETFs continue to record net outflows, the fund-channel explanation would carry more weight. If ETF creations and redemptions stabilize but crypto prices continue to reverse alongside the broader market during U.S. trading hours, cross-market risk pricing would warrant closer attention.
For the completed November 19 session, declines in seven of the eight assets show that pressure affected most of the sample. Bitcoin fell the most, indicating that large market capitalization did not provide a defensive advantage that day.
Click “Read the original” for the full details.