On the US–Iran ceasefire's second trading day, oil's pricing center fell sharply. WTI lost 7.5% and Brent 8.7% on July 27, with declines continuing in July 28 Asian trading. Markets rapidly shifted to returning crude flows and inventory builds after Hormuz reopening, clearing accumulated geopolitical premiums.
Prices: Geopolitical premiums unwind toward the pre-breakout range
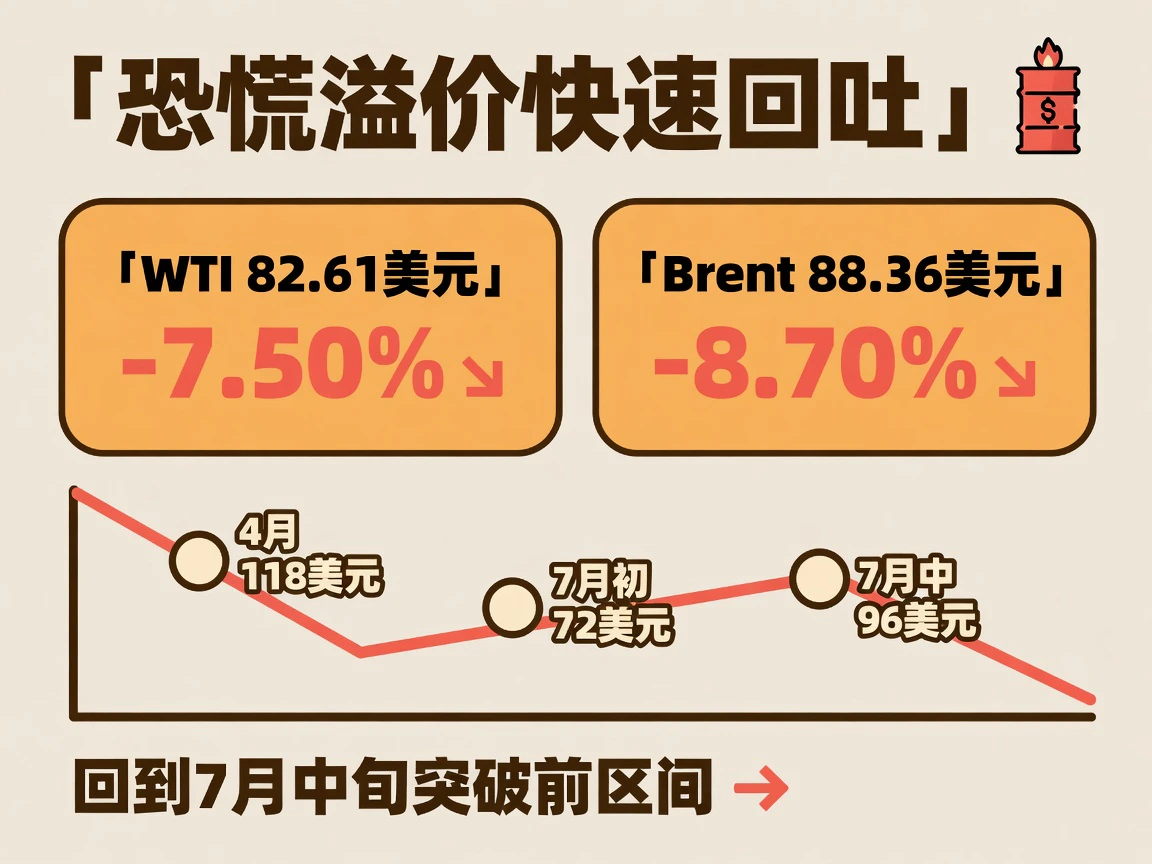
July 27 WTI settled at $82.61/barrel, down 7.50% from the previous session. By 17:38 Beijing time July 28 it was around $80.79 intraday.
Brent settled at $88.36, down 8.70%, then weakened to $85.86 on July 28. Third-party data showed another roughly 2%–3% intraday decline, a third consecutive pressured session.
The plunge returned oil to the range before the mid-July breakout. Brent had exceeded $118 amid April fighting, fallen near $72 in early July on reopening hopes, then approached $96 as war resumed midmonth. The ceasefire erased those renewed escalation gains.
Curve: Backwardation narrows, without confirming broad prompt surplus
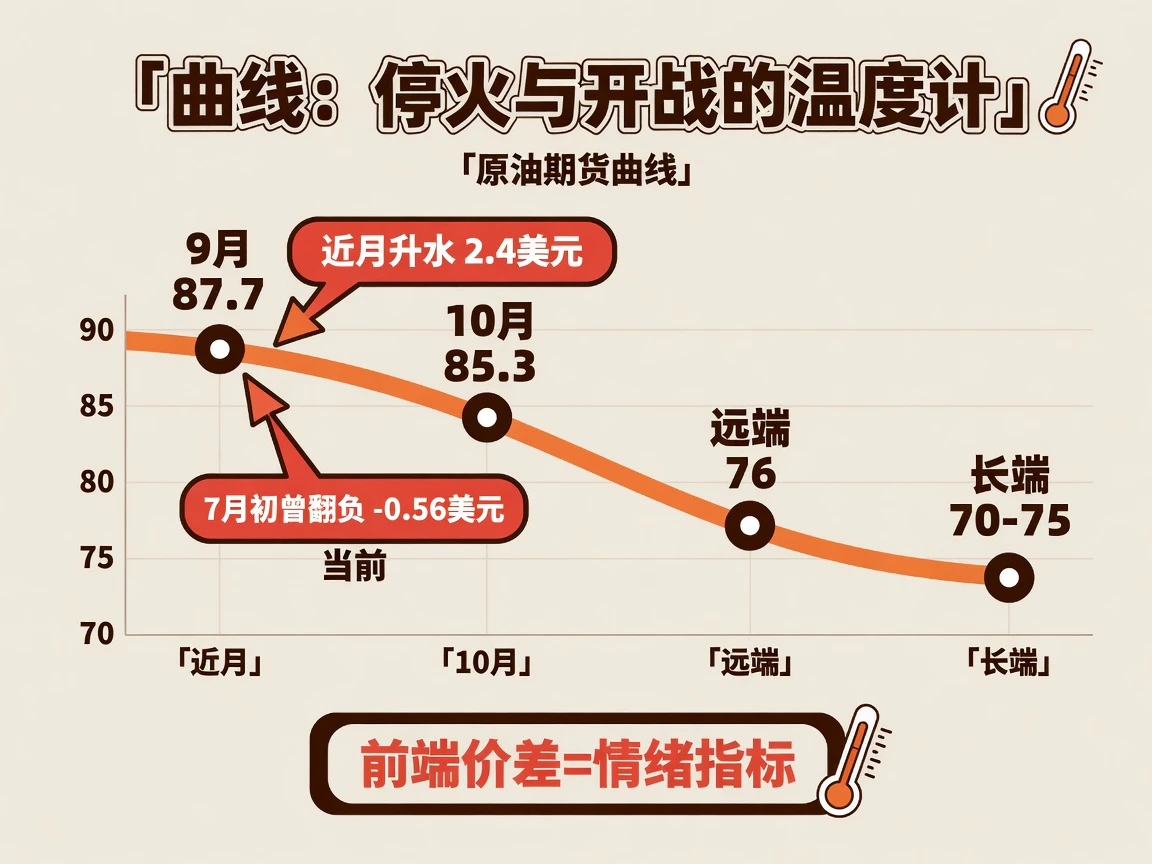
The Brent curve remained backwardated. An oilprice.com snapshot showed September at $87.7 and October $85.3, a nearby premium near $2.4, with deferred prices gradually falling toward $76 by mid-2027 and a long-term center of $70–75.
Front spreads tracked ceasefire expectations closely. Early-July reopening and surplus trades briefly produced contango: Reuters July 3 data showed the six-month spread at -$0.56. Renewed fighting steepened the curve again. Current prompt prices fell sharply, but premiums did not collapse, indicating no material physical surplus producing indiscriminate selling.
Supply: Gulf producers shift from price support to market share
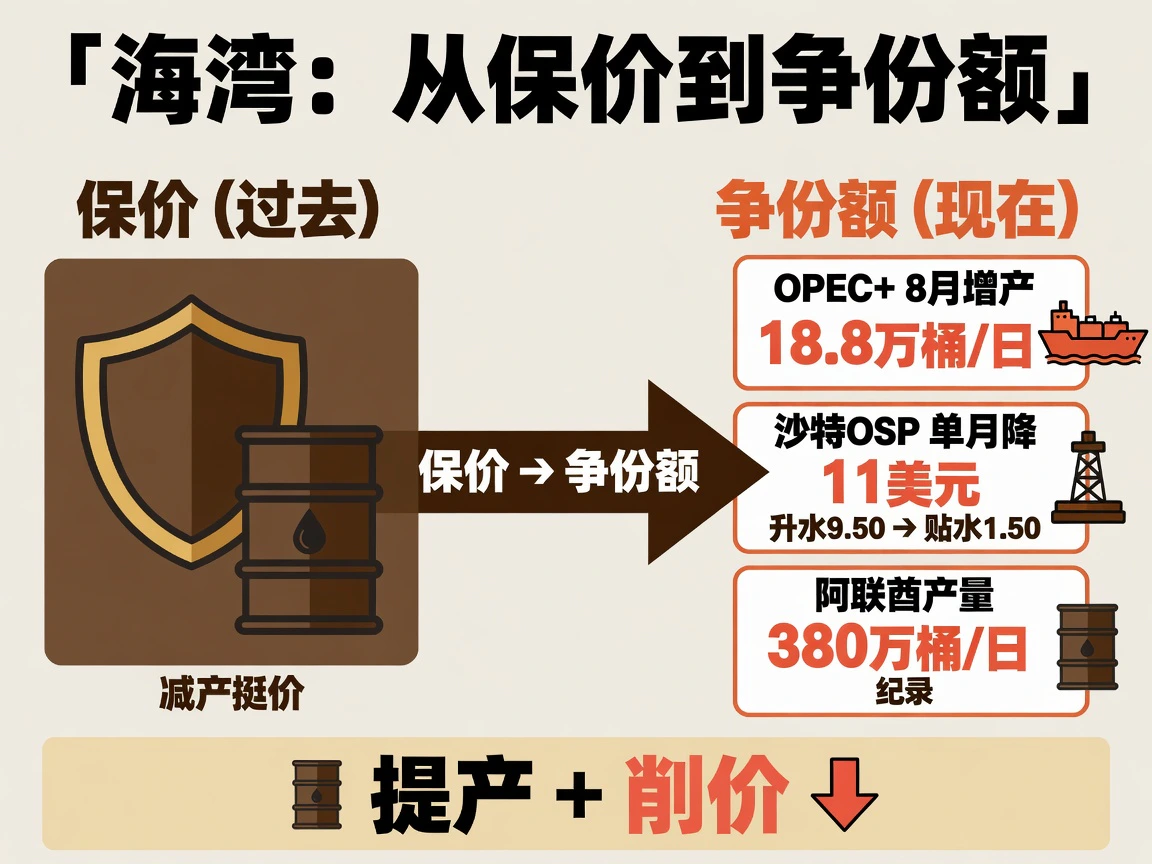
Supply developments also leaned bearish. OPEC+'s July 5 online meeting confirmed Saudi Arabia, Russia, Iraq, Kuwait, Kazakhstan, Algeria and Oman would raise August output targets by another 188,000 barrels/day.
Saudi pricing was more significant than quotas. Aramco cut August Arab Light OSP to Asia to a $1.50/barrel discount to Oman/Dubai, from July's $9.50 premium—an $11 monthly cut, the largest in Reuters records since 2003. UAE June output also exceeded a record 3.8 million barrels/day.
Higher quotas and sharply lower official prices showed Gulf producers shifting from passive cuts supporting prices to active competition for share.
Inventories and macro: Builds emerge; the sell-off reflects premium removal rather than tightening
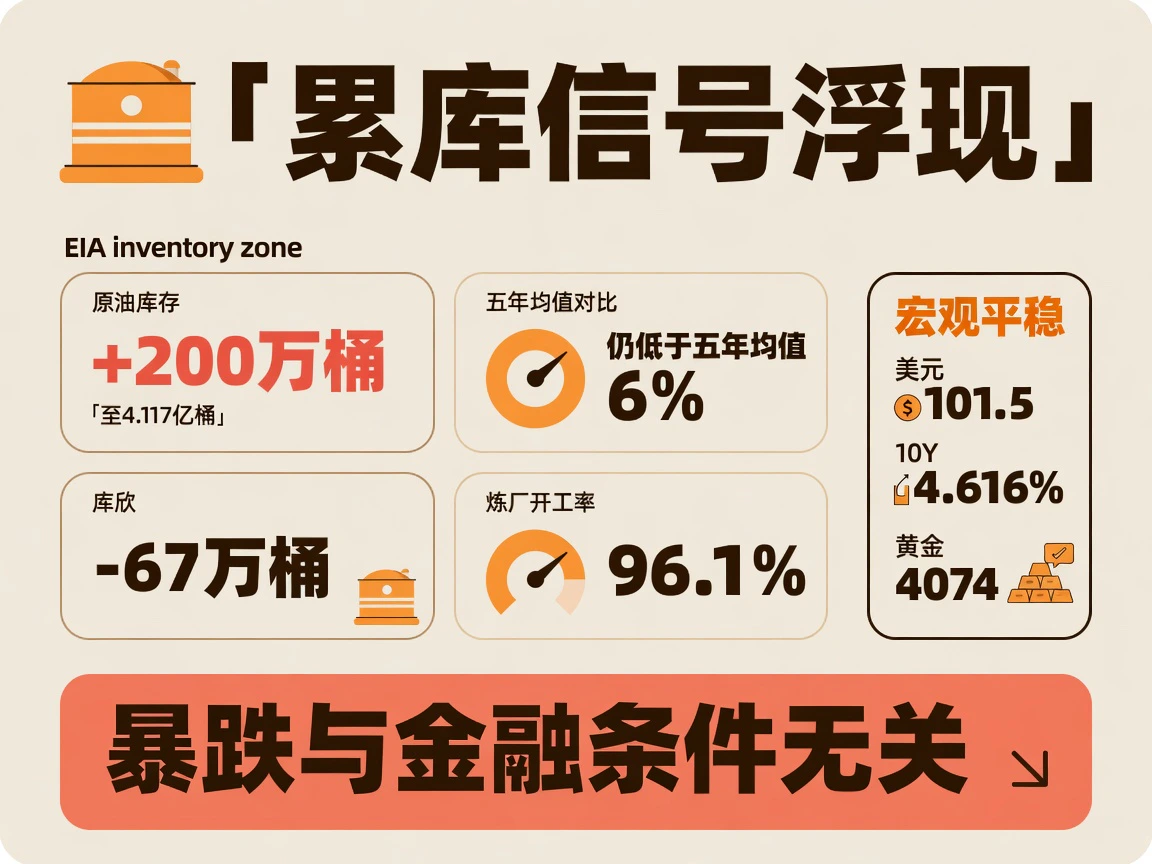
EIA data for the week ended July 17 showed commercial crude unexpectedly rising 2 million barrels to 411.7 million, against consensus for a 1.25 million–2 million draw. Stocks remained around 6% below the five-year average. Cushing fell about 670,000, gasoline rose 800,000 and distillates 1.4 million; refinery utilization reached 96.1%. SPR released about 5.1 million to 311 million. The July 29 report would be the first key test of oil on water converting to onshore stocks.
The IEA July report likewise showed June Gulf crude exports rising 6.5 million barrels/day to 16.1 million, still below the prewar norm around 24 million. Oil in transit lifted global stocks for the first time after months of declines, while product cracks remained high because of rigid supply.
The sell-off was independent of macro finance. The dollar index fluctuated slightly near 101.5, the 10-year yield fell only 2.5 bp to 4.616% and S&P 500 was almost flat at +0.02%. Oil's near-10% fall contrasted with calm FX and rates, a classic geopolitical supply-premium collapse. Gold edged up 0.17% to $4,074.5/ounce rather than following oil, confirming focus on Gulf reopening without a broad retreat from systemic havens.
Shipping bottlenecks: High war insurance and freight support landed costs
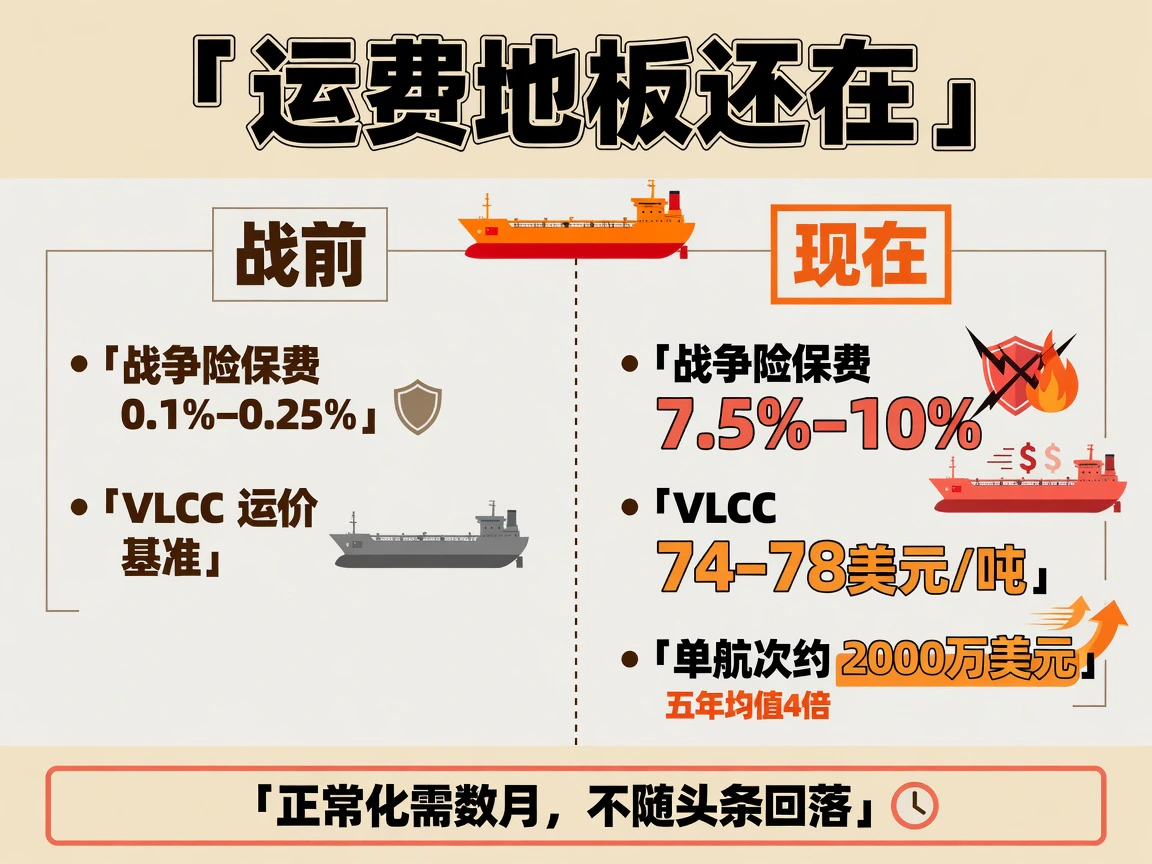
Market prices had moved ahead, but actual passage was far from normal. After the US suspended airstrikes July 24 evening, Iranian and Omani representatives pursued reopening talks and several quiet days followed. Ceasefire did not equal passage: formal safety agreements, escorts and reinsurance were not implemented.
Marsh and S&P Global July 22 assessments put war insurance at 7.5%–10% of hull value versus prewar 0.1%–0.25%. Middle East–China VLCC freight remained $74–78/tonne, around $20 million–$21 million per voyage, four times the five-year average. Earlier weekly strait traffic had fallen around 66% week on week amid attack threats.
Even a sustained ceasefire normally requires months without claims before insurance and freight normalize; diplomatic headlines cannot lower them instantly. Extreme delivery costs continue supporting landed crude floors in the short term.
Trading logic: Exit blockade panic, retain protection against failed talks

Backwardation alongside plunging absolute prices shows a rapid unwinding of blockade-supply panic without a complete shift to a physical-surplus bear market. Fully confirmed reopening should flatten nearby spreads or restore early-July-style contango.
The curve assumes a likely lasting ceasefire and gradual Gulf supply return, with long prices around $70–75, but failed talks or renewed restrictions still support nearby premiums above $2. The bullish premium has narrowed from fear of large-scale war to fear of a failed peace agreement. Whether September/October narrows below $1 and forthcoming EIA data confirm consecutive builds will distinguish temporary sentiment release from a trend reversal.


