Oil reversed sharply on July 29. A day earlier, markets had welcomed hopes of a pause in U.S.–Iran fighting, with WTI briefly below $78 and Brent below $84. Just 24 hours later, joint U.S.–Saudi airstrikes hit Iran-aligned forces in Iraq, followed by Iranian ballistic-missile retaliation against a U.S. base in Jordan. The renewed escalation sent oil sharply higher, erasing the previous day's entire decline.
At the July 29 close, nearby WTI settled at $84.46 a barrel, up $5.20, or 6.6%; nearby Brent settled at $90.74, up $6.65, or 7.9%. By the morning of July 30 Beijing time, electronic WTI and Brent trading fluctuated near $84.03 and $89.53. In one day, the market switched rapidly from positioning for a ceasefire to pricing a conflict premium.
Severe disruption at two straits as fighting reaches Iranian territory
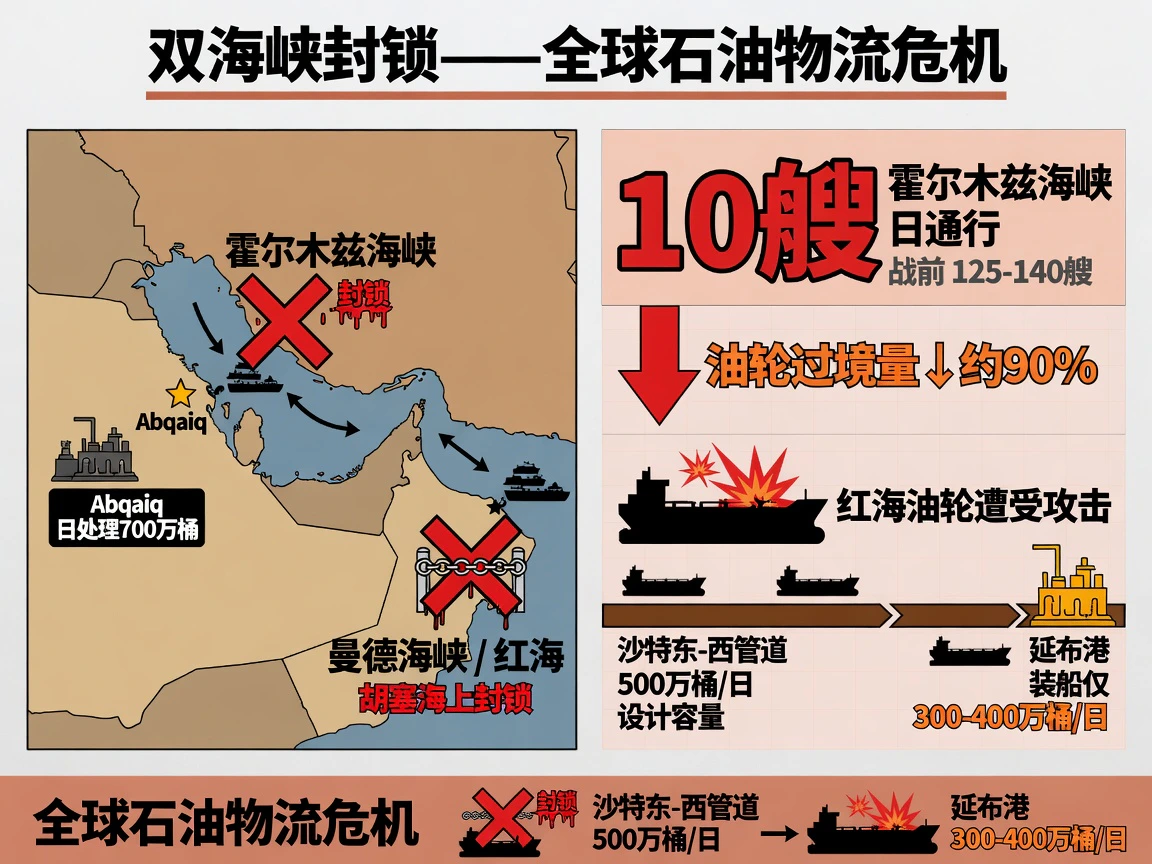
A sequence of military exchanges directly triggered the July 29 rally.
U.S. and Saudi aircraft jointly struck logistics warehouses and weapons sites belonging to the Iran-aligned Popular Mobilization Forces (PMF) in eastern Iraq, reportedly killing at least 20 people and injuring 32, including 6 Iranian advisers among the casualties. Saudi Arabia accused the group of earlier drone attacks on Saudi oil facilities, particularly the Abqaiq processing plant.
Abqaiq is the world's largest crude stabilization center, with capacity of about 7 million barrels a day, handling desulfurization and stabilization of more than half of Saudi crude. In September 2019, precision drone and cruise-missile strikes temporarily shut nearly half of Saudi capacity, about 5.7 million barrels a day, and sent Brent up almost 15% in one session. Renewed danger to the facility immediately intensified concern over damage to critical infrastructure.
Almost simultaneously with the airstrikes, Iran's Islamic Revolutionary Guard Corps launched ballistic missiles at Muwaffaq Salti Air Base in Jordan, prompting Jordanian and U.S. interceptions. On the evening of July 29, U.S. forces struck targets inside Iran. CENTCOM explicitly described the action as a forceful response. Trump had earlier warned of tough action against Iran.
For oil markets, the more material threat was a worsening of maritime logistics bottlenecks:
Daily vessel passage through Hormuz had fallen to about 10, less than one-tenth of the normal 125–140, with tanker and liquefied gas carrier transits down about 90% year on year. Many ships waited offshore. VLCC Middle East–Asia time-charter equivalent earnings remained elevated at $150,000–$200,000 a day. Although below earlier peaks, that was still more than ten times historical norms.
There was no relief at Bab el-Mandeb and in the Red Sea either. After announcing a maritime blockade of Saudi Arabia, the Houthis fired ballistic missiles at the Saudi tankers Encelia and NCC Ghazal over several days. Red Sea tanker traffic remained depressed.
Saudi Arabia's East–West pipeline is a key alternative to Hormuz, with design capacity of about 5 million barrels a day. Actual loading capacity at its endpoint, Yanbu, is only between 3 million and 4 million barrels a day. Continuing Houthi threats to the port area and Red Sea routes limit effective use of that alternative. Simultaneous restrictions on both major oil routes create a logistics bottleneck rarely seen in earlier geopolitical crises.
EIA inventories fall to a six-year low as U.S. refineries approach their limits
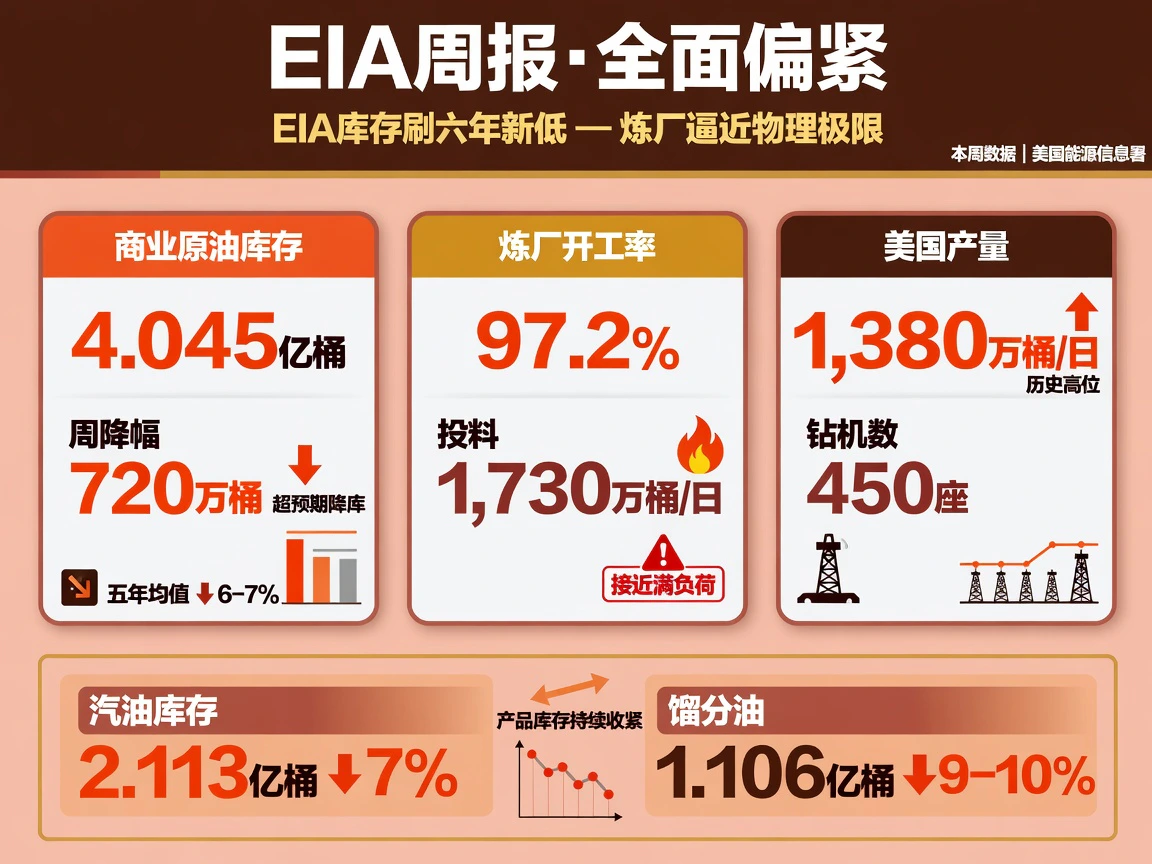
Alongside rising geopolitical risk, tight physical fundamentals amplified price sensitivity.
EIA weekly data released July 29 showed U.S. commercial crude inventories falling 7.2 million barrels to 404.5 million in the week ended July 24. This was the lowest level for that time of year since 2018 and about 6%–7% below the five-year average, a much larger draw than the expected 1.3 million barrels. Gasoline inventories were broadly unchanged at 211.3 million barrels, about 7% below the five-year average. Distillates rose 1.1 million barrels to 110.6 million, but remained about 9%–10% below their five-year average.
U.S. refinery inputs reached 17.3 million barrels a day and utilization rose to 97.2%, effectively full capacity, leaving little room for further increases. Upstream, U.S. crude production remained near a record 13.8 million barrels a day, with 450 active rigs and continued strict capital discipline among exploration and production companies.
The larger-than-expected draw reinforced expectations of a tight spot market, making oil especially sensitive to geopolitical catalysts on the upside.
OPEC+'s seven-country monthly meeting was scheduled for August 2. Markets expected approval of another 188,000-barrel-a-day increase for September, but reports suggested increases might then pause for three months pending reassessment of 2027 capacity baselines. The deeper contradiction was the gap between nominal quotas and actual output. Disruption at Hormuz constrained shipping from major Middle East producers, leaving production substantially below quotas. IEA data put June OPEC+ output at about 32.44 million barrels a day, well below prewar levels.
Record crack spreads expose an even tighter product-supply bottleneck
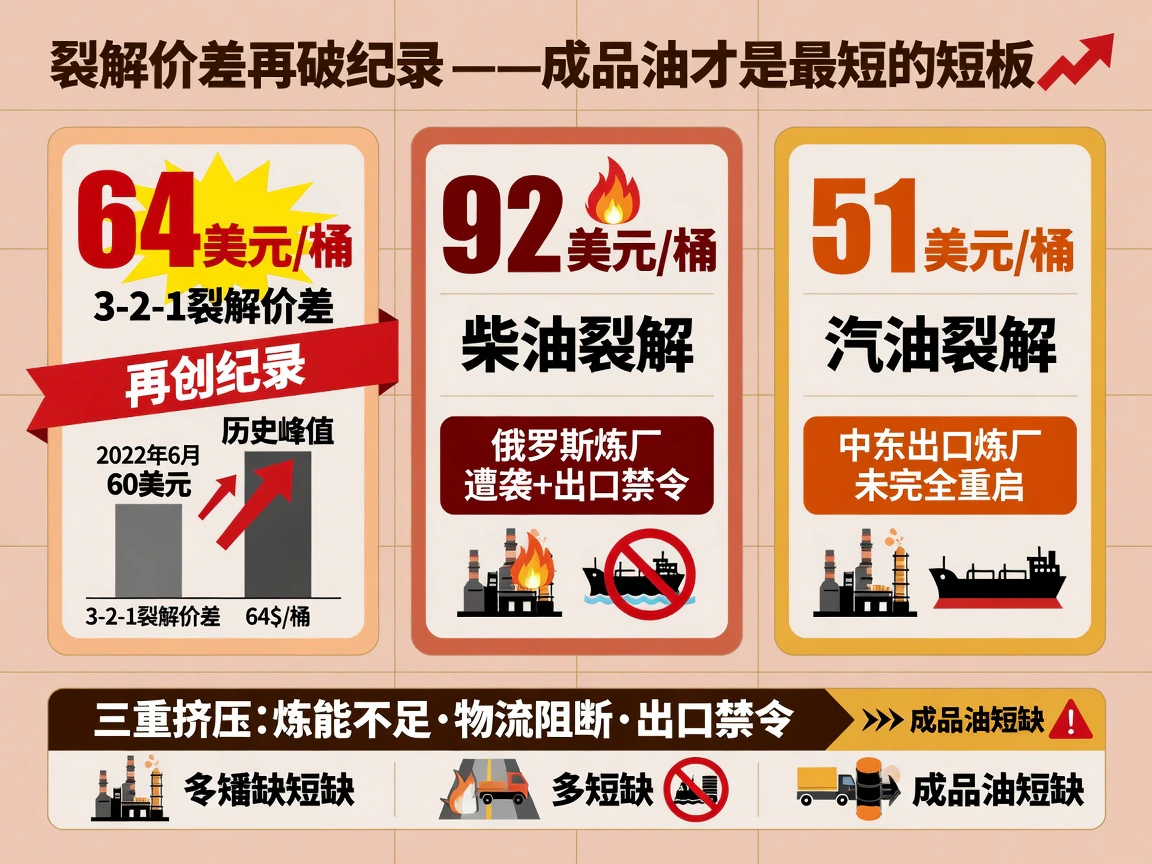
The imbalance in refined products was more acute than in crude. The U.S. Gulf Coast 3-2-1 crack spread reached about $64 a barrel, exceeding the $60 record set in June 2022. Diesel cracks approached $92 a barrel and gasoline cracks were near $51.
These extreme spreads showed that the bottleneck extended beyond crude extraction into refining and interregional transport. Some Middle East export refineries had not fully restored throughput. Continuing damage to Russian refining facilities, together with Russian diesel export restrictions, further compressed effective global product supply.
Even a near-term pullback in crude would therefore offer limited simultaneous relief to households, businesses and industrial users. High downstream cracks were transmitting energy inflation more deeply into the macroeconomy.
The stagflation trade returns: A strong dollar fails to restrain oil
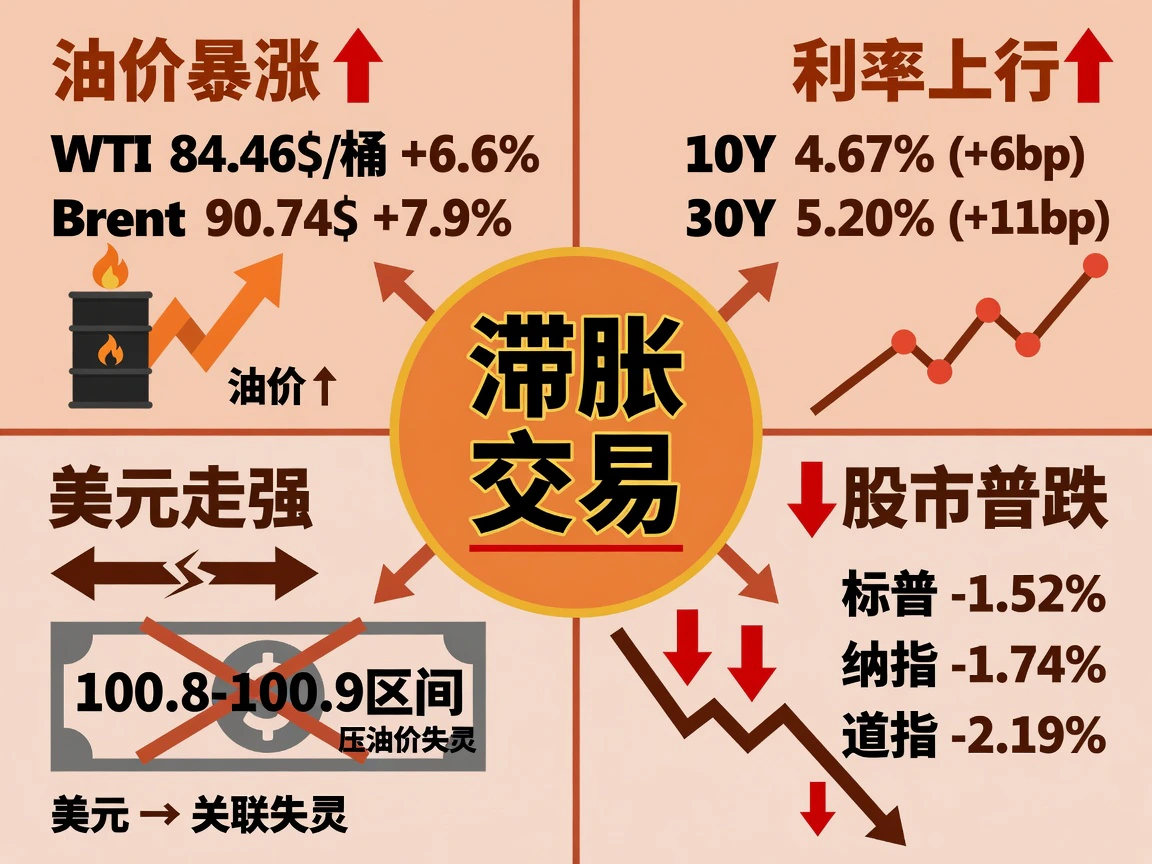
Global assets on July 29 showed a clear stagflation-trade pattern: soaring oil, rising Treasury yields and broad pressure on major equity indexes.
The dollar index remained firm at 100.8–100.9. Since July, oil and the dollar had shown an unusually positive correlation. Conflict-driven supply shortages raised energy prices while strengthening safe-haven demand and expectations that the Fed would keep rates high. The usual strong-dollar restraint on oil temporarily gave way to supply-risk pricing.
The 10-year Treasury yield closed at 4.67%, up 6.0 basis points, and the 30-year at 5.20%, up 11.0. Higher long yields weighed on risk assets: the S&P 500 fell 1.52%, the Nasdaq 1.74% and the Dow 2.19%. Flows showed signs of simultaneous exits from stocks and bonds.
Demand indicators were actually weakening. In its July report, the IEA lowered its 2026 global oil-demand forecast to a year-on-year decline of 1 million barrels a day, including a second-quarter decline of 4.8 million barrels a day. It was the first forecast of annual contraction in nearly six years. Such a downgrade would normally weigh clearly on prices, but with vital shipping routes disrupted and physical supply expectations fragile, supply concerns held complete control over current pricing.
The curve and volatility: Near-term risk premiums dominate
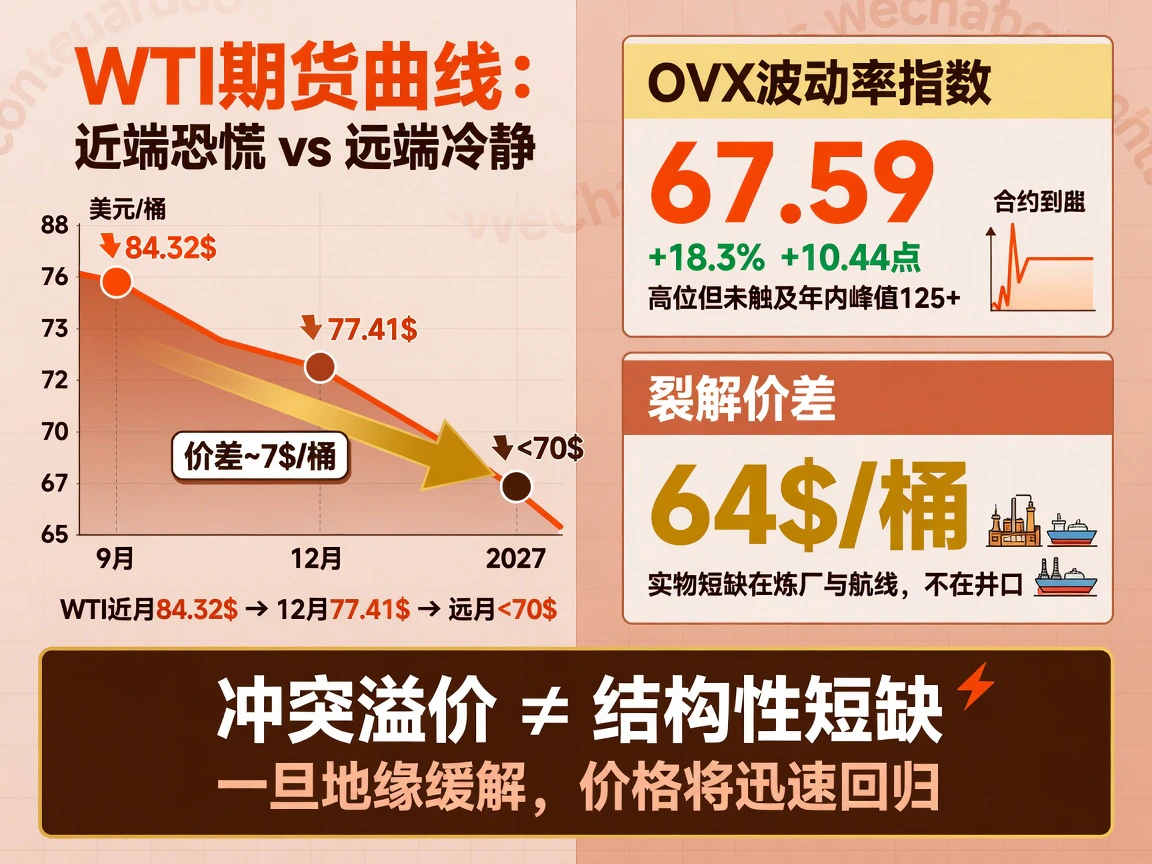
Derivatives and the term structure reveal further features of current pricing:
Oil futures were in deep backwardation. The WTI September–December spread widened to around $7 a barrel, with the annualized deferred discount far above ordinary storage and financing costs. Forward contracts beyond 2027 remained below $70. This strong-front, weak-back structure showed investors primarily trading a temporary geopolitical premium for near-term shipping disruption, rather than endorsing a structural long-run shortage. If tensions ease, deferred prices will provide an anchor for spot prices to return toward.
Option volatility rebounded quickly but had not reached panic extremes. The CBOE Crude Oil Volatility Index (OVX) rose 10.44 points to 67.59, an 18.3% daily gain. That was high within the year's range but well below the earlier crisis peak above 125. Options positions were primarily protecting against wide geopolitical swings, rather than fully pricing a supply cutoff.
Geopolitical risk was lifting energy prices, which in turn raised inflation expectations and long-term yields, ultimately restraining risk assets and real demand. That adverse macroeconomic feedback loop was already operating. Whether oil could find a new balance between the supply shock and weakening demand would depend on substantive changes in passage through the critical shipping routes.


