Oil corrected technically on July 30 after successive rapid gains. September WTI settled at $83.59 a barrel, down $0.87 (-1.0%), while September Brent was near $89.30, down $1.44 (-1.6%). Brent was especially volatile: geopolitical sentiment drove an early Asian high of $93.14 before a retreat to $88.85, a range above $4.
One day's correction did not undermine monthly strength. Both benchmarks gained more than 20% in July, their best month that year. The pullback chiefly reflected profit-taking and consolidation after a rapid advance. Three supports for physical tightness remained: an unexpectedly large U.S. commercial draw, historically extreme product cracks and geopolitical premiums from obstructed Hormuz passage.
Price correction: one day's decline cannot conceal July's gain above 20%
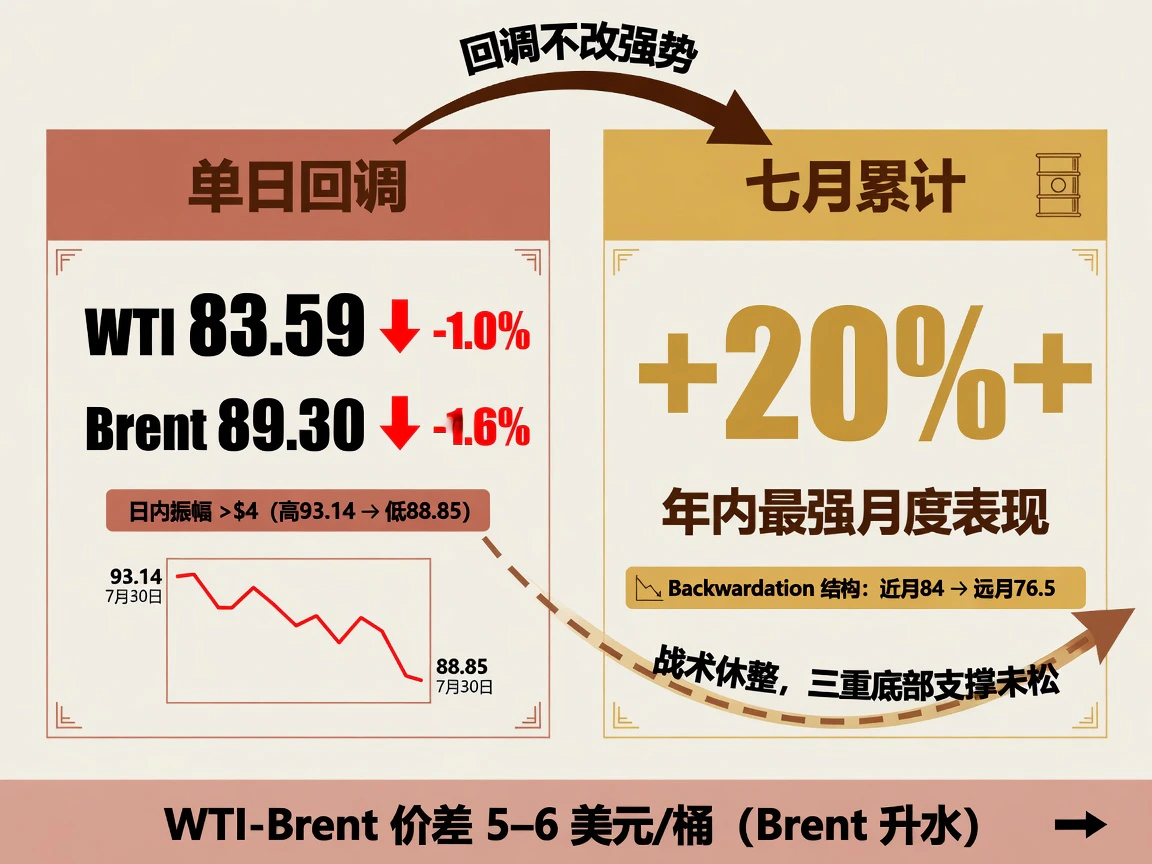
WTI consolidated in a narrow $83.87–$84.32 range without revisiting the prior high; electronic prices near $83.75 at the cutoff extended slight post-settlement weakness. Brent rose above $93 early on geopolitical demand before giving back gains as news of marginally better strait traffic emerged.
Forward curves remained deeply backwardated. WTI September was around $84, December near $76.5 and mid-2027 near $71, with a $7–$8 prompt premium. Brent similarly showed September around $89, December $82.5 and mid-2027 at $76–$77.
The structure priced extreme prompt scarcity and gradual future repair. Steepness had moderated from the year's extremes but remained well above historical norms. Brent's $5–$6 premium to WTI was a relatively wide but normal range since U.S. crude-export liberalization, highlighting Brent's more direct exposure to disrupted Middle Eastern seaborne supply.
Large EIA draw: peak demand and high refinery runs
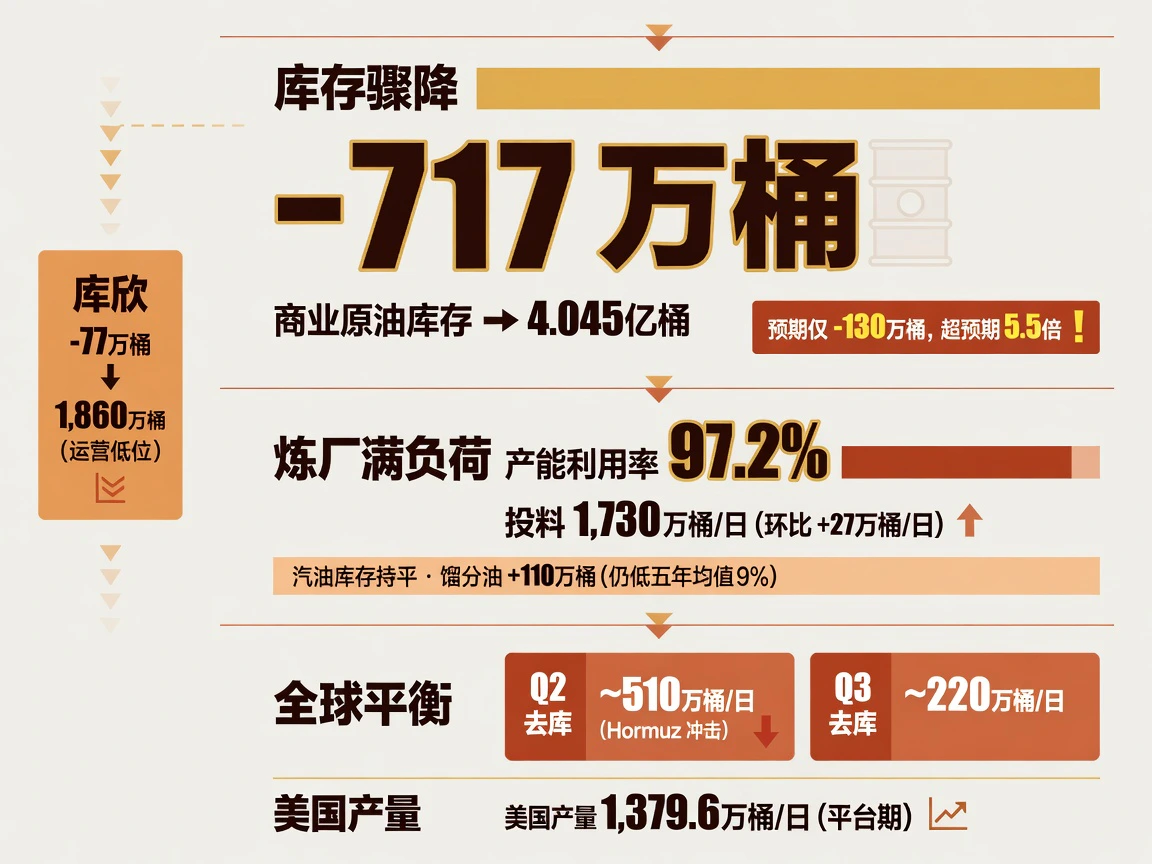
The key fundamental came from EIA's July 29 report for the week ended July 24, with broad tightness:
Commercial crude fell an unexpected 7.17 million barrels to 404.5 million, far more than the 1.3 million expected and about 7% below the seasonal five-year average. Depletion accelerated after two consecutive weekly draws. Cushing stocks fell 770,000 barrels to 18.6 million, again near operating lows and supporting prompt contracts.
Peak-season refinery runs directly drove rapid crude use. Throughput reached 17.3 million barrels/day, up 270,000, and utilization a seasonal 97.2%. Even full runs failed to build products effectively: gasoline was flat and distillates rose 1.1 million barrels but remained about 9% below their five-year average. Downstream tightness did not materially ease.
U.S. output was 13.796 million barrels/day, slightly below early July's record 13.86 million, forming a high plateau with limited immediate incremental responsiveness. July's EIA STEO also confirmed a global deficit: Hormuz disruption produced second-quarter draws near 5.1 million barrels/day, with 2.2 million expected in the third quarter. A turning point could come no earlier than the fourth, meaning draws would span at least the full third quarter.
Extreme cracks: refining is the central bottleneck
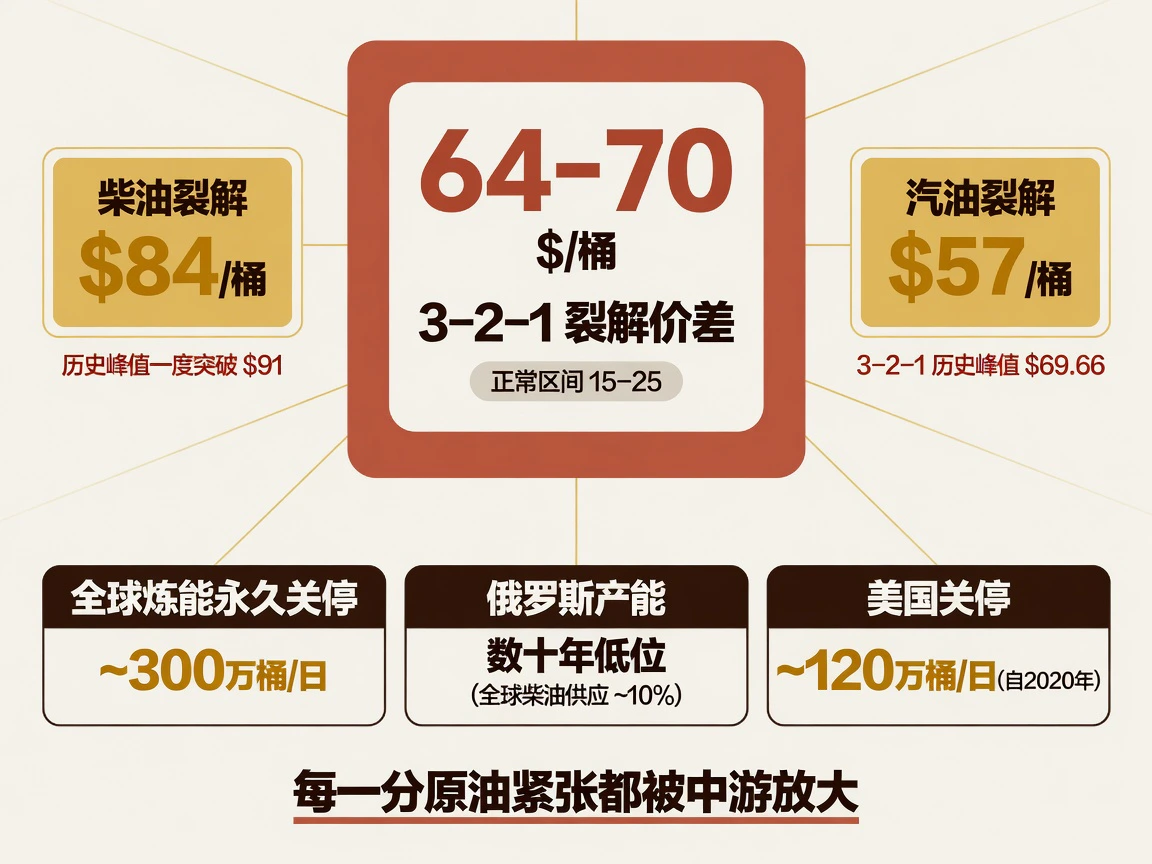
Crude draws confirmed feedstock tightness, but unusual cracks revealed the deeper energy-chain constraint in effective refining capacity.
The U.S. Gulf 3-2-1 crack—the combined margin from three crude barrels yielding two gasoline and one distillate—remained at an extreme $64–$70/barrel, well above its normal $15–$25. Diesel was tightest: ULSD futures cracks around $84 and gasoline around $57. Reuters and RBN Energy showed the combined crack setting a mid-July record $69.66 and diesel temporarily exceeding $91.
The cause was structural loss of effective refining capacity. Some Middle Eastern refineries stopped during first-half conflict, and repeated drone attacks took Russian utilization to multidecade lows; Russia supplies about 10% of global diesel trade. Since 2020, around 3 million barrels/day of capacity permanently closed worldwide, including 1.2 million in the United States. July's IEA report said product balances were even tighter than crude.
Such cracks amplify even small crude tightening geometrically through refining. Marginal upstream logistical improvement cannot remove structural fuel deficits, which continue supporting margins and physical basis.
Hormuz traffic: a small recovery cannot conceal a 90% collapse

Marginal improvement in Hormuz traffic directly triggered July 30's intraday softening.
Kpler and ShipFinder AIS tracking showed roughly 14–19 commercial vessels passing in both directions that day, up from single-digit near-freeze levels. Lloyd's List Intelligence nevertheless counted only 39 passages in July 20–26, versus 82 the prior week, and just 22 were non-Iran-linked. This was a move from near paralysis to low-level testing, with overall traffic still more than 90% below the prewar 100–140 vessels/day.
Security had not fundamentally improved. The Guard claimed it intercepted and expelled two tankers in southern waters and set one ablaze, reaffirming effective closure. Many ships switched off AIS in dangerous waters, and Iranian-linked shadow vessels dominated capacity. War-risk premiums stayed 7.5%–10% of hull value versus a normal 0.15%; a few crossings did not relax risk pricing.
Freight illustrated the constraint. VLCC Gulf–China TD3C TCE remained $380,000–$385,000/day, Gulf of Oman–China TD34 around $120,000, and long Atlantic routes $100,000–$145,000. One-year charters were $105,000–$108,000/day, showing carriers and shippers treating scarce capacity as a medium-term norm.
Risks also spread to other routes: expanded Houthi Saudi restrictions, a strike on the Black Sea CPC terminal affecting Kazakh exports, and a drone attack on Egypt's Damietta port damaging an LNG vessel. Such spillovers meant a small recovery in one waterway could not dismantle the overall premium.
Macro backdrop: weaker dollar and temporarily recovering appetite
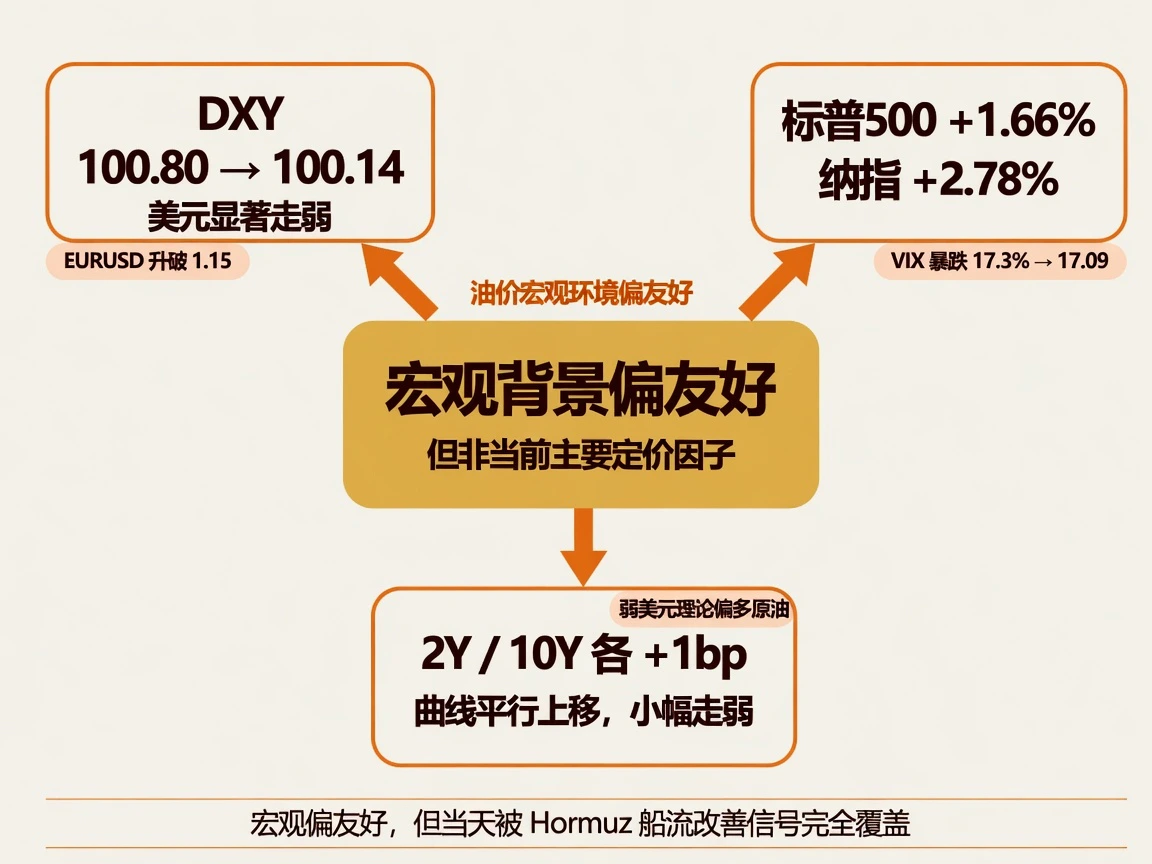
July 30's external backdrop favored bulls. DXY fell from 100.80 toward 100.14 and EUR/USD regained 1.15. A weaker dollar should support dollar-priced commodities, but Hormuz-related premium reversal overwhelmed that benefit.
Markets showed risk recovery: the three U.S. indices rebounded, S&P 500 +1.66%, Nasdaq+2.78%, VIX-17.3% to 17.09. Two- and ten-year yields each rose about one bp in a nearly parallel shift. Macro conditions offered mild support, but physical and geopolitical fundamentals retained control.
OPEC+ preview: symbolic increases versus physical limits
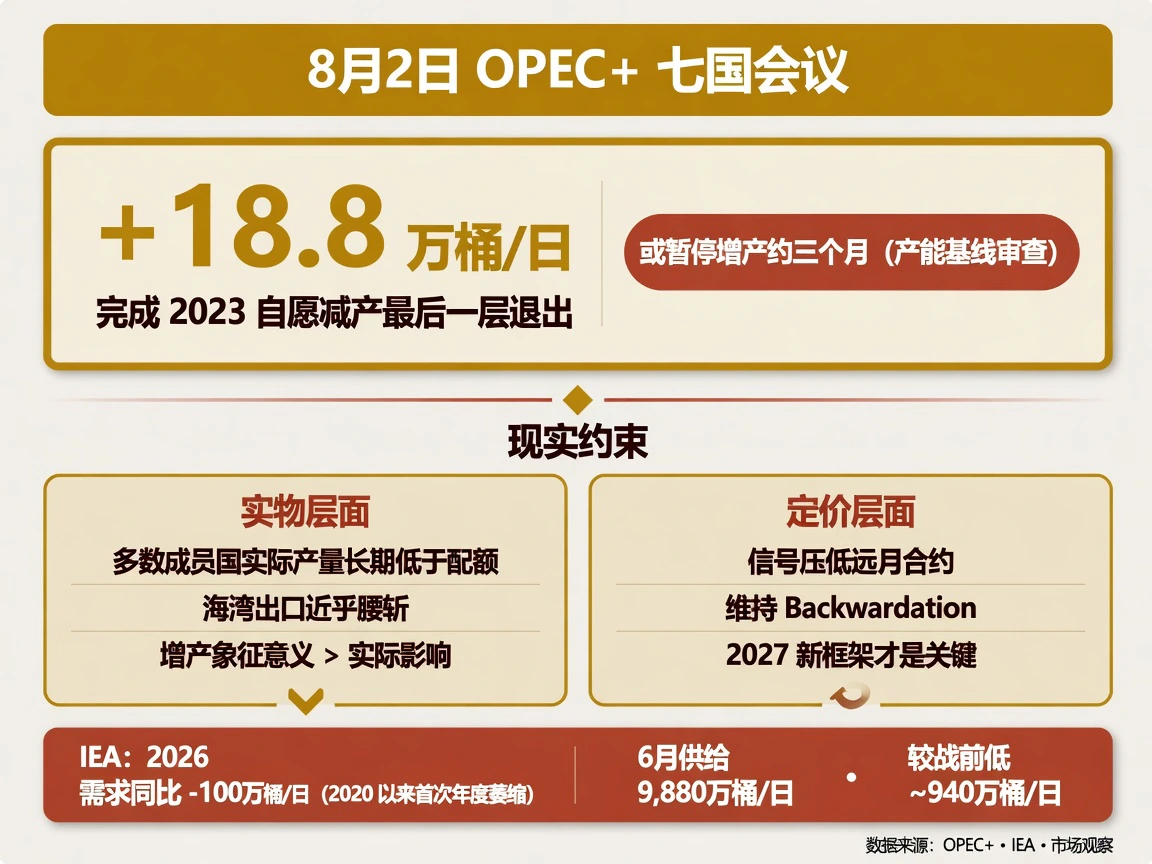
Seven core producers—Saudi Arabia, Russia, Iraq, Kuwait, Algeria, Kazakhstan and Oman—were scheduled to meet August 2 on September quotas. Expectations favored another 188,000 barrels/day, completing reversal of the 2023 voluntary cuts.
Reuters cited sources saying that after September's planned increase, OPEC+ might pause for about three months pending 2027 capacity-baseline assessments. This scheduled finish followed by caution has different effects:
For pricing, nominal guidance mainly affects the far curve, anchoring eventual supply normalization, pressuring 2027 and later contracts, reinforcing backwardation and containing disorderly prompt premiums.
For physical delivery, Hormuz constraints leave most producers' actual exports below quotas. With Gulf seaborne exports nearly halved, the 188,000-barrel/day monthly increment is more symbolic than substantive. The real focus is the 2027 medium-term quota framework following baseline verification.
Demand weakness also matters. The IEA's July report projected 2026 global demand shrinking 1 million barrels/day year on year, the first expected annual decline since 2020, reflecting the real-economy backlash from high first-half prices and product disruption. June supply rebounded 4.1 million barrels/day to 98.8 million, but remained 9.4 million below precrisis normal. A one-day correction had not fundamentally relieved physical tightness.


