Crude futures remained strong on July 31. September WTI settled at $84.67 a barrel, up $1.08 (+1.29%); September Brent at $90.12, up $1.09 (+1.22%). Both gained for a third consecutive session and Brent returned above $90.
Three factors drove the rise: shrinking actual Hormuz traffic, the fastest seasonal US commercial crude draw in nearly seven years and deep backwardation strengthening prompt valuations. The sharper structural imbalance, however, was in downstream products rather than crude feedstock.
Peak-season draws accelerate; high refinery utilization cannot ease supply
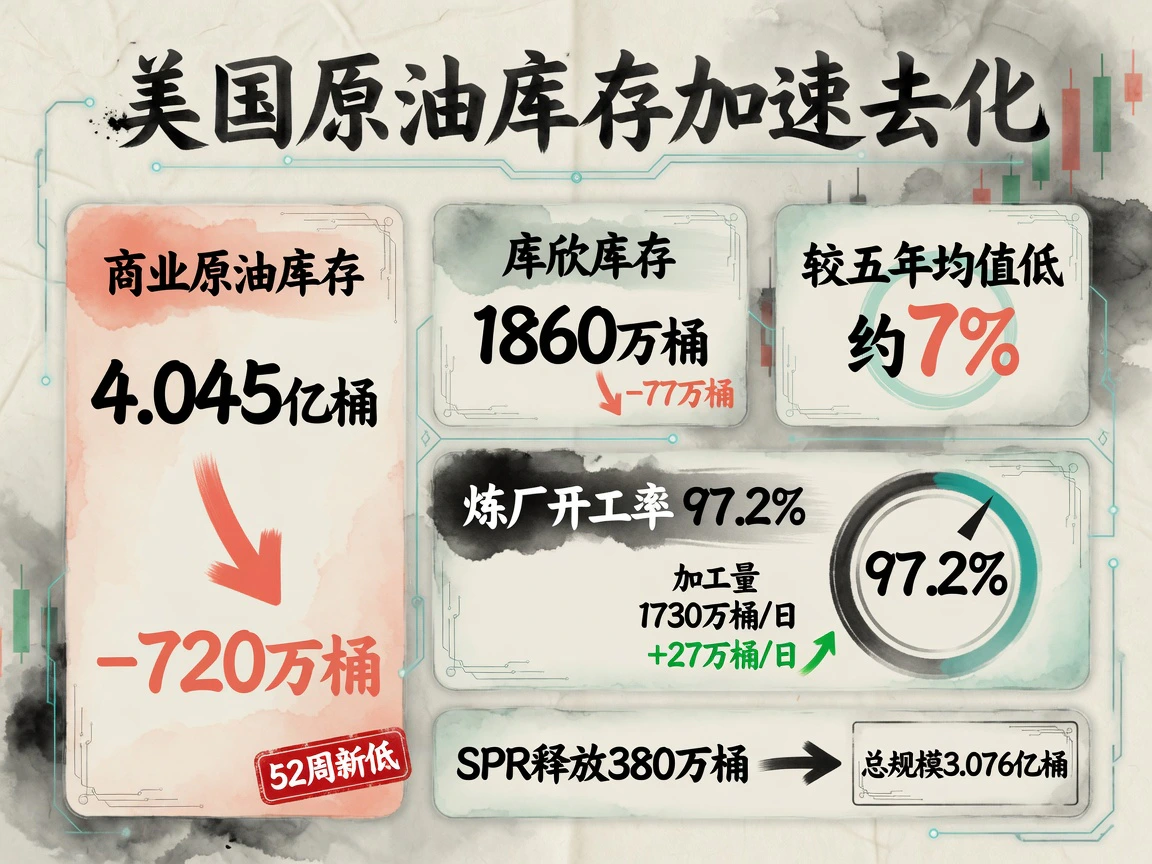
EIA weekly data released July 29 for the week ending July 24 showed broad tightness. Commercial crude fell 7.2 million barrels to 404.5 million, a 52-week low and about 7% below the five-year seasonal average. Cushing fell 770,000 barrels to 18.6 million, approaching operational safety lows.
High refinery demand drove draws. Utilization was 97.2% and crude runs 17.3 million barrels per day, up 270,000 daily. Despite full operation, products barely accumulated: gasoline was flat and distillates rose 1.1 million barrels, with both still well below five-year averages.
SPR released 3.8 million barrels, leaving 307.6 million. Simultaneous commercial and strategic declines showed limited relief from official releases and unchanged tightness across the chain. The August 5 report for the week ending July 31 would be the first full statistical week after material Hormuz obstruction, with changes in draw intensity testing disruption pressure.
OPEC+ adds marginal output, but blocked passage undermines paper quotas

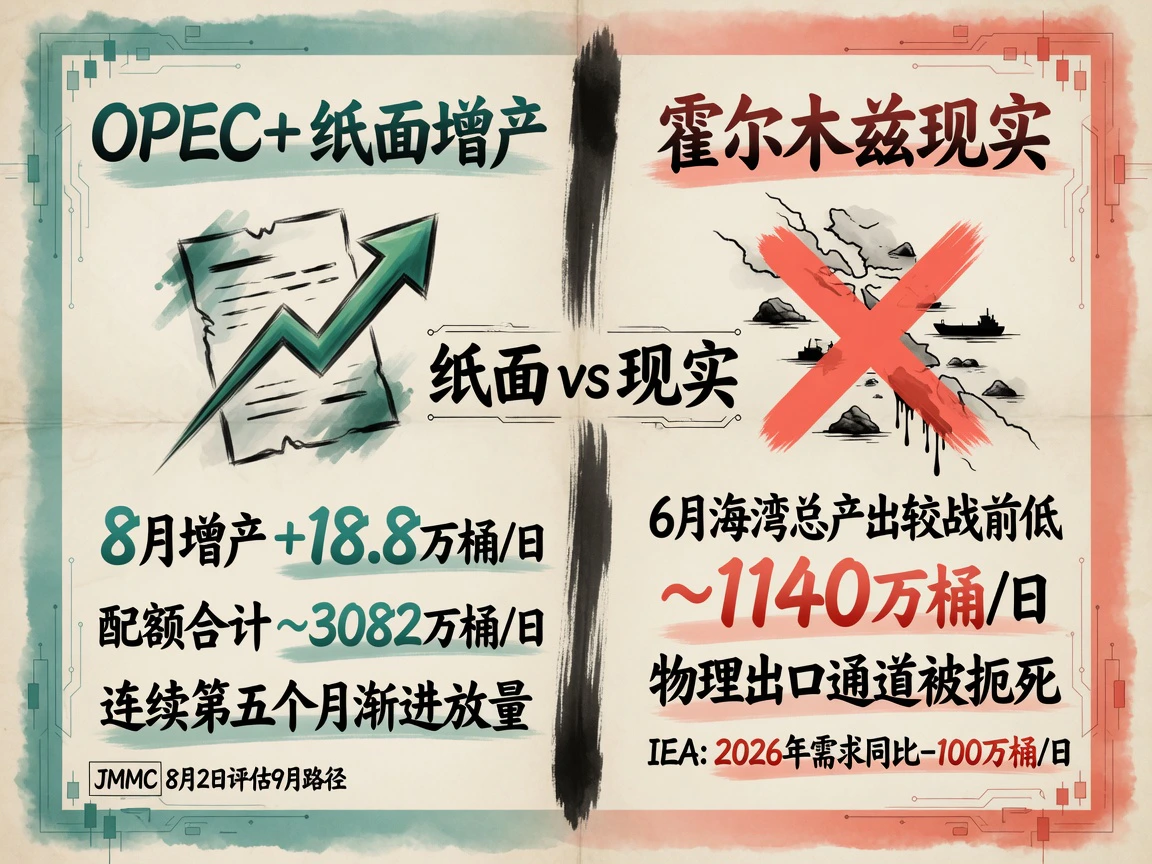
Seven core OPEC+ producers nominally added 188,000 barrels per day from August, a fifth monthly step, with combined effective quotas near 30.82 million barrels per day. JMMC would meet August 2 to review September's baseline.
Blocked physical exports sharply reduced quota relevance. June Gulf production and outbound volumes were around 11.4 million barrels per day below pre-conflict levels. Without resolving export bottlenecks, paper increases could not become global physical supply.
The IEA's July report forecast 2026 demand down about 1 million barrels per day, the first annual contraction since 2020, including a 4.8 million annual decline in the second quarter. Its earlier forecast of second-half oversupply assumed easing Middle Eastern tensions. Renewed deterioration since mid-July had invalidated that premise.
Hormuz traffic falls to single digits as freight and risk premiums soar
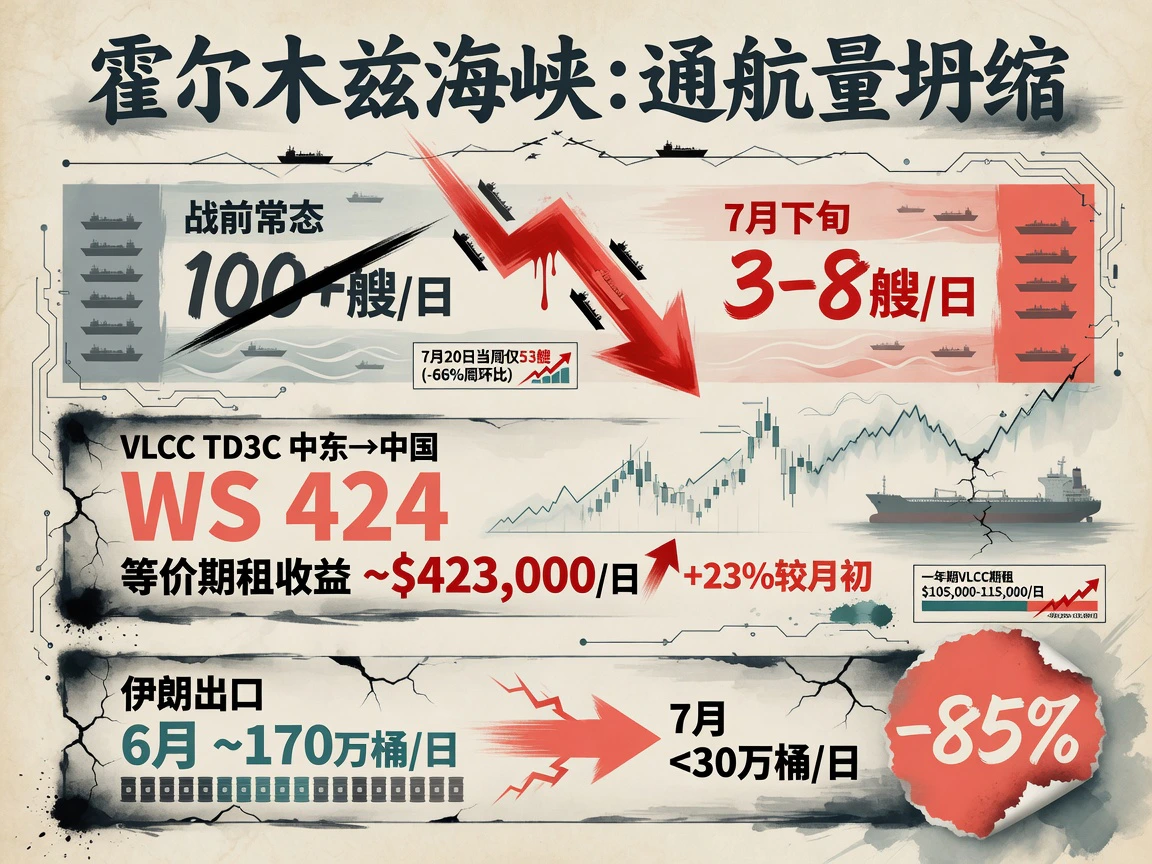
Lloyd's List tracking showed only 53 merchant transits in the week through July 20, down 66%. Late-July two-way daily traffic fell to 3–8, far below more than a hundred before the war. Major commercial owners largely abandoned the northern Gulf after the US tightened Iranian port controls on July 14.
Risk sent spot tanker freight to historical extremes. On July 31 the Middle East-China VLCC TD3C route was assessed at WS 424, equivalent to about $423,000 daily TCE, 23% above early July. One-year VLCC charters were $105,000–$115,000 daily. The nearly fourfold gap suggested expectations that extreme spot rates would not persist, while scarce effective capacity and insurance still dominated prompt pricing.
Iranian exports also collapsed. June briefly recovered to about 1.7 million barrels per day; after mid-July ceasefire breakdown, exports fell below 300,000, over 85% lower and back to May's blockade lows. Chinese buyers continued taking cargoes via shadow fleets and offshore ship-to-ship transfers, but many Iranian tankers were trapped near the coast.
Refining bottlenecks intensify as product cracks hit records
Global product imbalances were sharper than crude's.
By July 31, the US Gulf 3-2-1 crack was around $67 a barrel, close to July 16's record $69.66. Gasoline cracks were about $59 and ultralow-sulfur diesel above $91, all in historical extreme ranges.
Restricted supply combined with northern summer travel: Russian diesel-export limits persisted, damaged Middle Eastern refineries did not restart as planned and some Asian refineries cut runs under margin pressure. The bottleneck shifted downstream as fuel output failed to meet rigid demand. Diesel cracks above $91 directly raised transport and industrial marginal energy costs, transmitting more directly into inflation.
Prompt premiums reinforce themselves as the forward curve diverges
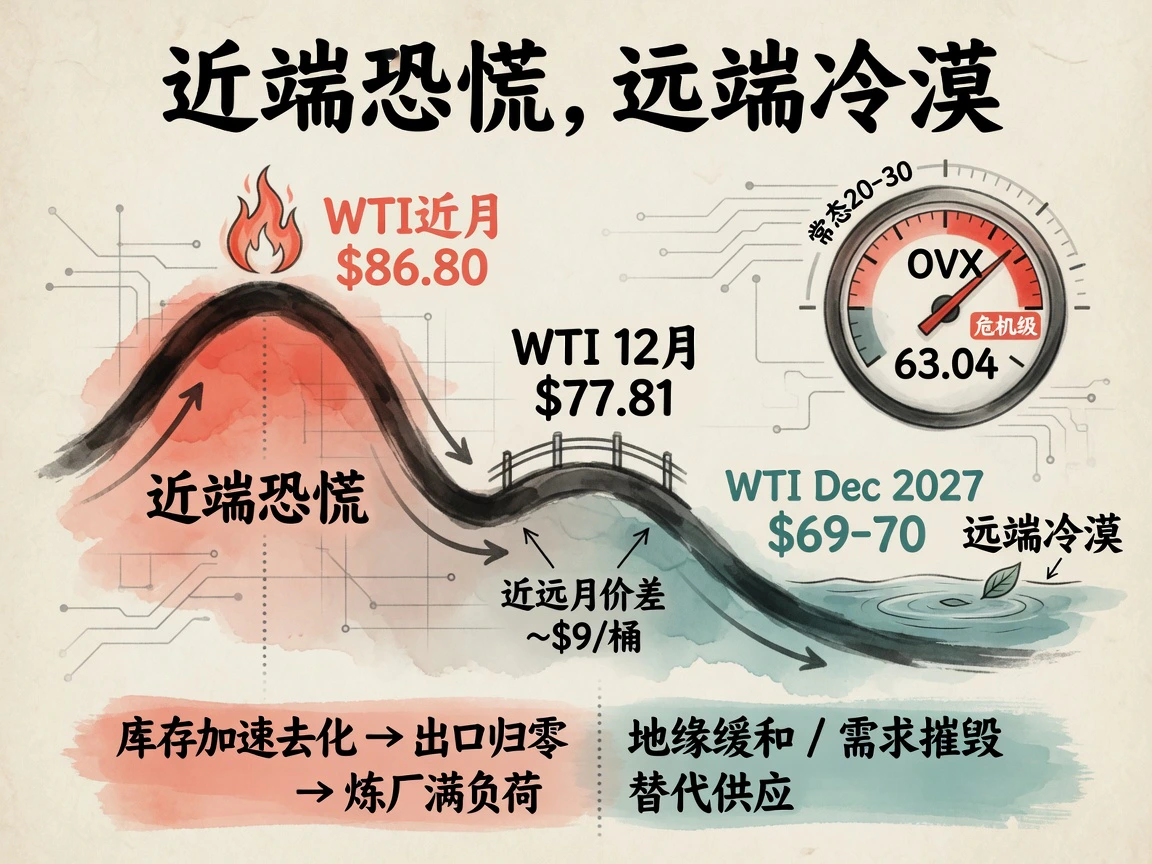
Deep backwardation continued. Nearby September WTI was around $86.80 a barrel against December at $77.81, with M1–M4 near $9. Brent also inverted steeply, around $90 for September and $84 for December.
Accelerating draws, blocked exports and rigid refinery procurement supported prompt premiums. OVX closed 63.04, off its 70.16 intraday high but still at crisis levels versus a normal historical center of 20–30, showing sensitivity to surprise security events.
The distant curve differed: December 2027 WTI traded around $69–$70, reflecting eventual normalization through demand destruction, non-OPEC alternatives or easing tensions. Prompt physical-disruption risk alongside distant rebalancing was the typical wartime structure.
Macro: Treasury yields rise broadly as commodities price supply shocks
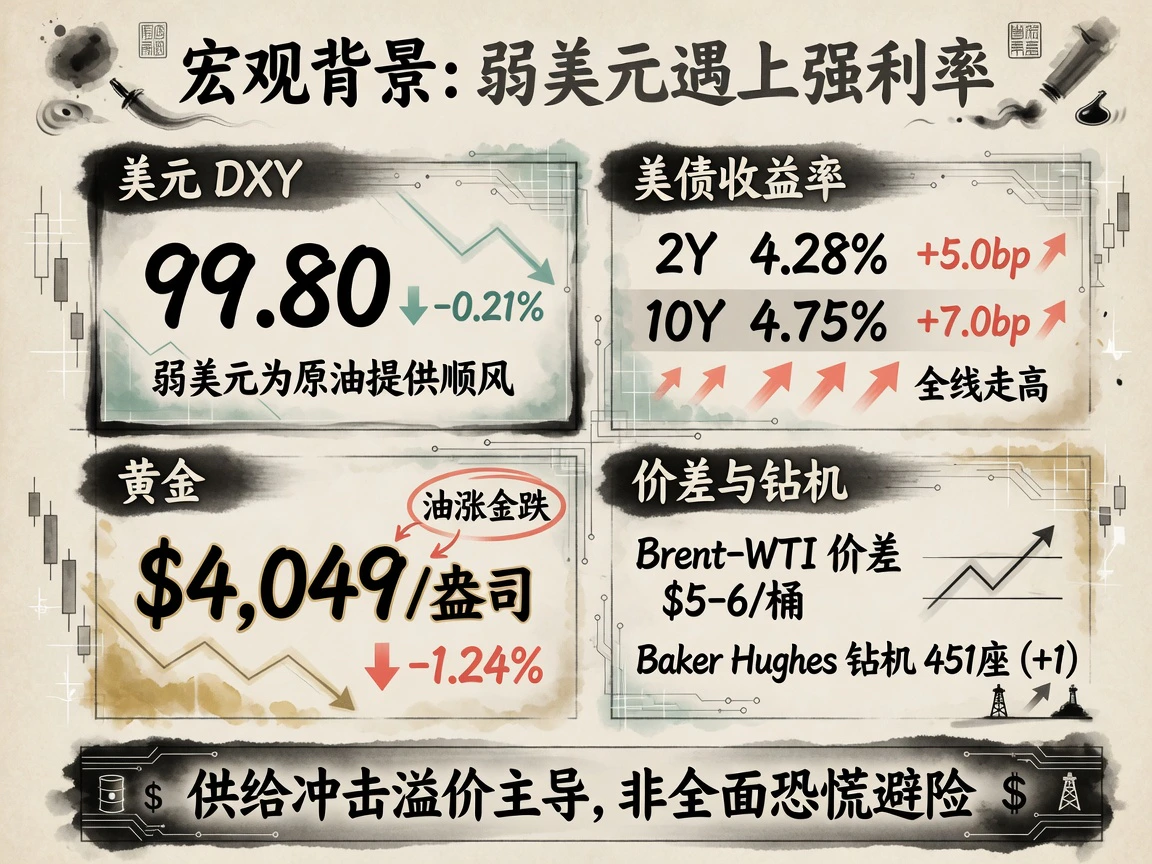
DXY closed July 31 at 99.80, down 0.21%, continuing choppy weakness. Dollar softness provided some pricing support, but geopolitical and physical constraints almost entirely dominated oil, leaving FX's marginal role limited.
Treasury yields rose: 2-year 4.28%, +5.0bp; 10-year 4.75%, +7.0bp. Commodities diverged, with COMEX gold down 1.24% to $4,049 an ounce. Higher oil and lower gold reflected a physical energy-supply contraction rather than broad panic: Hormuz lifted crude while higher nominal and real rates pressured precious metals.
Brent-WTI stayed relatively wide at $5–$6 a barrel, reflecting US Gulf export logistics versus European and Asian physical tightness. Baker Hughes counted one more active US oil rig, at 451. Domestic production stayed high and stable, while the wide spread supported the US export window.


