On July 31, 2026, global cross-asset trading revolved around Treasuries and expectations of further monetary tightening. In the third trading session after the Federal Reserve’s fifth consecutive decision to leave rates unchanged, Treasuries again sold off across the curve. Key yields from two to thirty years generally rose 5–7 basis points, with the thirty-year reaching 5.27%, its highest level since 2006–2007. Three officials who had dissented in favor of a hike at the FOMC meeting spoke publicly in succession, helping push the market-implied probability of a September hike to about two-thirds. All three major US equity indices closed higher on large technology companies’ earnings, but the divergence within the market was stark: Amazon surged about 15%, while Apple fell around 7.4% amid supply-chain bottlenecks. In Asia, South Korea’s KOSPI jumped a record 17.91% in a single day as short covering combined with strong cloud earnings. In commodities, geopolitical disruption around Hormuz supported a large monthly gain in crude, while rising Treasury yields kept gold consolidating at elevated levels. After the close, Trump said the parameters of a ceasefire deal had been agreed and conditionally called off a new round of strikes, leaving room for prices to move in either direction when markets reopened early the following week.
Rates: another sell-off across the curve brings the thirty-year yield near a twenty-year high
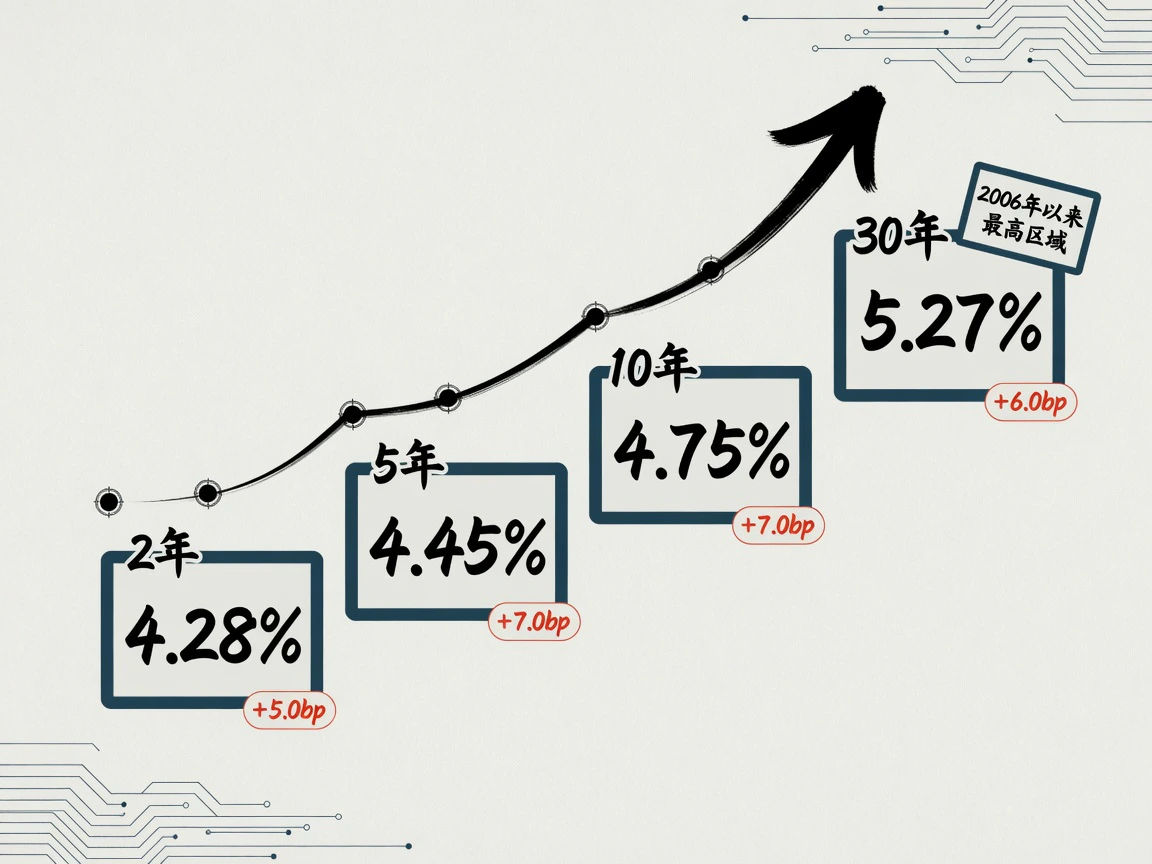
July 31 marked the third consecutive session of Treasury selling after the FOMC left rates unchanged. Official end-of-day par yields published by the US Treasury rose across benchmark maturities: two-year 4.28%, up 5.0 basis points; five-year 4.45%, up 7.0 basis points; ten-year 4.75%, up 7.0 basis points; and thirty-year 5.27%, up 6.0 basis points. The two-year/ten-year spread widened from about 45 to 47 basis points, producing a modest bear steepening. The middle of the curve suffered the largest yield increases, while the front end gave back some of the easing priced after the meeting. The thirty-year yield rose for a third day and, on widely used measures, reached its highest area since 2006–2007. This followed the early-July thirty-year Treasury auction’s yield of 5.058%, the highest auction yield since 2007.
Compared with July 29–30, when shorter yields fell while longer yields climbed, the key change on July 31 was at the front end. The two-year yield’s rise of 5 basis points showed that the market’s previous near-exclusion of an imminent hike was weakening. Investors began to price the possibility of another tightening step around September.
Three parallel developments drove the selling. First, the Fed under Warsh had reduced its forward guidance, and three dissenting votes amplified uncertainty over the policy path, prompting investors to demand a higher term premium on long-dated Treasuries. Second, crude rose more than 1% during the session alongside nominal yields, intensifying concerns about second-round inflation effects from energy. Third, enormous issuance of AI-related investment-grade corporate bonds pushed up coupon benchmarks in credit markets. Inflation breakevens rose only moderately: the ten-year reached 2.28%, up 1 basis point, and the five-year 2.26%, up 2 basis points. Higher real yields and term premiums therefore accounted for most of the increase in nominal yields. Credit performance largely followed Treasury duration: the investment-grade ETF LQD fell around 0.15%, while the high-yield ETF HYG was nearly flat. The pure interest-rate shock was substantially greater than the widening of credit spreads.
Policy and data: September hike odds rise to two-thirds
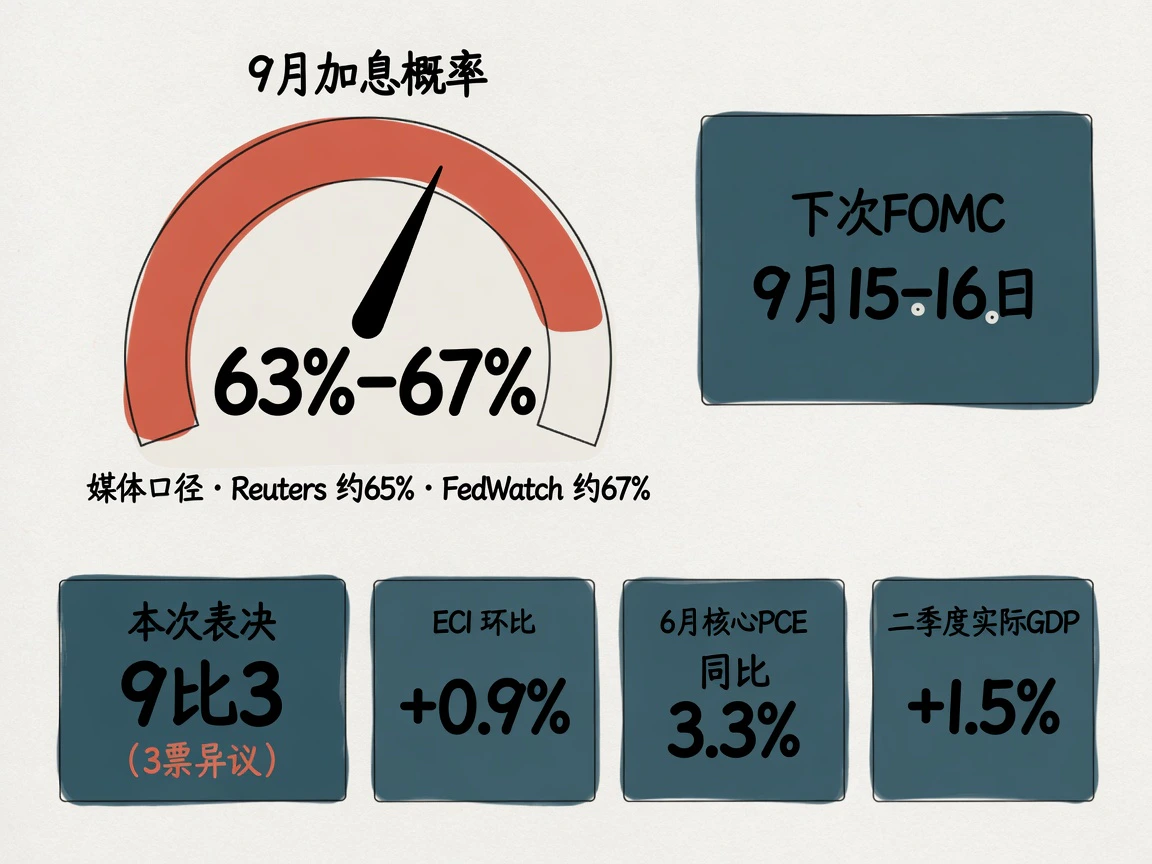
At its July 28–29 meeting, the FOMC held the federal funds target range at 3.50–3.75% for a fifth consecutive meeting. The vote was 9–3, with three members dissenting in favor of a 25 basis point hike. On Friday, officials in the dissenting camp spoke in succession. Cleveland Fed President Beth Hammack said the policy stance was insufficiently restrictive; Minneapolis Fed President Neel Kashkari favored acting early in gradual, small steps; and Dallas Fed President Lorie Logan warned that delaying a response could increase the risk of having to tighten sharply later. St. Louis Fed President Alberto Musalem also told the Financial Times that the Fed needed rate hikes to restore its inflation credibility. Attention quickly shifted to whether September would bring an additional 25 basis points. Media estimates put the implied probability of a September increase at around 63–67%, with Reuters reporting roughly 65% and CME FedWatch around 67%. This reflected a revision of expectations following macro data and dissenters’ comments; an actual September move still depended on the subsequent run of data.
Data released on July 31 remained strong overall. The US Employment Cost Index rose 0.9% quarter on quarter in Q2, above expectations of 0.8%. Within it, private-sector wage growth accelerated from 0.7% in Q1 to 0.9%. The University of Michigan’s final consumer sentiment reading was revised up to 55.2, while the Chicago PMI came in at 57.6. None of these releases supported the FOMC majority’s case for continued waiting.
Thursday’s key macro releases showed further resilience. The advance estimate put Q2 real GDP growth at an annualized 1.5%, below consensus of around 2.1%, but domestic demand components were very strong: final sales to private domestic purchasers grew 3.9%, personal consumption expenditures 3.2%, and equipment investment about 15%. The weaker headline largely reflected a wider trade deficit and inventory drawdowns, a combination indicating that domestic demand was stronger than domestic supply as measured in GDP. A recession narrative was difficult to sustain. June core PCE inflation was 3.3% year on year and 0.1% month on month. The 0.1% monthly decline in headline PCE depended heavily on a temporary fall in energy prices. With Middle East hostilities reigniting and oil recovering in July, a straight-line extrapolation of disinflation carried substantial risks. The personal saving rate had also fallen to 2.7%, suggesting that resilient consumption was drawing down excess savings.
The August 3–7 calendar brings a week of major releases: ISM manufacturing on August 3; JOLTS job openings on August 4; ADP employment and ISM services on August 5; initial jobless claims and productivity on August 6; and July nonfarm payrolls on August 7. With June payrolls up only 57,000 and April–May revised down by a combined 74,000, July’s report will test whether the slowdown in employment was a one-off reversal or a more persistent weakening. The Jackson Hole central banking symposium is scheduled for August 27–29, and the next FOMC meeting for September 15–16.
Equities: cloud earnings provide support as Korean shares stage a record rebound
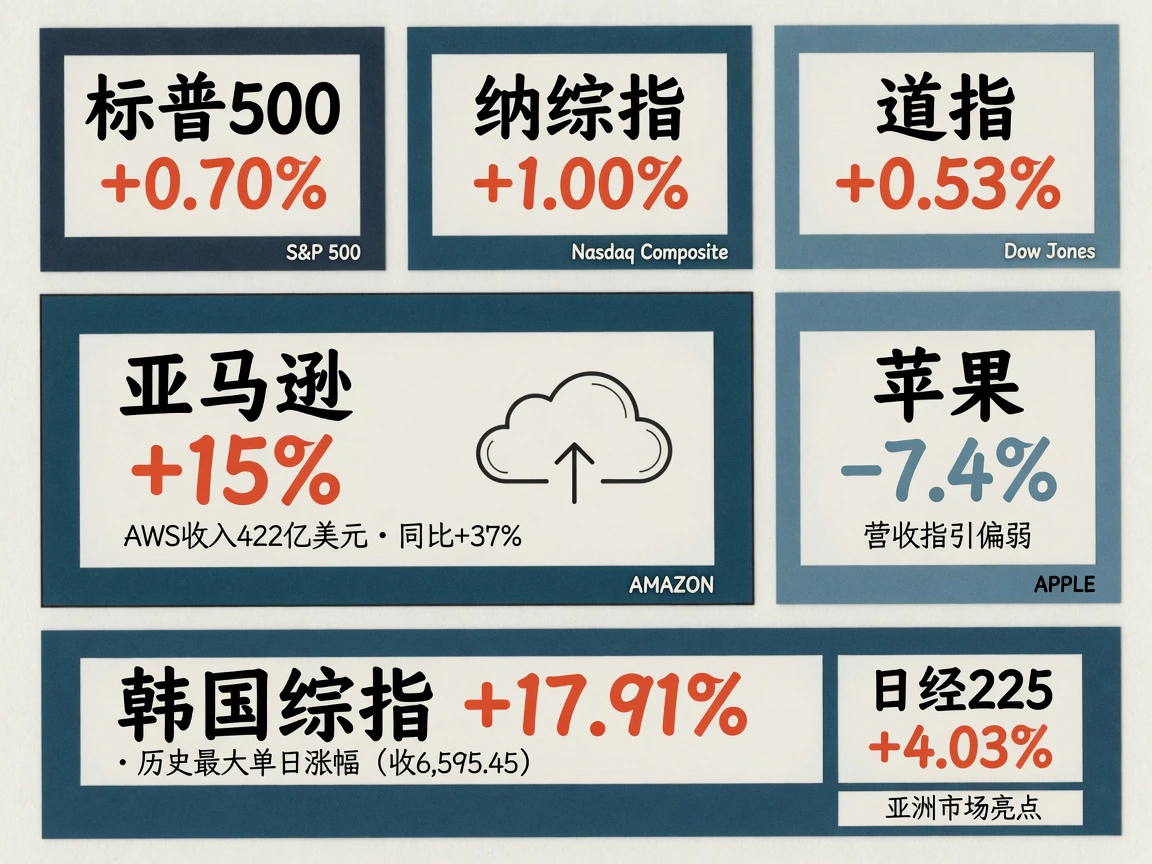
All three major US equity indices rose on July 31: the S&P 500 closed at 7,489.72, up 0.70%; the Nasdaq Composite at 25,373.85, up 1.00%; and the Dow Jones Industrial Average at 52,485.03, up 0.53%. Those gains masked sharp internal divergence. The Russell 2000 small-cap index fell 0.50%, while declining S&P 500 constituents outnumbered advancers by about 1.3 to 1. The VIX closed at 15.99, down 6.44%, continuing its retreat from above 20 around the Fed decision. A handful of heavyweight leaders drove the indices higher. The S&P information technology sector fell about 0.54% under Apple’s drag, and the Philadelphia Semiconductor Index gained just 0.07%.
Two bellwether technology stocks dominated the session. Amazon surged about 15%. Its results showed AWS Q2 revenue of roughly $42.2 billion, up around 37% year on year, the fastest growth in 18 quarters. The backlog approached $500 billion, and full-year capital expenditure guidance was raised to about $220 billion. Investors readily rewarded its position in an industry where demand far exceeded supply, temporarily setting aside concerns about still-negative free cash flow. Apple, by contrast, fell around 7.4%. Although quarterly earnings beat expectations, the market viewed its next-quarter revenue growth guidance as disappointing. Bottlenecks in key components and high-bandwidth memory severely undermined the hardware shipment outlook. Microsoft added about 3% after Thursday’s approximately 15% rally, while most other cloud and digital-advertising giants also rose. Investors’ selection criteria were clear: a premium was available only to companies turning AI capital expenditure into verifiable cloud revenue.
Asian markets staged the most extreme rebound in the global AI trade that day. The KOSPI surged 17.91% to 6,595.45, its largest one-day gain on record, surpassing the previous record of 11.95% on October 30, 2008 during the financial crisis. Samsung Electronics rose about 27%, while SK Hynix hit the 30% daily limit. Foreign net buying reached a record, while retail investors sold heavily into the rebound. The historic recovery combined a short squeeze after extreme overselling with support from US cloud earnings. Even so, the KOSPI still lost about 22% in July and remained nearly 30% below its June high. In Japan, the Nikkei 225 rose 4.03% to 64,362, led by memory and semiconductor-equipment shares, with the Bank of Japan’s decision to hold rates providing a stable backdrop. The Hang Seng gained only 0.10%, diverging sharply from the Japanese and Korean chip rally. In currencies, the yen appreciated 1.91% against the dollar, with USD/JPY at 160.18, and the won also strengthened.
Commodities: oil posts a strong month despite a weekly fall; rates keep gold consolidating near its highs
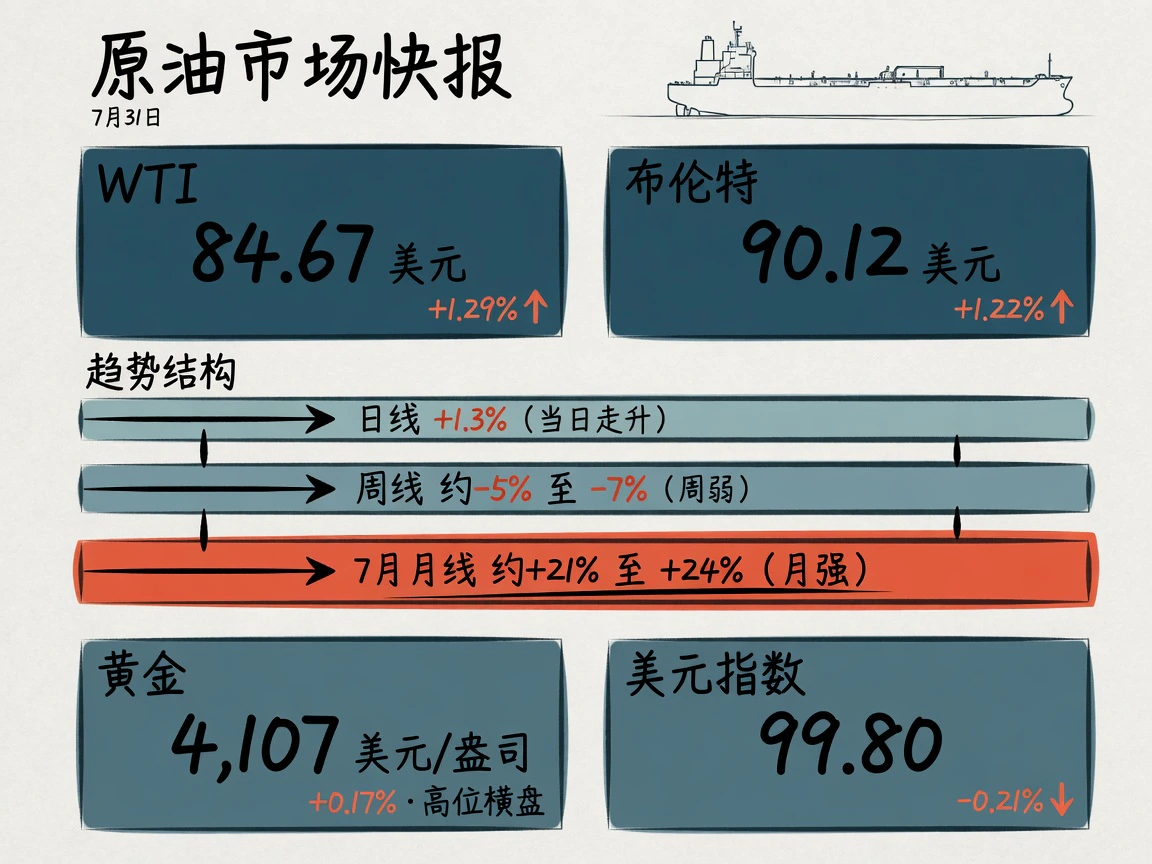
Crude showed three different patterns across time horizons: daily gains, a weekly correction and a strong month. On July 31, nearby WTI settled at $84.67 per barrel, up 1.29%, and Brent at $90.12, up 1.22%. Prices remained about 5–7% below the previous Friday, but gained roughly 21–24% over July, their strongest monthly performance in three months. Early Asian trading had been soft and choppy on hopes of improved passage through the strait. It then shifted to a repricing of tail risks after Iran claimed to have intercepted US-escorted tankers in Hormuz, and oil ultimately closed near its highs. US and UK maritime agencies had not independently confirmed the interception, however, and Kpler data showed occasional large-tanker transits: daily traffic remained far below prewar norms but had not fallen completely to zero. Short-haul movements of oil around Hormuz had become more active, with more ship-to-ship transfers near Oman, suggesting a partial repair of logistics. Yet the threat of a Red Sea blockade persisted, London insurers expanded the areas classified as high risk, and a Saudi-led multinational defense alliance had announced its formation, with about 14 countries signing the founding declaration. Its actual escort effectiveness and the direction of insurance premiums remained to be seen. In the fundamentals, US crude production in May was about 13.71 million barrels per day, roughly 2% below April’s peak. Petroleum product demand was around 20.07 million barrels per day, its lowest since March 2025. The supply-demand backdrop remained tight.
Gold continued to trade primarily on interest rates. The active continuous COMEX gold contract settled at $4,107 per ounce, up just 0.17%, consolidating at elevated levels under pressure from rising Treasury yields. The dollar index fell 0.21% to 99.80, yet gold failed to strengthen despite the weaker dollar. That indicated that the rising interest-rate opportunity cost of holding gold significantly outweighed its simple negative beta to the dollar. On a monthly basis, gold ended four consecutive months of declines and recorded its first gain in July.
Geopolitics and the weekend: ceasefire expectations leave room for moves in either direction

The key question during July 31 trading was whether friction across multiple shipping routes could restore the geopolitical premium squeezed out early in the week. Iran claimed that the Revolutionary Guards had attacked two tankers attempting to cross under US escort and forced about four others to turn back. Other disruptions included a fire on an LPG vessel at Egypt’s Mediterranean port of Damietta and interrupted loading at the CPC terminal on the Black Sea. Together they supported prompt oil premiums. Across assets, oil rose, US equities gained, the VIX stayed low and gold edged higher. Markets were treating the incidents as evidence of persistent localized supply friction, with no systemic panic developing. Rising Treasury yields were more a repricing of macro fundamentals and the monetary policy path, and could not be attributed solely to geopolitics.
After the close and into the weekend, the focus quickly shifted to a conditional ceasefire option. In an August 1 social media post, Trump said that although US forces were ready to act, the parameters of a deal had been agreed, and he had therefore called off a new round of strikes. His condition was a rapid agreement encompassing the immediate and full reopening of Hormuz and the complete elimination of Iran’s nuclear threat. He also claimed that Israel had joined the commitment. Iranian officials subsequently denied having requested a ceasefire. Meanwhile, the UK Maritime Trade Operations office reported two incidents off Oman, including a tanker struck by an unidentified projectile that damaged its engine room, while Kuwait said it had shot down drones from Iran. These statements and localized incidents all came after the market close. They did not establish a binding peace agreement or imply an immediate restoration of shipping capacity through the strait. Ahead of Monday’s opening, markets were expected to retain two pricing paths: ceasefire hopes could compress prompt premiums, while a failed agreement could trigger a second rebuilding of the geopolitical risk premium.
On trade policy, the US Section 232 tariff framework for patented medicines took effect for the first group of multinational pharmaceutical companies at 00:01 Eastern time on July 31, with a 100% baseline tariff and tiered exemptions. A Senate bill proposing secondary tariffs related to Russia won bipartisan procedural support. With the House in recess until August 31, however, it had not become law in the near term.
Overall, rates were pricing a higher probability of a September hike and a rebuilding of long-term premiums. Equities were pricing support for the indices from the commercialization of AI cloud services. Oil was pricing persistent logistics bottlenecks alongside a premium that negotiations could squeeze at any time. Whether these three pricing dynamics remained in balance would depend on the coming week’s major employment releases and the actual outcome of the weekend’s geopolitical maneuvering.


