On July 31, oil swung sharply and recovered from lows amid conflicting accounts of restored navigation and military interception. WTI and Brent both closed higher at recent highs, ending a strong July. With weekend markets closed, today's monthly OPEC+ meeting was the immediate focus. Yet the dominant variable had moved beyond paper quotas: high cracks and blocked capacity pointed to product scarcity and maritime bottlenecks as the core physical imbalance.
Two ships leave, two are intercepted; oil falls then rises
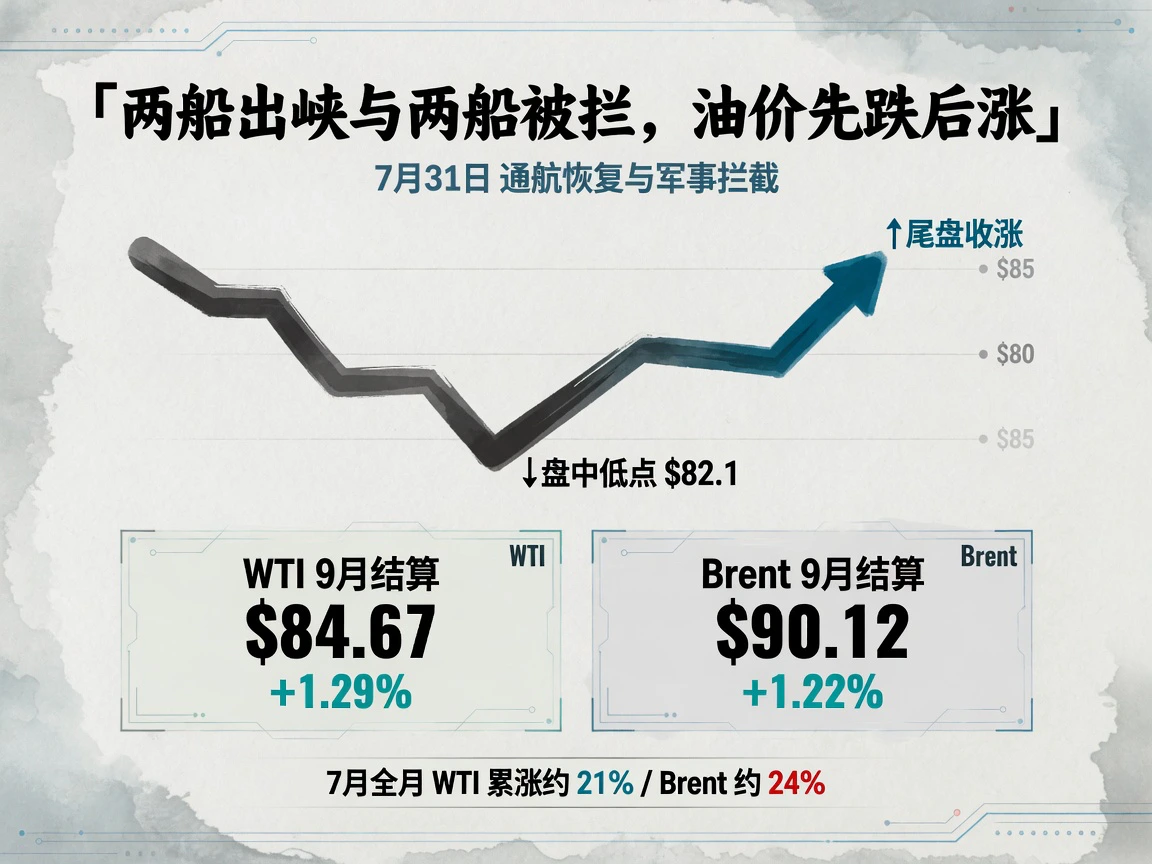
September WTI settled July 31 at $84.67/barrel, up $1.08, or 1.29%; September Brent $90.12, up $1.09, or 1.22%, back above $90. Asian reports of two loaded VLCCs leaving Hormuz and some merchant traffic resuming initially pulled oil down over 1%, with WTI briefly around $82.1. The Guard then claimed to intercept two departing ships and force four tankers back, prompting a risk-driven late rebound. The interception remained Iran's unilateral claim, not independently confirmed by Western maritime bodies.
WTI gained about 21% in July and Brent roughly 24%, on Reuters' basis, their biggest monthly rises since March.
Deep backwardation persisted: September WTI $84.67 versus December $76-$78, a prompt-deferred gap of $8-$9/barrel. This was far below April's extreme near $40 but did not indicate meaningful prompt relief. Brent-WTI stayed near $5.5. Bulls still paid for tail disruption risk: OVX closed at 63.04, down 0.63%, after a 70.16 intraday high. Friday's tight pricing would carry through the weekend to Monday's open.
Inventories keep drawing; Cushing falls below the operating floor
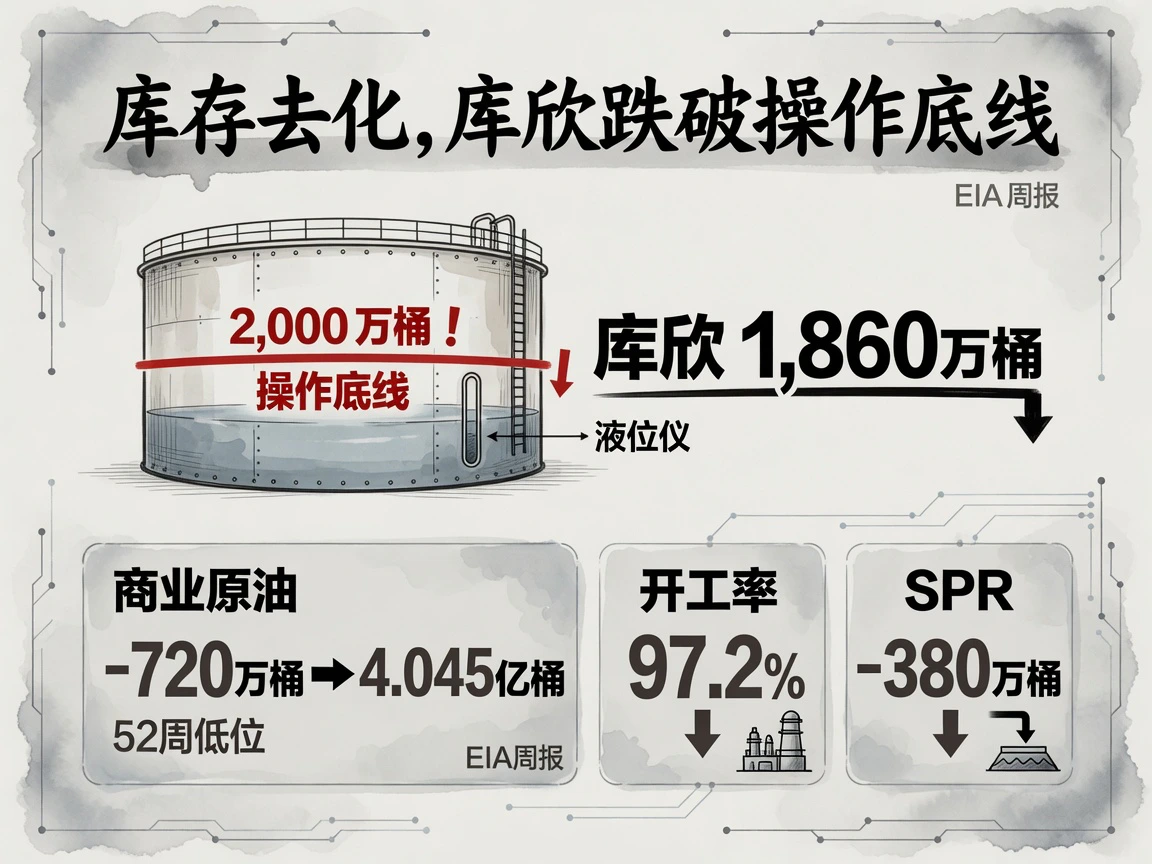
The latest EIA report for the week ended July 24 confirmed accelerating U.S. depletion. Commercial crude fell 7.2 million barrels to 404.5 million, a 52-week low and about 6%-7% below the five-year seasonal average. Cushing fell another 770,000 to 18.6 million, below 20 million, traditionally considered its tank-and-pipeline operating floor or tank bottom. Below that level, some bottom stocks become hard to withdraw and schedule, materially tightening WTI delivery.
Refineries ran near full load at 97.2%, processing 17.3 million barrels/day. Gasoline stocks around 211 million were roughly 7% below the five-year average. Distillates rose 1.1 million to 110.6 million but remained 9%-10% below seasonal norms. SPR fell 3.8 million to 307.7 million. The August 5 report for the week ended July 31 would first fully capture renewed strait escalation's effect on the balance.
OPEC+ meets today, with more supply still mainly on paper
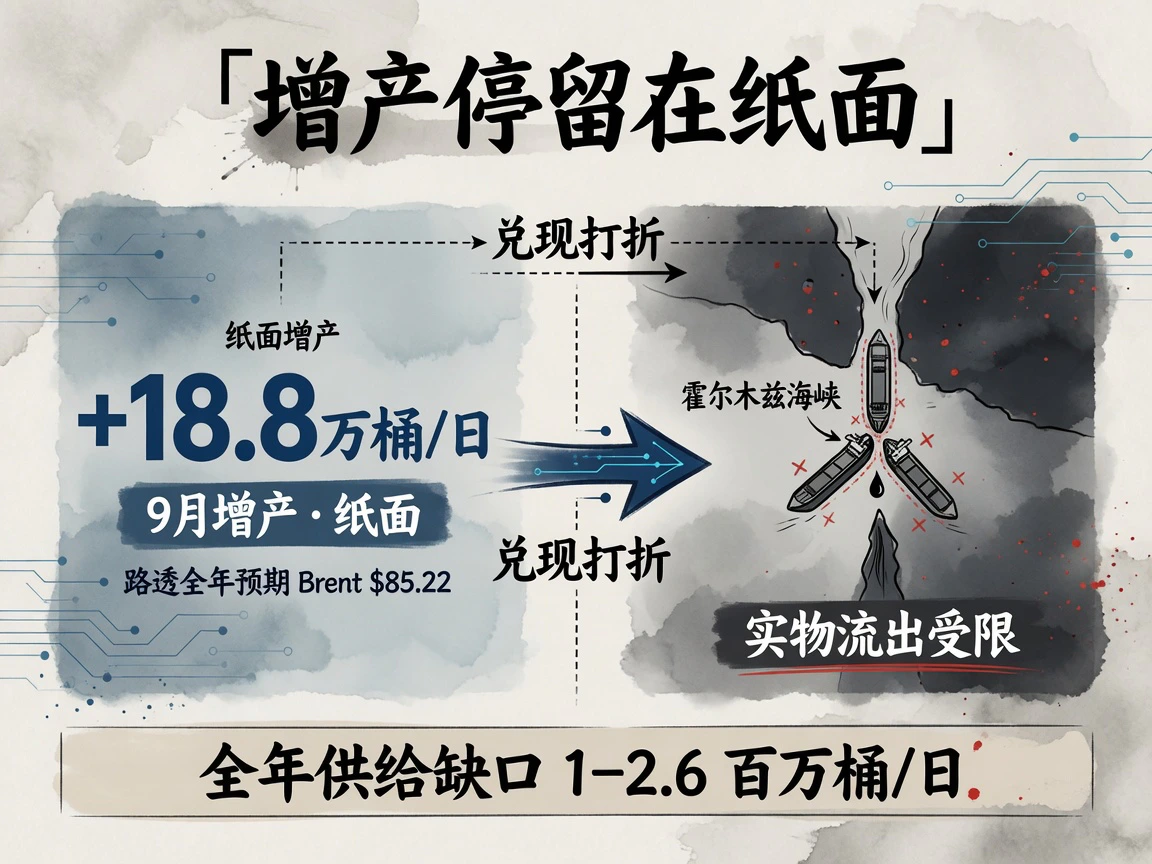
Seven core members—Saudi Arabia, Russia, Iraq, Kuwait, Kazakhstan, Algeria and Oman—were due to meet online today, with no official decision by publication. Several premeeting sources suggested another September increase of 188,000 barrels/day, continuing the gradual reversal of the voluntary cuts in place since April 2023, before a possible pause. July 5 had already approved the same August increase, but obstructed Hormuz flows left much quota expansion as paper supply.
Institutions also raised their pricing of tightness. A July 31 Reuters poll of 31 analysts put annual Brent at $85.22, up from $84.50, and WTI $80.14, up from $79.49, with a full-year deficit of 1 million to 2.6 million barrels/day. Most thought complete normalization would take 4-6 months even after a ceasefire.
Regional exports differed. Baker Hughes July 31 data put U.S. oil rigs at 451, up one, and total rigs 588, with shale steady. Gulf departures briefly recovered to 12 million-13 million barrels/day in July's first half before slowing after midmonth. Iranian exports fell to 200,000-260,000 barrels/day in May, briefly recovered to 1.6 million-1.8 million in June's waiver window, and faced renewed pressure after July 7's waiver cancellation and blockade, relying mainly on shadow tankers and transfers. Indian Oil Corporation raised its spot-procurement share from about 50% to 84%, turning toward West Africa, Latin America and unrestricted Russian supply.
Weaker dollar meets higher yields; the supply logic prevails
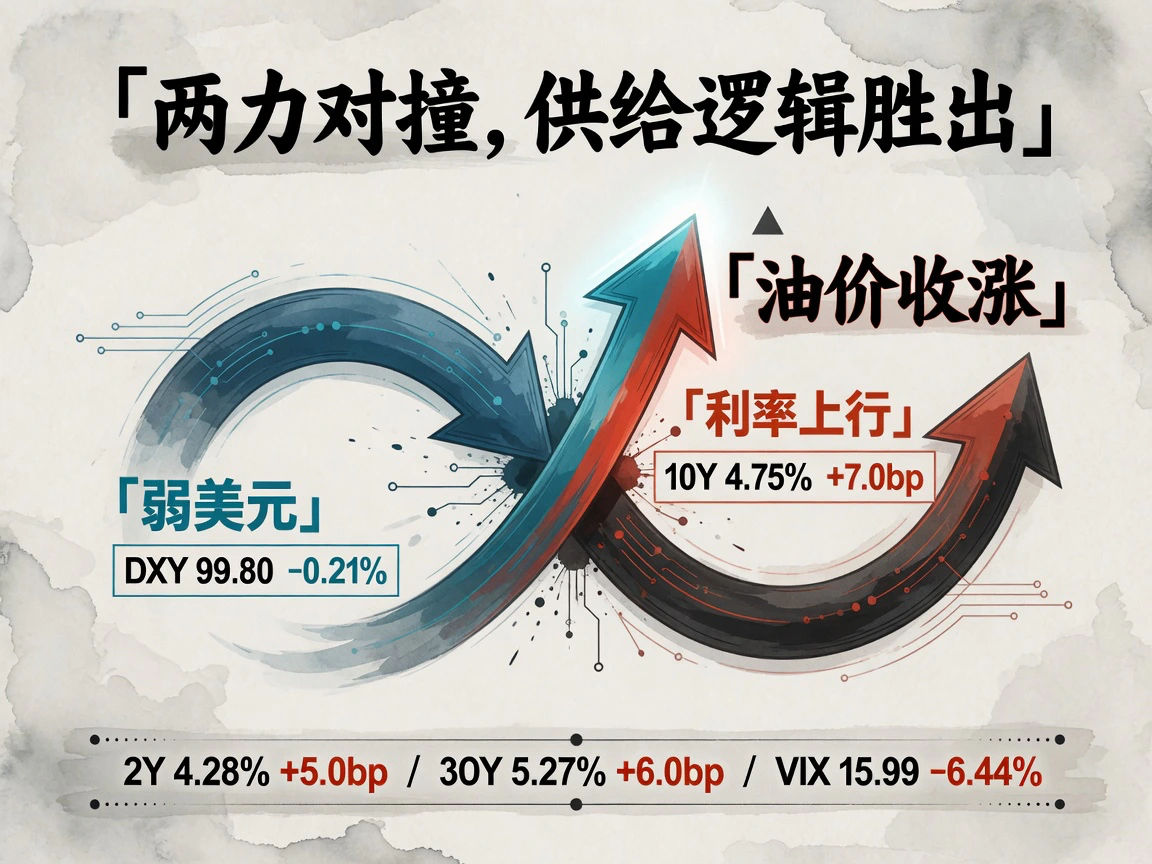
Cross-asset signals were mixed. DXY fell 0.21% to 99.80; suspected intervention and position closures ahead of a central-bank decision drove the yen up 1.91%, with USD/JPY at 160.18. A weaker dollar marginally supported dollar commodities but was not the main driver.
Treasury yields rose across the curve: 2-year +5 basis points to 4.28%; 5- and 10-year +7 to 4.45% and 4.75%; 30-year +6 to 5.27%, on the daily Treasury par curve. Higher benchmarks usually pressure commodities, but simultaneous oil gains showed near-term disruption dominating liquidity restraint. Major U.S. indices rose and VIX fell 6.44% to 15.99, indicating a supply-shortage trade rather than market-wide liquidation. Gold did not rise with oil, showing specific logistics concerns rather than indiscriminate safe-haven allocation.
Hormuz traffic stays in single digits; freight and insurance remain high
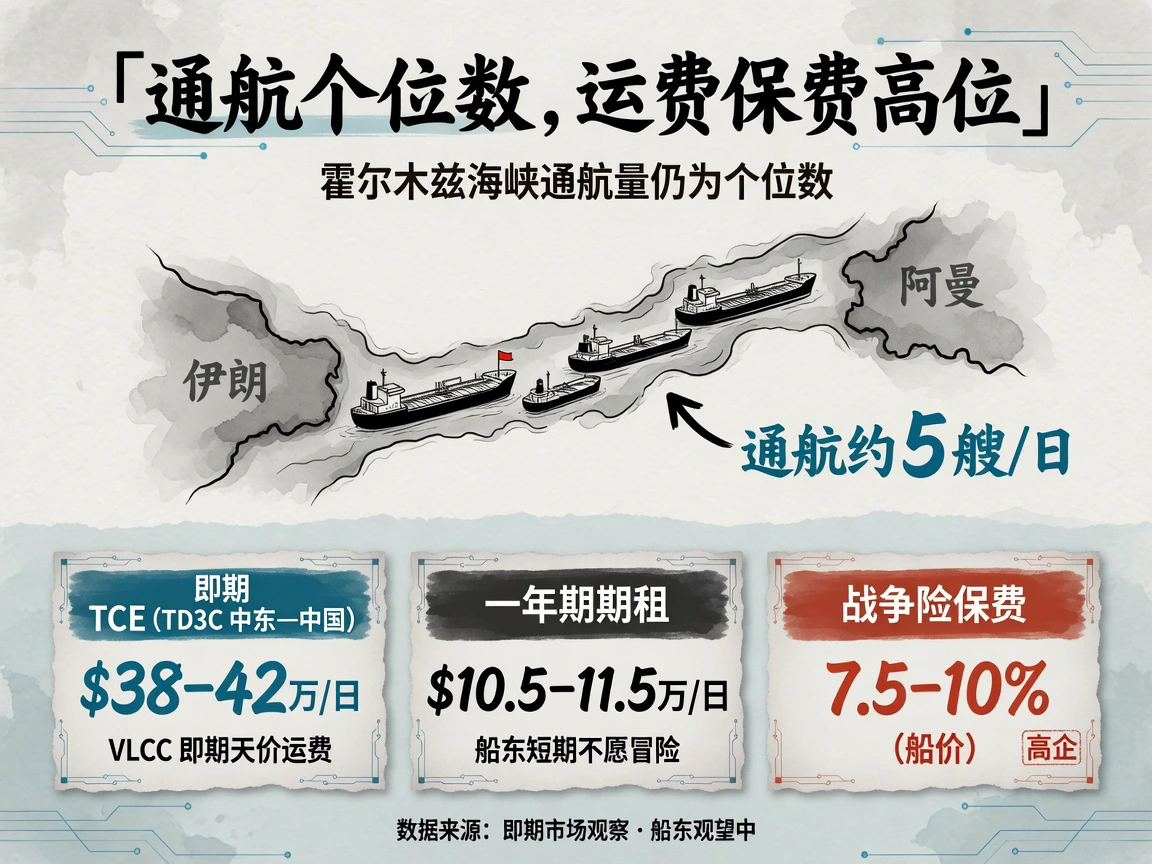
Physical Hormuz flows remained pivotal. July 31 tracking showed around five vessels all day, with some seven-day tanker averages as low as one daily, and hundreds stranded inside and outside. Risk-taking tonnage earned extreme premiums: late-July Middle East-Far East VLCC TD3C freight WS 387-404, equivalent TCE about $380,000-$420,000/day, versus one-year charters $105,000-$115,000/day. The gap implied awareness that extreme freight would not persist, but most owners still avoided returning. Hormuz war-risk premiums reached 7.5%-10% of hull value on S&P Global/Marsh measures, adding millions per voyage and breaking normal transport economics.
Red Sea spillovers intensified. Following mid-July Houthi restrictions on Saudi-linked vessels and tanker attacks, the London Joint War Committee issued JWLA-034, its 34th circular, on July 29, extending listed risk north to Jeddah and Yanbu. Yanbu war-risk rates rose from 0.25% to about 1%; southern Red Sea rates to 1%-2%, up to nearly 3% for Saudi-linked ships. North P&I would apply corresponding rates from August 7. A late-July drone attack on a merchant off Damietta, denied by Iran, raised Suez risks. Route threats are not irreversible physical closure: logistics and insurance cost surges can unwind rapidly with local easing.
Prompt markets lack products; deferred markets bet on normalized supply
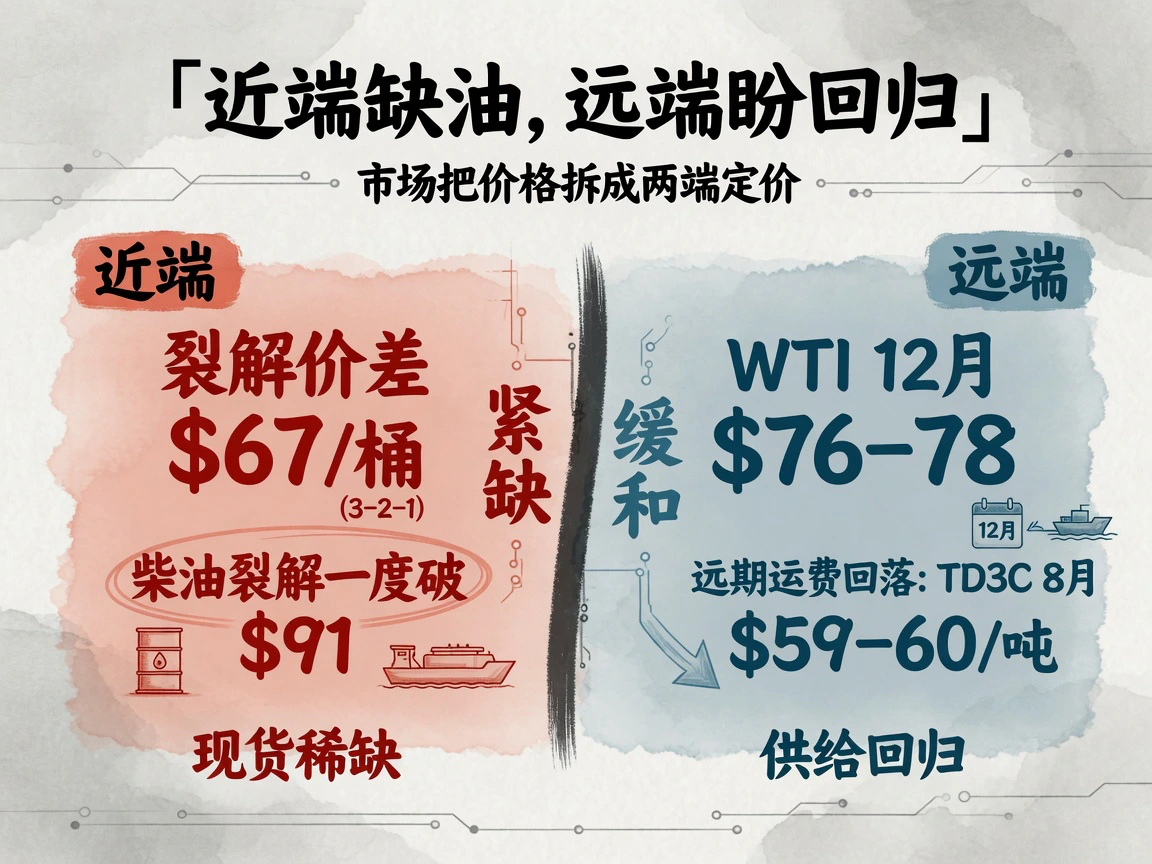
The front and back of the curve price different macro scenarios.
Prompt pricing reflects physical scarcity: falling stocks, single-digit transit and refineries unable to fill product gaps even at full load. U.S. 3-2-1 cracks were near $67/barrel July 31, after a record $69.7 in mid-July; diesel cracks briefly exceeded $91. Refinery profits, extreme cracks and deep backwardation corroborated shortages in products and immediate shipping rather than paper crude supply. U.S. gasoline stocks were at their lowest seasonal level in more than a decade, as America was forced into the role of ultimate product exporter, further draining domestic inventories.
Deferred pricing bets on normalization: December WTI $76-$78 implies much lower conflict risk months later. Freight futures likewise embed relief: TD3C spot around $78/tonne versus August $59-$60. Actual Hormuz recovery and lower war premiums would bring a shipping-cost collapse and some oil decline. A blockage at any stage would instead widen backwardation again.
Without new weekend positions, markets waited for OPEC+. Confirmation of September's +188,000 barrels/day and a later pause signal, August 5 EIA evidence of escalation, and actual transactions under Yanbu/Jeddah insurance changes effective August 7 would shape the next week's curve.


