On Tuesday, August 4, 2026, global cross-asset trading was dominated by expectations that the Strait of Hormuz would reopen. Treasury Secretary Scott Bessent told CNBC that morning that the United States and Iran had a chance of reaching an agreement today or tomorrow. Qatar, a mediator, subsequently confirmed that a draft transition plan was circulating among the parties. Oil plunged for a second consecutive day: WTI settled at $74.81 a barrel, down 6.9%, and Brent at $78.68, down 6.1%, bringing two-day losses close to 10%. Treasuries rallied across the curve, with the 10-year yield falling 7 basis points to 4.63%. In a rare joint advance by stocks and bonds, the S&P 500 closed at 7,736.52, up 1.79%, setting its first record close in about two months. The Dow Jones Industrial Average crossed 54,000 for the first time.
By the research deadline, however, the definitive agreement markets anticipated had not materialized. Iranian officials explicitly denied holding direct talks with the United States, while Qatar's foreign ministry said no face-to-face direct negotiations were scheduled. Shipping trackers still showed only single-digit daily merchant-vessel transits through Hormuz. Investors were unwinding the extreme premium previously assigned to an indefinite closure. In the physical economy, meaningful restoration of oil supply and shipping capacity remained ahead.
Treasuries: Yields fall another 5–7 basis points across the curve, led by the belly
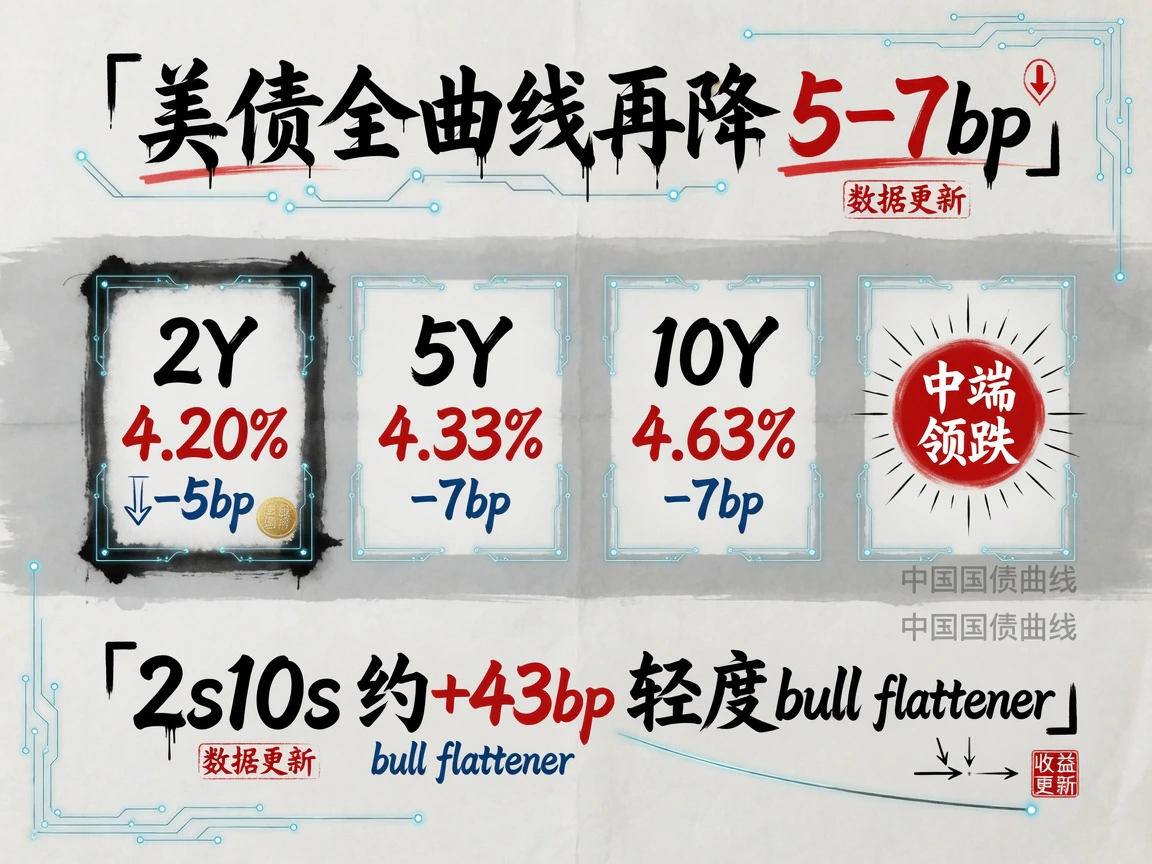
Treasury yields fell across the curve for a second session on August 4. The Treasury's official par curve, on a close-to-close basis, showed 2-year yields at 4.20%, down 5.0 basis points; 5-year at 4.33%, down 7.0; 10-year at 4.63%, down 7.0; and 30-year at 5.18%, down 5.0. The belly led the decline, with both 5- and 10-year yields down 7 basis points. The 2s10s spread narrowed from about +45 to +43 basis points, while 2s30s was broadly unchanged near +98, a mild bull flattener. From the July 31 highs, the two-day declines were about 8 basis points for 2-year yields, 12 for 10-year and 9 for 30-year. Yet the 2-year yield at 4.20% remained well above the lower end of its mid-July range: the front end was not undergoing an easing-driven decline based on rate-cut expectations.
Inflation compensation confirmed the driver. The 10-year breakeven fell 4 basis points to 2.23%, and the 5-year breakeven also fell 4 basis points to 2.19%. A 7-basis-point fall in nominal 10-year yields against a 4-basis-point decline in inflation compensation implies a roughly 3-basis-point fall in the 10-year TIPS real yield. Five-year, five-year forward inflation expectations remained at 2.27%, securely anchored above the Fed's long-run 2% target. Bond traders were removing near-term second-round inflation risk from surging oil, without questioning medium- and long-term inflation credibility.
Around 22:15 Eastern time on August 4, federal funds futures implied about a 57% probability of a 25-basis-point hike at the September 16 FOMC meeting and 43% for a hold, about 5 percentage points lower for a hike than the previous session's 62%/38% split. Hike odds remained slightly above 50%, but markets had largely unwound extreme hedges against runaway oil prices forcing emergency tightening. Philadelphia Fed President Paulson published an article supporting the previous week's hold and keeping an open mind about the path ahead. She explicitly retained higher rates or a longer period of restriction as options, offering no easing signal.
Economic data and bond supply had relatively limited market effects. June JOLTS job openings were 7.359 million, slightly below the 7.4 million forecast, a secondary catalyst. Treasury borrowing was concentrated in T-bills, without a duration-supply shock at the long end. Falling intermediate and long benchmark yields supported duration returns on dollar investment-grade (IG) bonds. High-precision real-time August 4 high-yield (HY) and IG spread data were unavailable; the latest verifiable levels were 2.78% and 0.78% on August 3. Further data were needed to confirm incremental spread changes.
Liquidity monitoring before the deadline, around 10:31 Beijing time on August 5, showed the active 10-year Treasury futures contract (ZN) at 108.984, the 30-year (ZB) at 110.313 and the 5-year (ZF) at 106.586. All remained close to the reviewed session's settlement levels, with no stampede out of long-duration positions in early Asian trading. CNBC's late cash quotes at 22:30–22:40 Eastern time on August 4 showed 2-year yields at 4.187% and 10-year at 4.599%, a calm continuation after regular hours. Major Asian-session information terminals generally showed the cash 10-year trading at 4.60%–4.63%.
Equities: S&P 500 and Dow records, followed by a turn in the AI earnings story
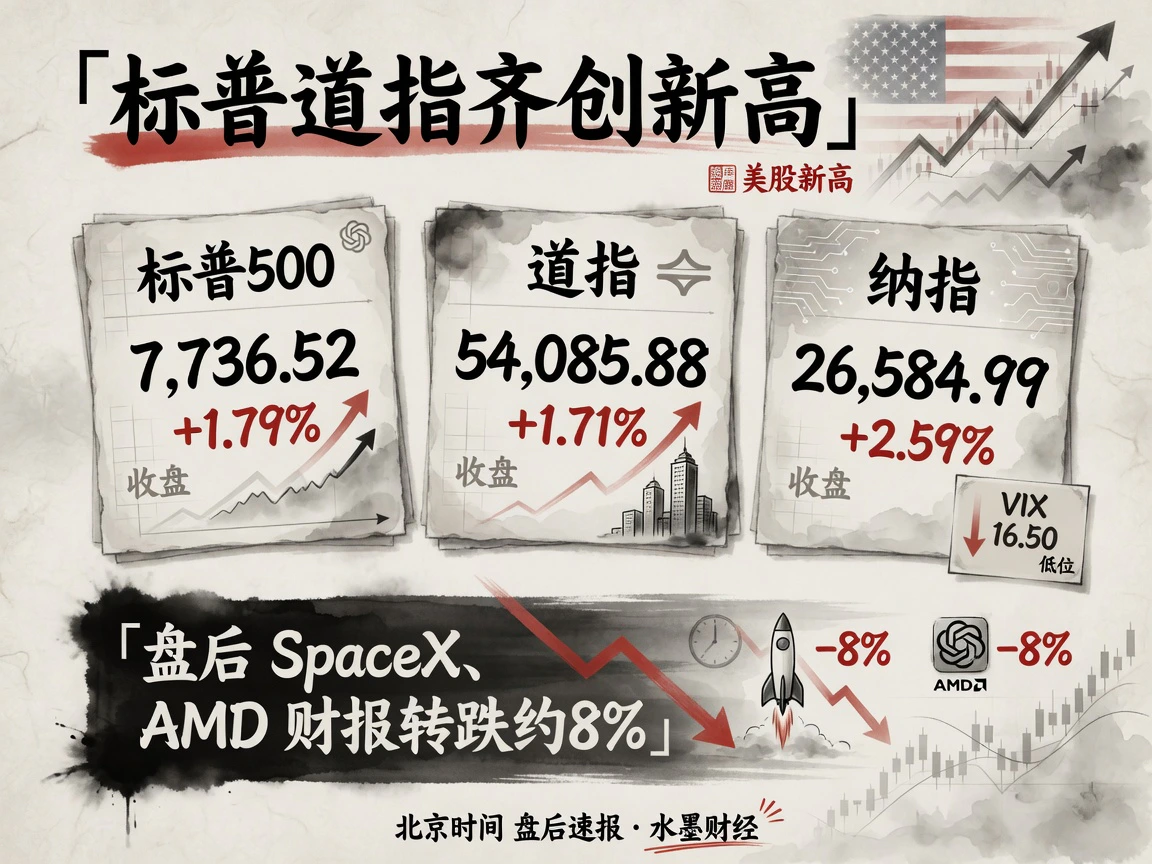
The main U.S. indexes finished Tuesday near historic highs. The S&P 500 rose 1.79% to 7,736.52, its first record close in about two months and largest daily gain since April. The Dow gained 1.71%, or 907 points, to 54,085.88, closing above 54,000 for the first time and posting a second consecutive record close. The Nasdaq climbed 2.59% to 26,584.99, only about 2% below its early-June peak. The Russell 2000 rose 1.85% to 3,036.98. Volatility was the unusual feature: the VIX reached 16.50, edging about 4% higher despite the equity surge. Investors chased high beta while retaining downside tail hedges against Middle East developments and a buy-the-rumor, sell-the-fact reversal.
Large technology stocks dominated. Palantir surged about 29% after sharply beating estimates and raising full-year guidance, with revenue up about 93% year on year. Caterpillar gained about 5.5%, reporting quarterly revenue above $20 billion for the first time; management identified data-center power infrastructure and related equipment orders as the growth driver. Semiconductors and hardware rallied broadly: Broadcom rose 6.6%, Micron 7.6%, Intel about 10.8%, Marvell about 13% and Nvidia 2.6%. The S&P information technology sector gained about 4.1%, leading all 11 sectors. Chipotle fell about 9.7% on food-safety concerns. Earnings provided a firm base for the records: by July 31, about 61% of S&P 500 constituents had reported second-quarter results, roughly 86% had beaten EPS estimates and year-on-year profit growth was approaching 50%.
Asia-Pacific markets did not mirror Wall Street completely. Hong Kong's Hang Seng closed at 25,852.92, down 0.60%, ending six consecutive gains as technology and financial heavyweights saw profit-taking. The Nikkei 225 finished near 63,957, up about 0.3%. South Korea's KOSPI closed around 6,359, up about 1.6%, showing the strongest upside response alongside the global semiconductor recovery.
After the U.S. close, two major earnings releases quickly shifted attention from the strength of AI demand to who would pay for enormous capital expenditure.
SpaceX, which completed the largest IPO in history in June, released its first quarterly report as a public company. Revenue of about $7.8 billion, up roughly 92% year on year, beat expectations, and the net loss was less severe than pessimistic estimates. Yet quarterly capital spending reached about $18.4 billion, including roughly $16 billion on AI and computing clusters. After rising about 9% in regular trading, the shares fell 7%–8% after hours.
AMD beat estimates with adjusted second-quarter EPS of $1.66 and revenue of $11.54 billion, up about 50%. Data-center revenue jumped about 107%, but third-quarter revenue guidance of roughly $13 billion offered little additional upside surprise. The shares fell 8%–10% after hours.
Before the deadline, around 10:22–10:27 Beijing time, the Nikkei 225 had risen to about 65,929, roughly 3% above its August 4 close; the KOSPI approached 6,600, up about 3.5%; and the Hang Seng was broadly flat near 25,881. Semiconductor-heavy Japan and Korea reacted far more strongly than Hong Kong to Wall Street's overnight records. USD/JPY was around 157.4, with the yen still much stronger than near 163 before coordinated official intervention in late July. Risk appetite temporarily dampened currency volatility.
Commodities: Oil falls and gold rises as premiums unwind
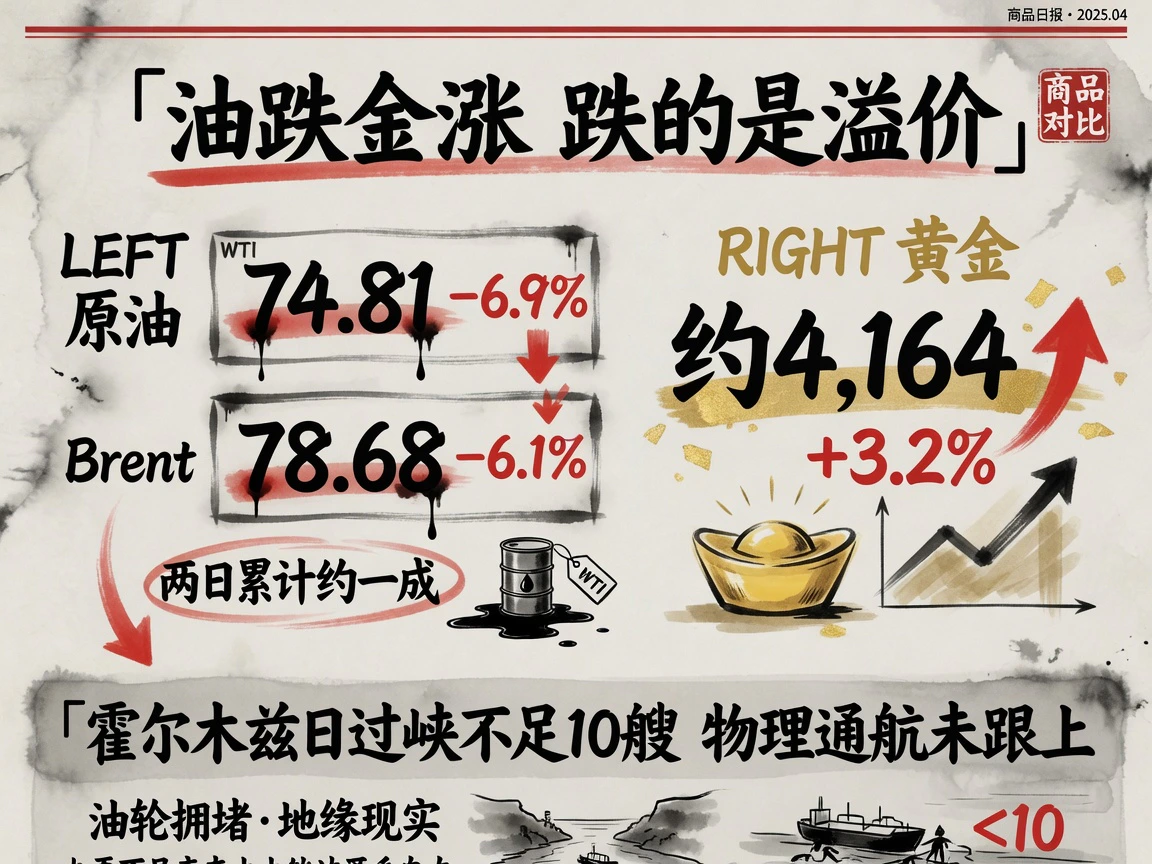
Oil plunged for a second session as previously accumulated geopolitical premiums were sold aggressively. Benchmark continuous contracts showed WTI at $74.81 a barrel, down 6.9%, and Brent at $78.68, down 6.1%. Media reports of nearby contract settlements were approximately $75.8 for WTI, down 5.7%, and $79.4 for Brent, down 5.3%. The two measures differed by about $1 but followed the same trajectory; this article uses continuous contracts. The immediate drivers were Bessent's today-or-tomorrow agreement timetable and Qatar's confirmation that a draft transition plan was circulating. U.S. commercial inventories and similar fundamentals were not the catalyst.
Physical shipping constraints had not materially eased. Maritime tracking still showed fewer than 10 merchant vessels passing Hormuz each day, including only a handful of commercial crude tankers, far below pre-conflict capacity. In normal conditions, around 20 million barrels a day of crude and petroleum products pass through the strait, about one-quarter of global seaborne oil trade under the EIA definition. With daily transits still frozen in single digits, oil's nearly 10% two-day fall mainly reflected speculative capital unwinding geopolitical optionality in advance. Physical supply-chain repair remained an expectation. Calendar spreads still showed backwardation, with nearby crude above deferred contracts. The near-term price collapse signaled fading extreme fear, rather than a transition to the oversupplied contango structure. The oil feature examines the full forward curve and crack spreads.
Precious metals rallied independently of oil. COMEX continuous gold gained about 3.2% to $4,164 an ounce, alongside the equity surge. Several forces combined: falling oil reduced inflation and hike expectations; lower nominal Treasury yields reduced the carrying cost of a non-yielding asset; and the Middle East settlement remained unresolved. The dollar index edged lower to 99.84. The unusual combination of lower oil, higher gold, stronger stocks and stronger bonds showed investors removing oil's macro-inflation shock while keeping defenses in place. Gold's strength still included a tail-risk premium against the collapse of a strait agreement or renewed conflict escalation.
Macro and policy: Softer data, unchanged policy anchors
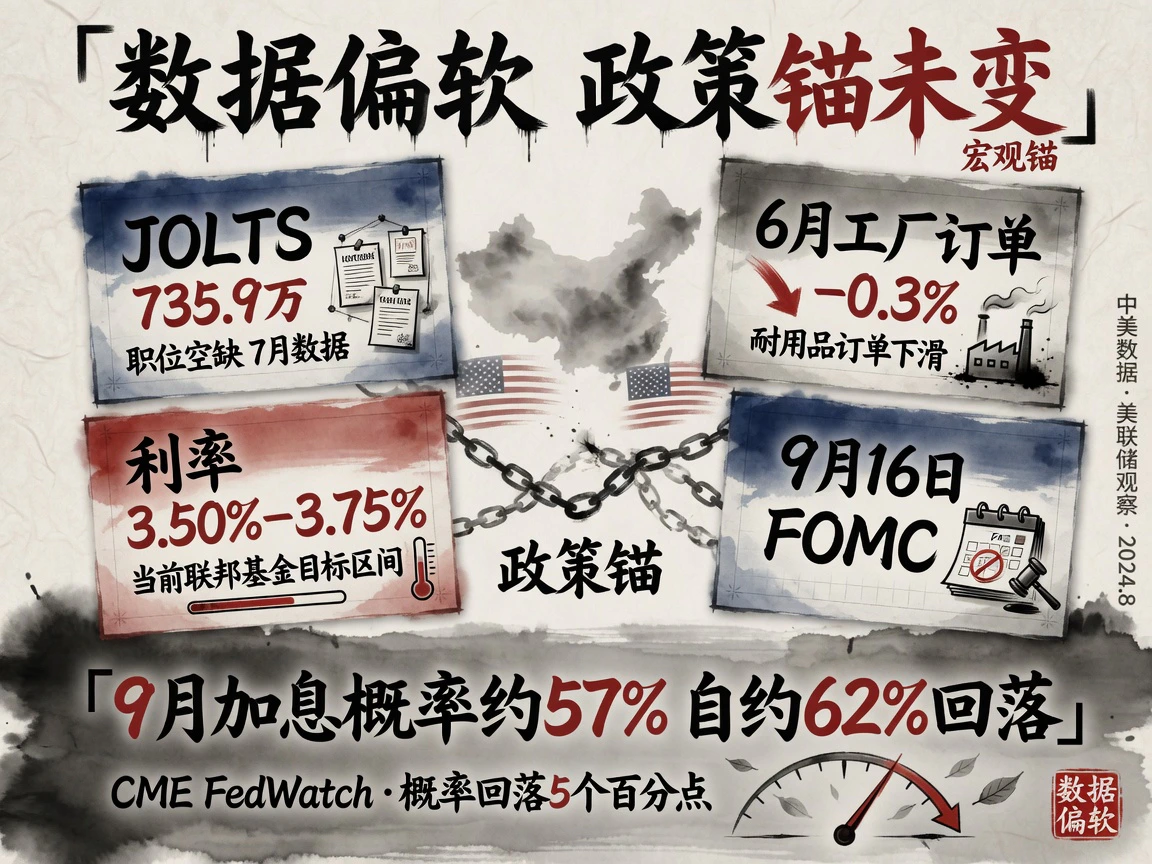
U.S. data released August 4 were marginally soft, but oil and geopolitics eclipsed their market effect. The BLS reported June JOLTS openings of 7.359 million, below the 7.4 million forecast; May was revised from 7.711 million to 7.537 million. The vacancy rate was 4.4%. Hiring and voluntary quits were broadly steady, and the decline in openings centered on services such as health care and leisure and accommodation, without a spread in layoffs. This reinforced an orderly cooling from elevated levels, with low hiring and low firing. The Commerce Department reported that June factory orders fell 0.3% month on month, versus expectations of a 0.2%–0.4% increase, their second consecutive contraction. But unfilled orders rose 0.6%, while final core capital goods orders, nondefense excluding aircraft, were revised up to about +1.2%. This was consistent with Monday's strong ISM manufacturing reading of 55.6, suggesting AI- and advanced-manufacturing-led equipment investment remained intact. The June goods and services trade deficit narrowed to about $73.3 billion, with the previous figure revised from $75.1 billion to $77.6 billion, marginally reducing net exports' drag on real GDP.
The monetary anchor was unchanged: the federal funds target range remained 3.50%–3.75%. At the FOMC meeting ending July 29, the Fed voted 9–3 to hold, with three members favoring a 25-basis-point hike. This was the fifth consecutive hold following Kevin Warsh's arrival as chair. There is no scheduled rate decision in August; the next key meeting is September 16. The late-August Jackson Hole gathering is the most important forward-guidance communication window.
No voting member or senior official delivered remarks during the research window that materially changed the expected rate path. Governor Lisa Cook was due to speak at 16:05 Eastern time on August 5, after the deadline. Futures showed September hike odds falling from about 62% to 57%. Markets were removing the extreme probability of a second energy shock forcing emergency September tightening, without establishing a baseline for rate cuts.
Geopolitics: A 48-hour timetable, while physical traffic lags
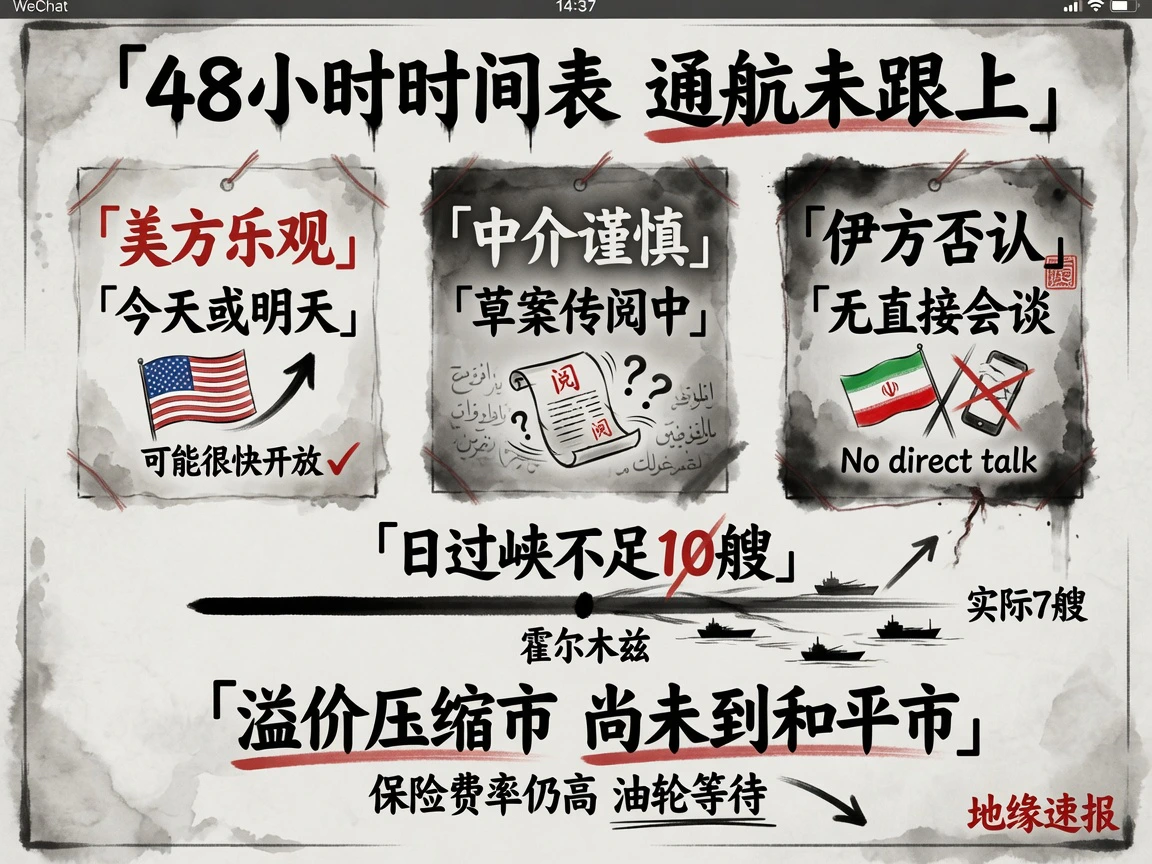
On August 4, markets' central wager was that the timetable for reopening Hormuz had been compressed into 48 hours, yet physical shipping showed no material improvement. Statements revealed three distinct levels of optimism.
First, strong unilateral U.S. optimism: Bessent said an agreement could come today or tomorrow, while Secretary of State Rubio said closed-door Oman–Iran consultations had made positive progress but had not finalized a text.
Second, mediators' practical caution: Qatar's foreign ministry said a draft transition agreement was circulating and mediation was at a very advanced stage, but immediately stressed that no face-to-face direct talks were scheduled.
Third, Iran's denial and conflicting position: its foreign ministry clarified that Tehran was not holding direct negotiations with the United States, but was discussing with Oman a temporary safe corridor lasting up to about three months. More fundamentally, some hardline Iranian officials still demanded jurisdiction and inspection rights over vessels entering the Gulf, directly conflicting with the U.S. demand for unconditional freedom of navigation.
Conditions on the ground remained difficult. The U.S. blockade of Iranian ports and coastal areas was still being strictly enforced. By August 3, CENTCOM said it had redirected 44 merchant ships, disabled 2 and boarded 2. UK Maritime Trade Operations (UKMTO) reported that an unidentified projectile hit a cargo ship near Hormuz on the night of August 3, with the incident still under investigation. Satellite shipping data showed fewer than 10 daily merchant transits, a factual gap with Bessent's statement that many vessels were already passing through.
Cross-asset prices supplied the verdict. The aggressive U.S. timetable triggered a two-day oil rout and helped U.S. stocks set records. But the VIX's contrary rise and gold's strong rally showed a sharp compression of geopolitical premiums, rather than pricing that peace had arrived. Companion article 1 covers the previous 24 hours on the front line; companion article 2 examines global oil supply and demand and the forward curve.


