Around July 31, 2026, the US 30-year Treasury yield surged toward 5.28%, near the highest levels since the 2007 subprime crisis, while the 10-year reached about 4.75%. In early August, tentative geopolitical easing and improved liquidity brought some retracement, but the 30-year remained around 5.19% and the 10-year 4.63%. Occasional declines had not returned the ultra-long curve to its old comfort zone; yields remained firmly at exceptionally high historical percentiles.
While policy rates held at meetings, long yields independently delivered a powerful tightening. The divergence cannot be explained by a single day's sentiment; it reflects a generational change in the foundations of dollar-asset pricing.
What makes 5.2% expensive?

A 30-year yield above 5.2% is remembered as a symbolic threshold. Across the capital cycle it contains three deeper changes:
First, the historical coordinates of risk-free assets have shifted fundamentally.
Since the 2008 subprime crisis, global investors grew accustomed to low yield centers, low volatility and calming central-bank communication. A 30-year yield above 5% pulls the global risk-free benchmark back toward the precrisis norm of expensive real capital. Mortgage rates rise, long-horizon infrastructure return hurdles increase, life insurers and pensions face greater duration-rematching pressure, and private-equity and venture-capital terminal discount rates are repriced.
Second, the long-end surge is more than mechanical extrapolation of short-rate expectations.
A simple delayed-Fed-cuts trade usually produces bear flattening dominated by a larger short-end yield move. In July, the two-year rose nearly 40 basis points and the 30-year about 31. Their simultaneous surge reflected not only near-term policy recalibration but renewed compensation for medium-term inflation uncertainty, fiscal sustainability and term risk. Invalidated cut bets alone cannot explain it.
Third, high yields have proved very sticky downward.
Early-August Middle East easing and joint US–Japan yen intervention temporarily reduced the tail risk of disorderly official Treasury sales to fund FX intervention. Risk and liquidity concerns eased and bonds recovered, yet the 30-year yield fell only about 9 basis points versus 14 for the two-year. Ultra-long assets are more sensitive to fiscal supply, volatility and long-run sovereign premiums; once yields rise, more demanding macro conditions must be met to bring them down.
Ultimately, 5.2% is not an accidental derivatives stop-loss cascade but a clear dividing line: long-term capital has become expensive again, ending the era of cheap, unlimited duration expansion.
What the curve is saying
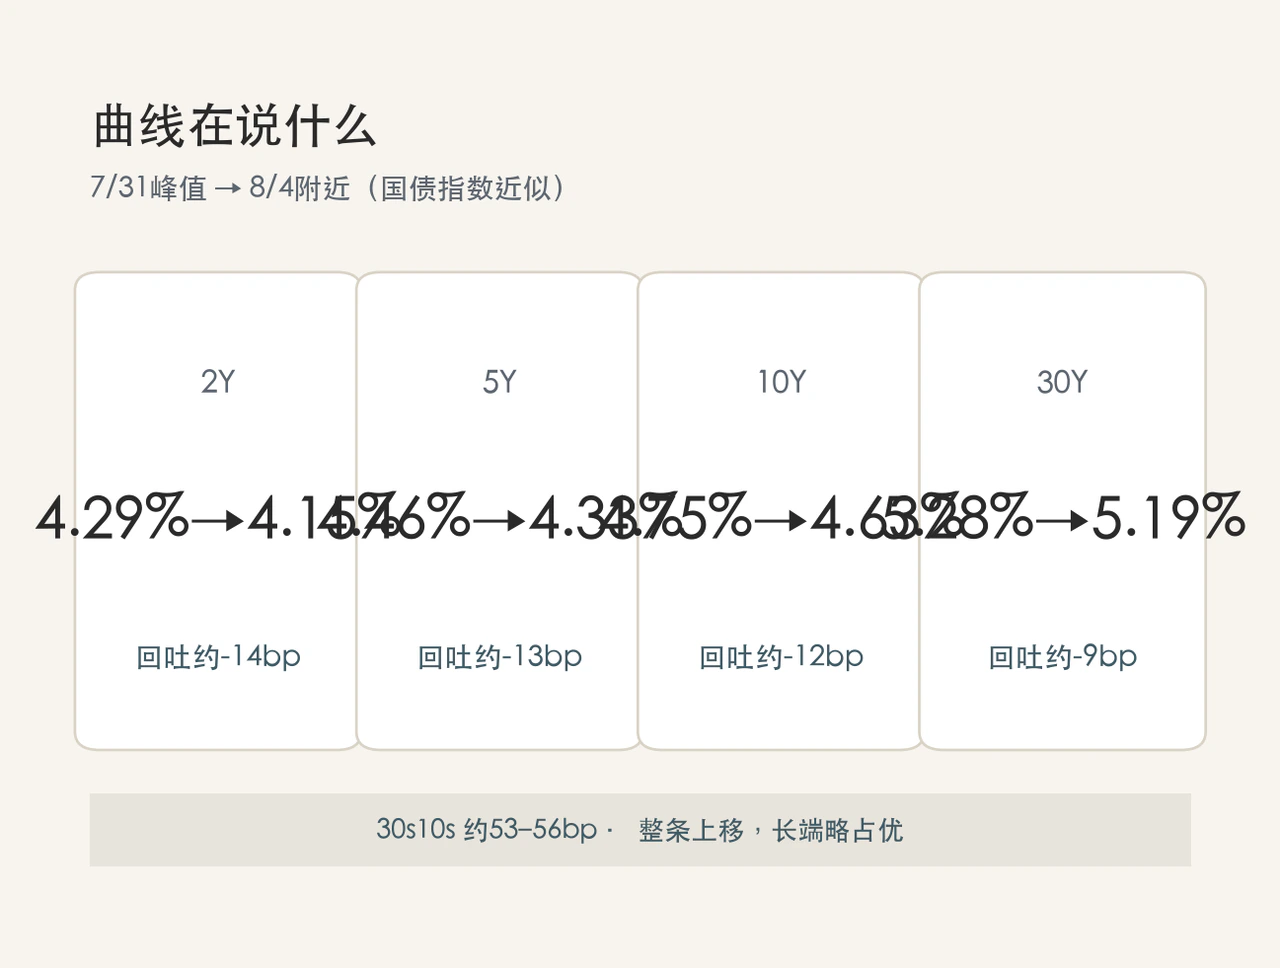
Changes from late July to early August clarify positioning. Figures use commonly quoted Treasury indices and may differ slightly across traded prices:
| Maturity | Peak near July 31 | Around August 4 | Retreat after peak | Structural feature |
|---|---|---|---|---|
| 2-year | About 4.29% | About 4.15% | About −14 bp | Rapid bond recovery alongside Middle East easing and intervention expectations |
| 5-year | About 4.46% | About 4.33% | About −13 bp | Central transmission point for macro expectations |
| 10-year | About 4.75% | About 4.63% | About −12 bp | Slow retreat in the core pricing benchmark |
| 30-year | About 5.28% | About 5.19% | About −9 bp | Strong resistance to lower yields; pronounced high-level persistence |
| 30Y - 10Y | About 53 bp | About 56 bp | Slight steepening (+3 bp) | Term spread remains elevated |
The 30-year/10-year spread stayed broadly within 50–60 basis points. This was neither extreme bear steepening from an overheating-driven long-bond selloff nor recessionary bull steepening after sharp cuts. The whole curve shifted higher, with the ultra-long end more stubbornly burdened by supply and premiums.
For tactical traders, an all-in mean-reversion bet above 5.2% offers asymmetric odds and payoff: one or two weak auctions can revive upward-yield convexity risk. Strategic allocators must move beyond betting on a single number of Fed cuts toward systematic rebalancing for higher yield centers and persistently greater volatility.
Decomposing nominal long yields: policy, inflation, term premium and microstructure

A conventional fixed-income framework separates four drivers: expected policy, inflation and energy premiums, term compensation, and trading microstructure.
First, policy-path and neutral-rate expectations are being rebuilt.
The July 29 FOMC held 3.50%–3.75% and exposed unusual differences over sufficient tightening and retaining hikes. Markets revised aggressive easing assumptions. Rising two-year yields showed the short nominal anchor itself shifting higher, underpinning the long end.
Second, geopolitical conflict and energy create a structural inflation premium.
Persistent Hormuz disruption turns oil from a manufacturing-cycle variable into an institutional supply-disruption risk. Even if base effects moderate core inflation, renewed headline inflation and its risk premium support high nominal long yields. Early-August ceasefire rumors and falling oil therefore immediately sparked long-bond recovery.
Third, term premiums have decisively reawakened.
ACM and Kim–Wright model estimates differ, but point in the same direction: 10-year premiums have left QE-era negative territory for a clearly positive 0.8%–1.3% range. Drivers include expanding federal deficits and issuance, official reserve diversification amid fragmentation, greater macro uncertainty, and private demand such as trillion-dollar AI infrastructure competing with governments for long-term funds.
Fourth, market microstructure and deleveraging.
Near psychological yield thresholds, auction tails, forced primary-dealer absorption and rapid unwinding of futures basis trades can cause liquidity shortages and overshooting. Late July's peak showed ultra-long bonds leading a volatile selloff without broad disorderly panic in equities, a distinct rate-market micro-liquidity shock.
The breakout combines neutral-rate narratives, energy geopolitics, deficits and term premiums, and auction/positioning mechanics. Late July's final push added policy disagreement and renewed inflation uncertainty.
Two peaks compared: May and July
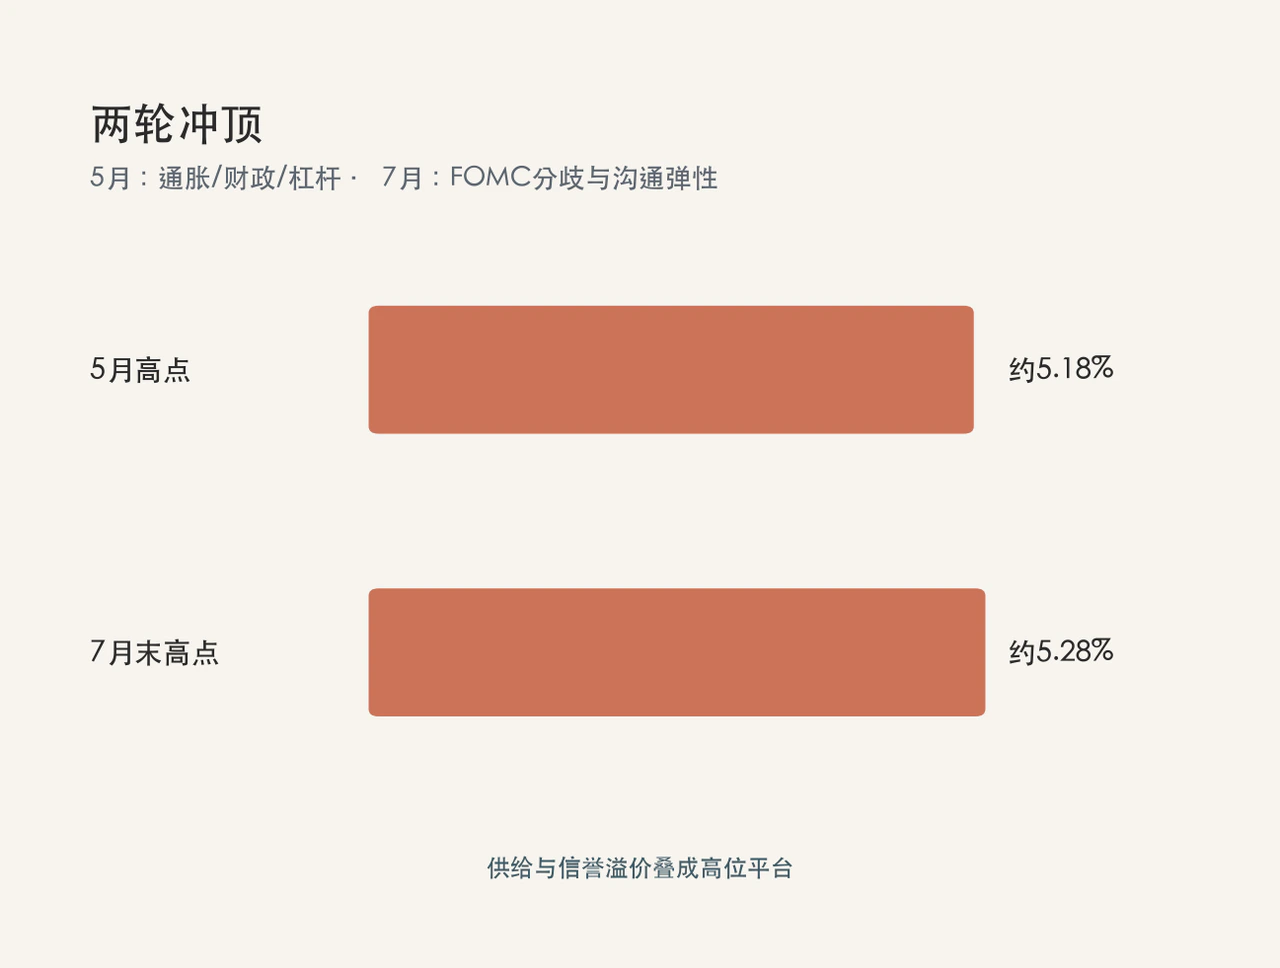
High long yields were not a one-day event but a plateau built by at least two shocks.
May's first peak took the 30-year near 5.18%. Persistent inflation, a larger quarterly refunding supply plan (QRA) and hedge-fund basis unwinds produced a synchronized global sovereign long-bond selloff. It cleared out assumptions of low inflation and low fiscal supply.
Late July's second peak raised the ceiling to 5.28%. Compared with May, July catalysts were more concentrated: disagreement behind the FOMC hold, renewed Middle East premiums and a new leadership communication style favoring market-led pricing over early forward guidance. To some extent policymakers tolerated higher long yields as a way to tighten financial conditions without direct hikes.
Comparing the two shocks:
- Shared core: enormous fiscal supply, medium-term inflation uncertainty and policy-credibility premiums jointly demand higher risk returns;
- Incremental change: July added volatility flexibility from changed central-bank communication. Markets began recognizing that the Fed was no longer the ultimate put on long-bond volatility; prices had to clear on supply and demand.
Rewriting dollar and global capital flows

Long Treasuries are global collateral and risk-free anchors, not merely US borrowing costs. Their movement is reshaping risk and returns across dollar funding.
The dollar: yield advantage versus credit erosion.
High short rates usually support the dollar, but when long yields reflect fiscal concerns and official rebalancing, sovereign-credit doubts conflict with rate differentials. The result is wide swings and high FX volatility rather than a smooth dollar bull market.
US–Japan monetary cooperation: FX relief creates bond-market breathing room.
One deeper objective of joint early-August yen intervention was to prevent yen instability forcing Japanese institutions into disorderly Treasury sales to fund intervention. This rare cross-market response showed soaring ultra-long yields nearing major allies' and official holders' tolerance limits.
Risk assets and credit: greater divergence and duration pressure.
Higher discount rates constrain expensive long-duration technology assets. Strong cash flows and capital-spending feedback at AI giants partly offset that pressure, moving stock–bond correlation away from historical norms. Traditional credit is more exposed: investment-grade dollar bonds lose NAV through Treasury beta; high yield and emerging-market dollar debt face surging funding costs and approaching refinancing walls.
Reassessing capital scarcity.
Leading macro allocators increasingly view trillion-dollar AI infrastructure, de-risked global energy supply chains and major powers' fiscal/defense deficits together. Three huge demands compete for limited long-term real capital. The dollar system remains the pricing center, but its price is a full step higher than in the preceding decade.
What to watch: indicators and response framework

Over the next one to three months, a rapid, smooth return to old yield norms is unrealistic. A more reasonable baseline is frequent 30-year fluctuations within 5.0%–5.4%. A sustained break below 5.0% requires both a lower geopolitical energy-price center and stabilization in issuance and central-bank credibility.
Six forward-looking indicators deserve attention:
- Hormuz passage, spot oil and shipping-insurance premiums—the fastest macro switch affecting the long-end inflation premium;
- The relative slope between two- and 30-year yields—joint increases suggest policy/premium interaction; a stationary short end with rising long yields warns of fiscal supply and deficit premiums;
- Coupon-auction tails and indirect-bidder shares—at high yields, genuine overseas demand and dealer capacity provide early liquidity-risk signals;
- Foreign official holdings in Fed custody and term-premium proxies—slow, lagged measures that directly shape the floor of long yields;
- Jackson Hole and the chair's communication framework—whether officials allow autonomous long-end clearing or verbally resist disorderly excessive tightening;
- The dollar index and dollar–yen proximity to intervention thresholds—relevant to whether official holders must again liquidate Treasuries.
Three practical portfolio principles follow:
- Duration: avoid heroic one-way longs at emotional thresholds and accept a higher yield center;
- Curve strategies: emphasize structural relative value, such as intermediate versus ultra-long allocation and hedged spreads after stripping rate beta, rather than outright direction;
- Credit and offshore dollar bonds: apply rigorous issuer-level diligence to Asian and emerging-market debt, emphasizing foreign-currency refinancing and domestic funding access rather than one-size-fits-all Treasury beta.
The move to roughly 20-year highs imposes a clear constraint: risk-free assets are demanding renewed excess compensation, discount-rate centers across dollar assets must rise systematically, and volatility insurance is no longer free. Short-term trading can swing either way, but deficits, inflation resilience and trust in the central bank will determine the new pricing equilibrium.


