Negotiations over temporary passage through Hormuz were overwhelming conventional supply-and-demand fundamentals as the crude market's central pricing anchor.
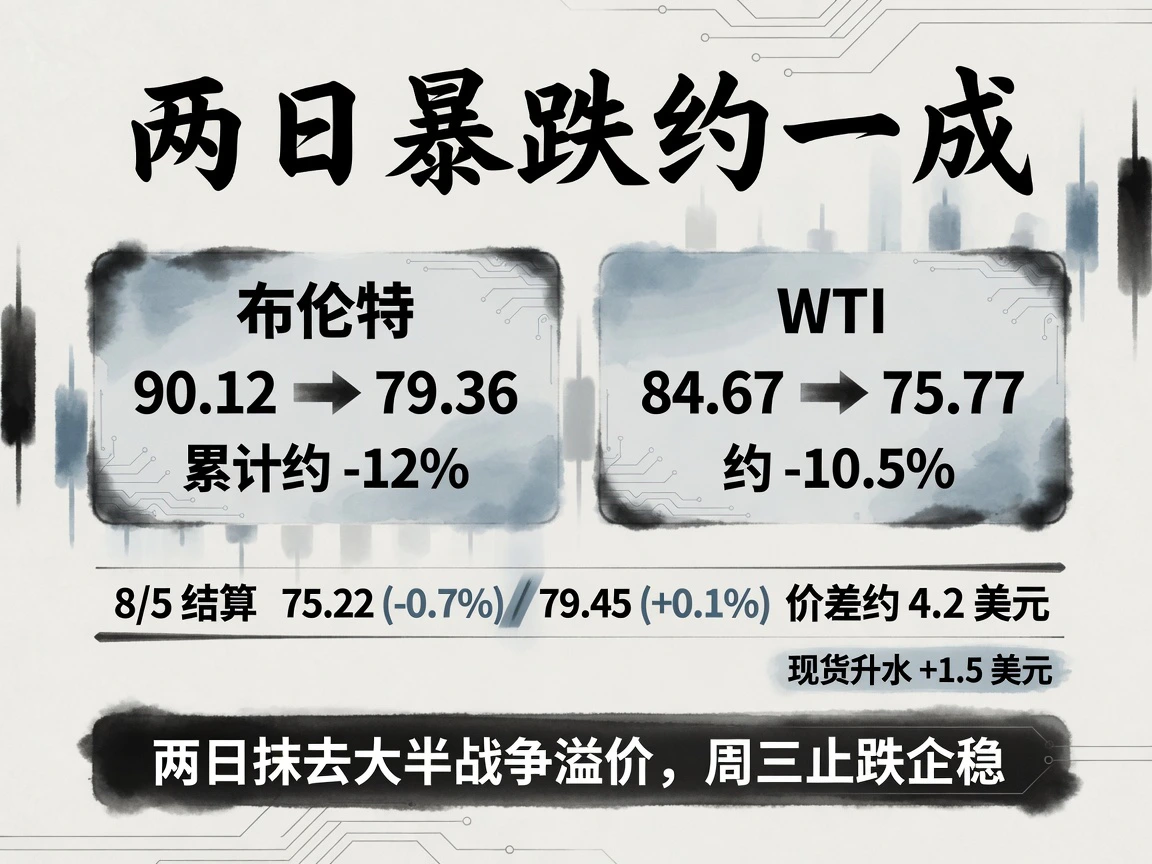
Heavy selling on August 3 and 4 removed most of the geopolitical premium accumulated in late July. By Wednesday August 5, the plunge finally paused: September WTI settled at $75.22 a barrel, down $0.55 (-0.7%), while prompt Brent edged up $0.09 (+0.1%) to $79.45. The Brent–WTI spread stayed around $4.2. Energy desks waited for the same event: an Iranian–Omani joint reopening statement.
Two-day fall exceeds 10%; Wednesday settlements begin stabilizing
The retreat was severe. From July 31's $90.12, Brent fell around 7% on August 3 and another 5.3% on August 4, touching $79.36 intraday, nearly 12% lower in two days. WTI fell from $84.67 to $75.77 over the same period, about 10.5%.
The scale reflected the steep geopolitical premium already embedded. After late-February U.S.–Iran escalation, the Revolutionary Guard effectively blocked Hormuz and Brent exceeded $100 at the conflict's extremes. Temporary arrangements attempted in April and June failed to last, leaving flows at only 10%–20% of prewar levels. This narrow waterway normally carries nearly one-fifth of global seaborne crude trade, supporting a thick premium. Once mediation showed a material opening, crowded longs exiting and new short selling reinforced a sharp profit-taking reversal.
At the August 6 08:45 Beijing-time Asia-Pacific electronic snapshot, WTI was $74.94 and Brent $79.34, slightly lower in narrow, thin trading. Participants were strongly inclined to wait for official statements.
The curve mattered especially. Brent remained backwardated, with a front/second-month spread near +$1.5 and a 12-month spread around +$7. Physical constraints were far from removed; the curve had only moderated from extreme tightness. Traders had cut the most speculative sentiment premium without fully pricing freely moving tankers.
EIA reports an unexpected crude build as the OPEC+ voluntary-cut unwind concludes

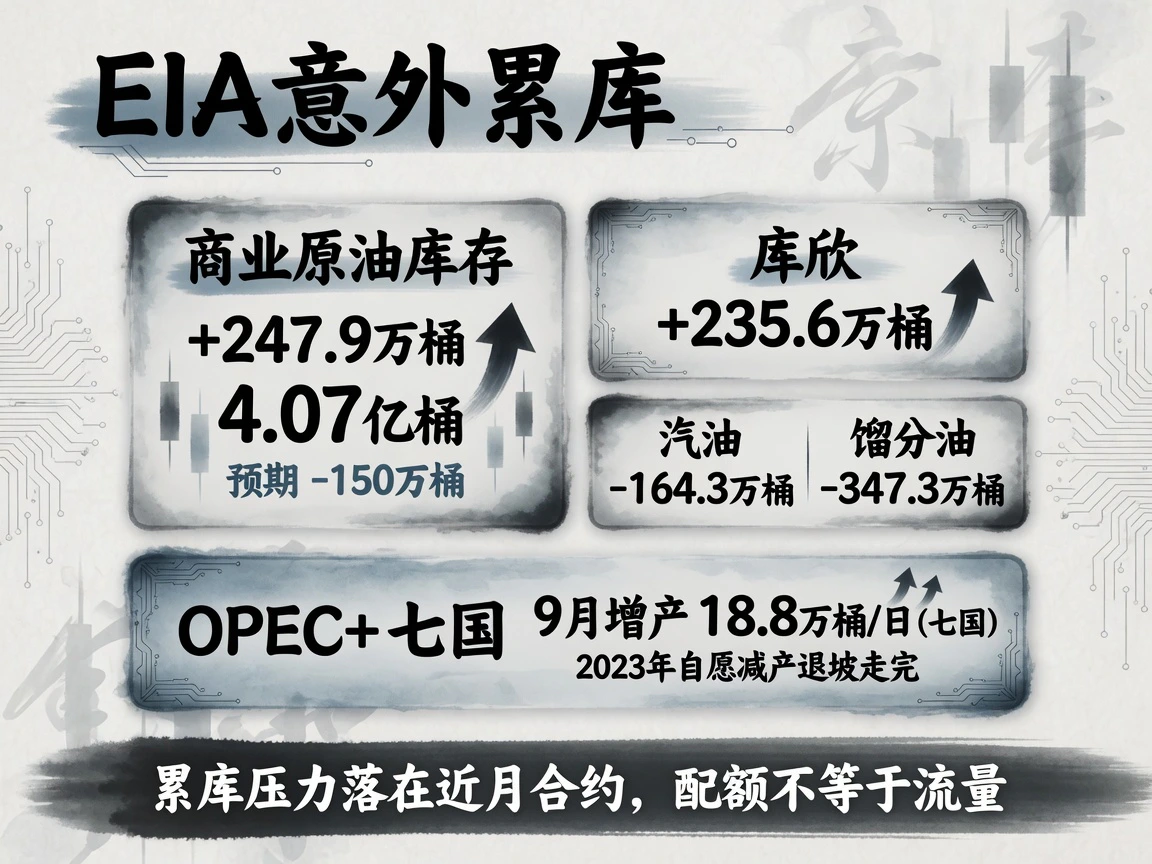
On August 5, the latest EIA report for the week ended July 31 delivered bearish inventories. Commercial crude rose 2.479 million barrels to 407 million, against an expected draw of 1.5 million barrels. Cushing stocks rose sharply by 2.356 million barrels to 20.955 million.
Products remained tight: gasoline fell 1.643 million barrels and distillates 3.473 million, leaving them about 7% and 12% below their respective five-year averages. Utilization slipped 0.2 percentage point to 96.5%, still near full summer operation. Daily crude imports rose 515,000 barrels. Four-week total U.S. product demand was 20.4 million barrels a day, down 0.9% annually. The unexpected crude build mainly pressured prompt contracts, helping explain WTI's relative weakness.
Another institutional supply change came on August 2, when Saudi Arabia, Russia, Iraq, Kuwait, Kazakhstan, Algeria and Oman approved a 188,000-barrel-a-day September increase, completing the gradual reversal of roughly 1.65 million barrels a day of voluntary cuts announced in April 2023. Those cuts began in May 2023, were extended repeatedly and briefly paused their unwind early in 2026 amid instability. The UAE's May departure reduced participants from eight to seven. A separate regular cut of roughly 2 million barrels a day dating to October 2022 would remain through year-end, with the September 6 meeting to discuss the fourth quarter.
Paper quotas could not simply be equated with actual seaborne flow. As long as Gulf chokepoints remained geopolitically constrained, the conversion of planned production into physical circulation remained highly uncertain.
Oil and gold diverge sharply; macro liquidity did not drive the plunge
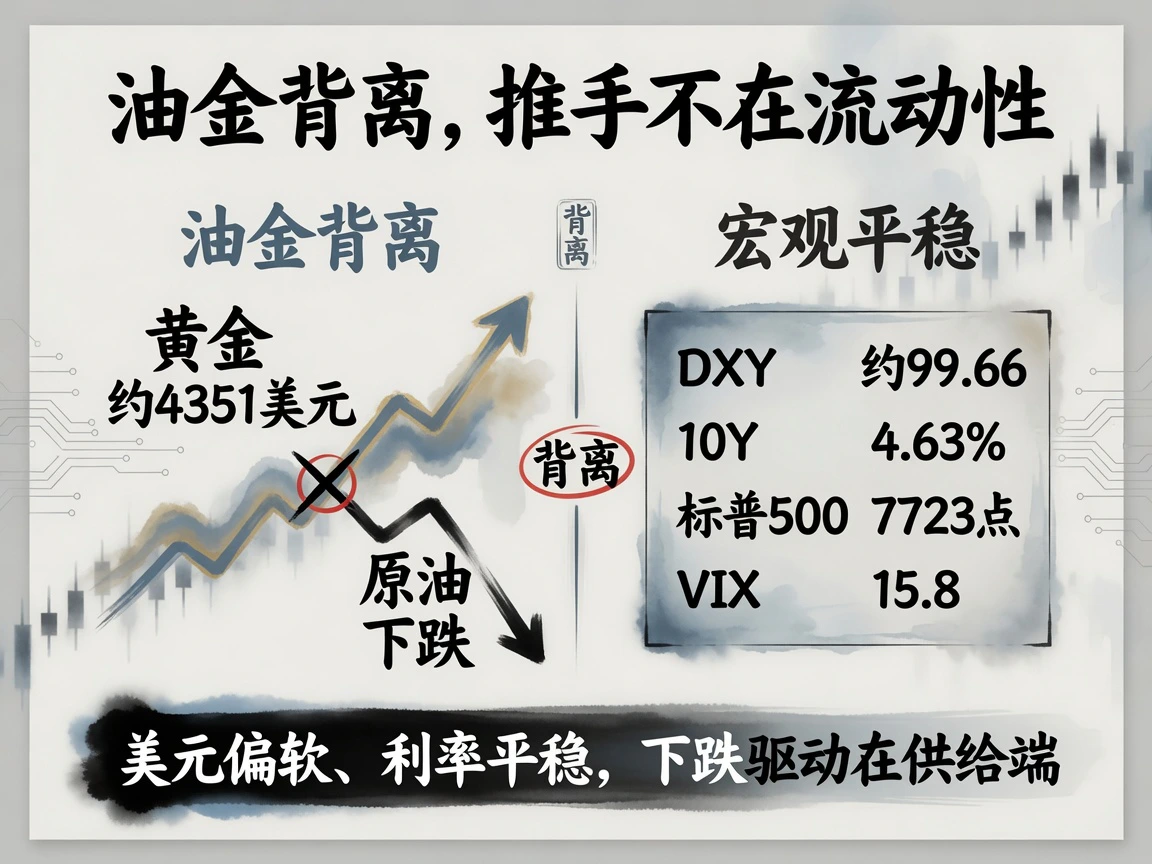
The broader financial environment added no significant commodity restraint. DXY was around 99.66 at the cutoff versus 99.89 previously. The ten-year Treasury yield held at 4.63%, the two-year edged down two bp to 4.18%, the S&P 500 consolidated at 7,723, down 0.2%, and VIX stayed low near 15.8.
Gold offered the clearest contrast. As crude broke lower, spot gold surged to around $4,351 an ounce. This sharp divergence ruled out indiscriminate pressure from tighter liquidity or a stronger dollar. Cross-market signals showed generally easy conditions with safe-haven demand intact. Oil's selloff was a specific trade driven entirely by reversing supply expectations and loss of geopolitical premium.
Agreement drafting enters its final stage, but merchant ships remain stalled
Hormuz talks were the central trigger. The latest reports indicated a preliminary Iranian–Omani technical understanding on coordinates for safe routes, with the joint statement in final drafting.
The emerging framework envisaged a roughly 60-day temporary mechanism, inbound routes in northern waters near Iran and outbound routes in southern Omani waters. It included about 30 days for mine clearance, with final effect still subject to approval by Iran's highest authorities. Political positions remained delicate: Washington demanded unconditional free navigation and no fees. Trump said an announcement might come Wednesday or Thursday, and Bessent was repeatedly optimistic. Gulf diplomats cautiously estimated a roughly 50% chance of agreement by Friday, while Tehran denied direct U.S. dialogue. Markets still awaited the official reopening notice.
Actual shipping poured cold water on price anticipation. Kpler counted only five crude tankers passing on August 5, far below the prewar average above 20. MarineTraffic recorded eight passages August 4; other monitors put daily traffic around eight, with roughly 145 vessels still waiting inside the Gulf and at outer anchorages. Talks were near completion, but ships had not actually begun moving.
High war-risk costs and Red Sea threats impose a physical ceiling on recovery
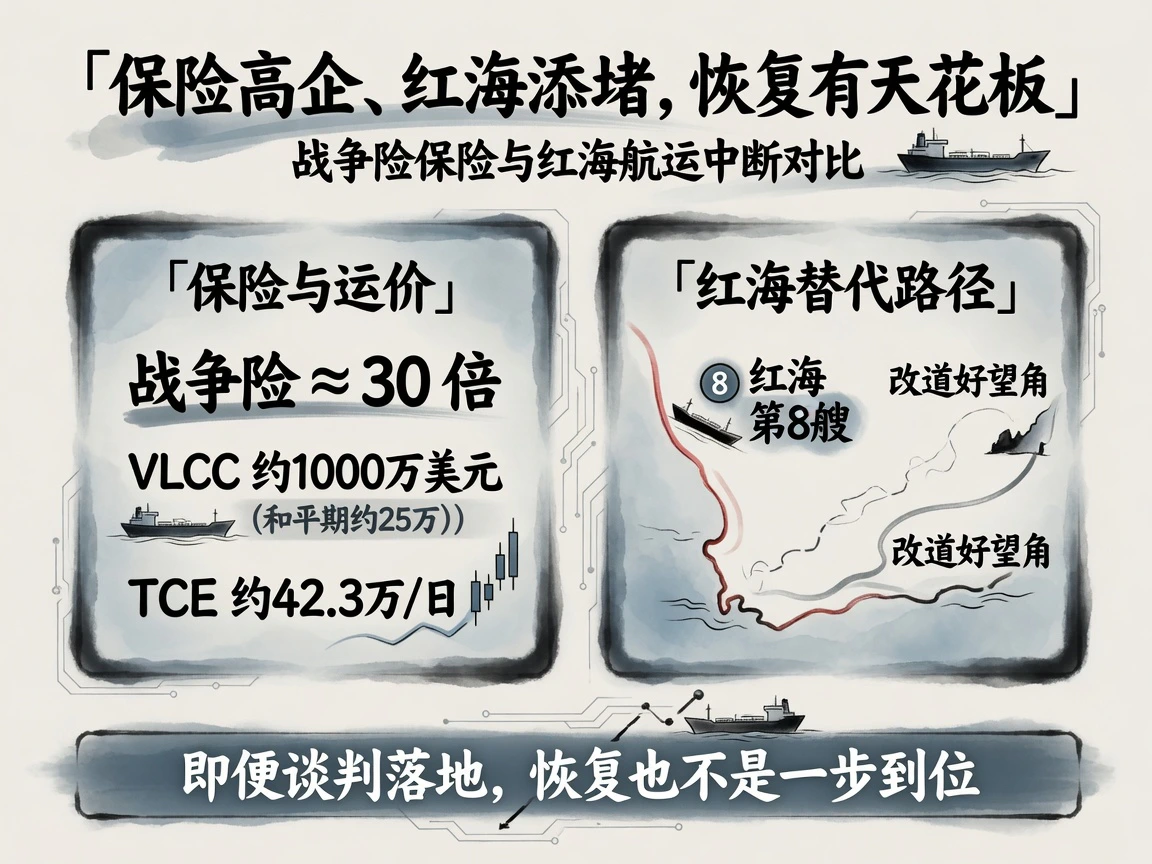
Even an announced reopening could not restore capacity in a day. Distorted costs and insurance were the first obstacles. Gulf war-risk surcharges remained nearly 30 times peacetime levels. A VLCC transit premium was still quoted around $10 million versus a normal $250,000. TD3C Gulf–China freight closed July 31 at WS 424, equivalent to TCE around $423,000 a day, still historically extreme. Mine clearance, rebuilding fleet confidence and insurer risk downgrades all involved substantial delays.
Alternative routes were also hazardous. After issuing a blockade order against Saudi-linked ships on July 20, the Houthis claimed another hit on Saudi tanker Wafa on August 5. If true it would be the eighth attacked vessel since that blockade; Saudi authorities had not commented. Saudi Arabia had already rerouted some crude around the Cape of Good Hope amid threats at the southern Red Sea. Even a temporary Hormuz opening could therefore leave Red Sea restrictions limiting full global shipping-efficiency recovery.
Geopolitical premiums retreat quickly, but physical constraints remain
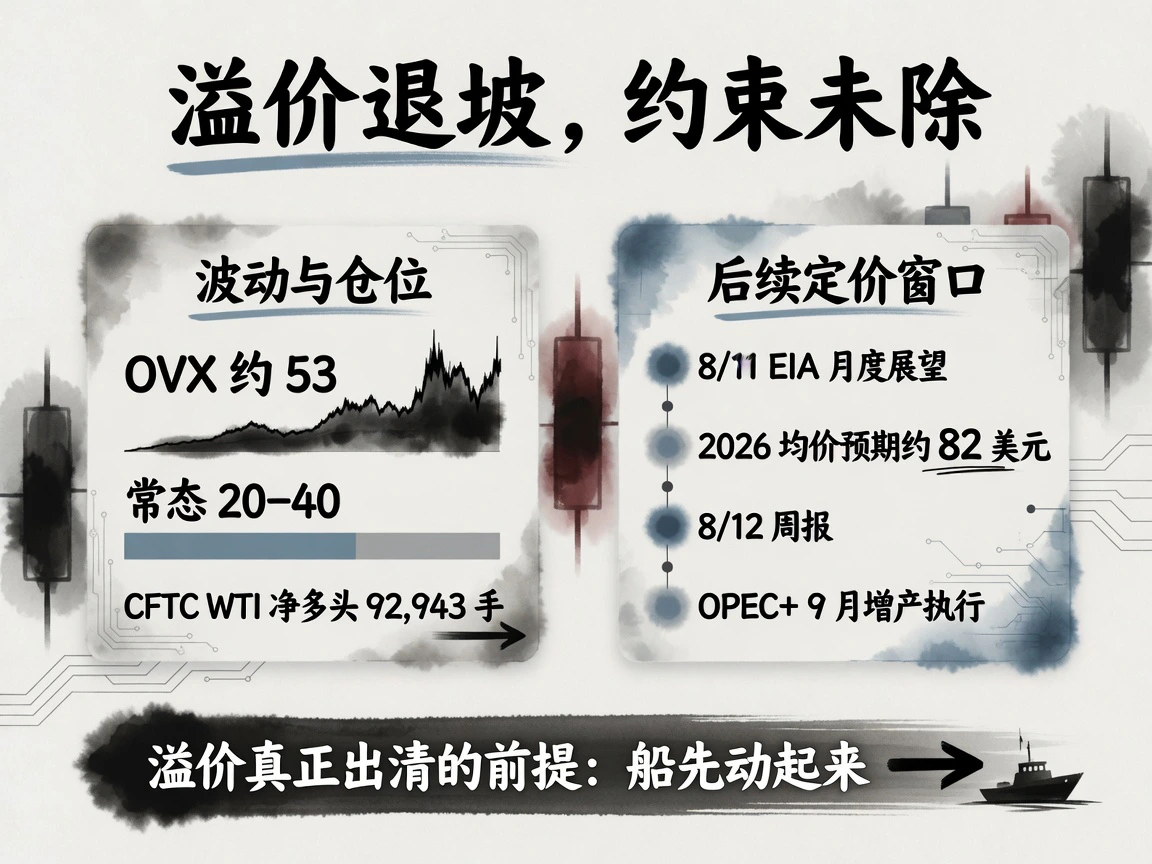
Prices, inventories and positioning showed the main trade: unwinding geopolitical premiums and gradual supply return, with caution about immediate capacity recovery. The curve remained backwardated, while OVX had fallen from earlier highs but was still near 53 on August 4, well above its normal 20–40 range. Compensation for prompt logistical constraints and political shocks had not fully disappeared.
CFTC positions for the week ended July 28 showed managed-money net WTI longs of 92,943 contracts, with earlier changes mainly reflecting exhausted short momentum and passive closures. The August 4 report due August 7–8 would test whether core longs had materially capitulated during the two-day plunge.
The next pricing windows were tightly packed: the final Iranian–Omani statement and implementation rules; the EIA's August 11 Short-Term Energy Outlook, after July's reduction of 2026 Brent average forecasts to around $82; the August 12 inventory report testing sustained U.S. builds; and physical implementation of OPEC+ September increases. The direction was clear: geopolitical overvaluation was deflating toward real supply–demand anchors. But until stranded Gulf tankers safely exited, clearing the premium would inevitably be uneven.


