The supposed agreement in principle on the Strait of Hormuz has yet to translate into actual flows of cargo-carrying vessels. Reports of restrictive passage conditions have added another complication, prompting bullish investors on Thursday to buy back the prompt logistics risk premium that had previously been squeezed out. Farther along the curve, however, OPEC+ production quotas are gradually rising as cuts are unwound, while an unexpected build in US commercial crude inventories continues to weigh on prices. The backwardated structure, with nearby contracts stronger than deferred maturities, has steepened further. The market’s ultimate test is clear: tankers actually moving through the Persian Gulf, rather than joint statements couched in diplomatic language.
Crude rebounds sharply across the board as the prompt logistics premium returns
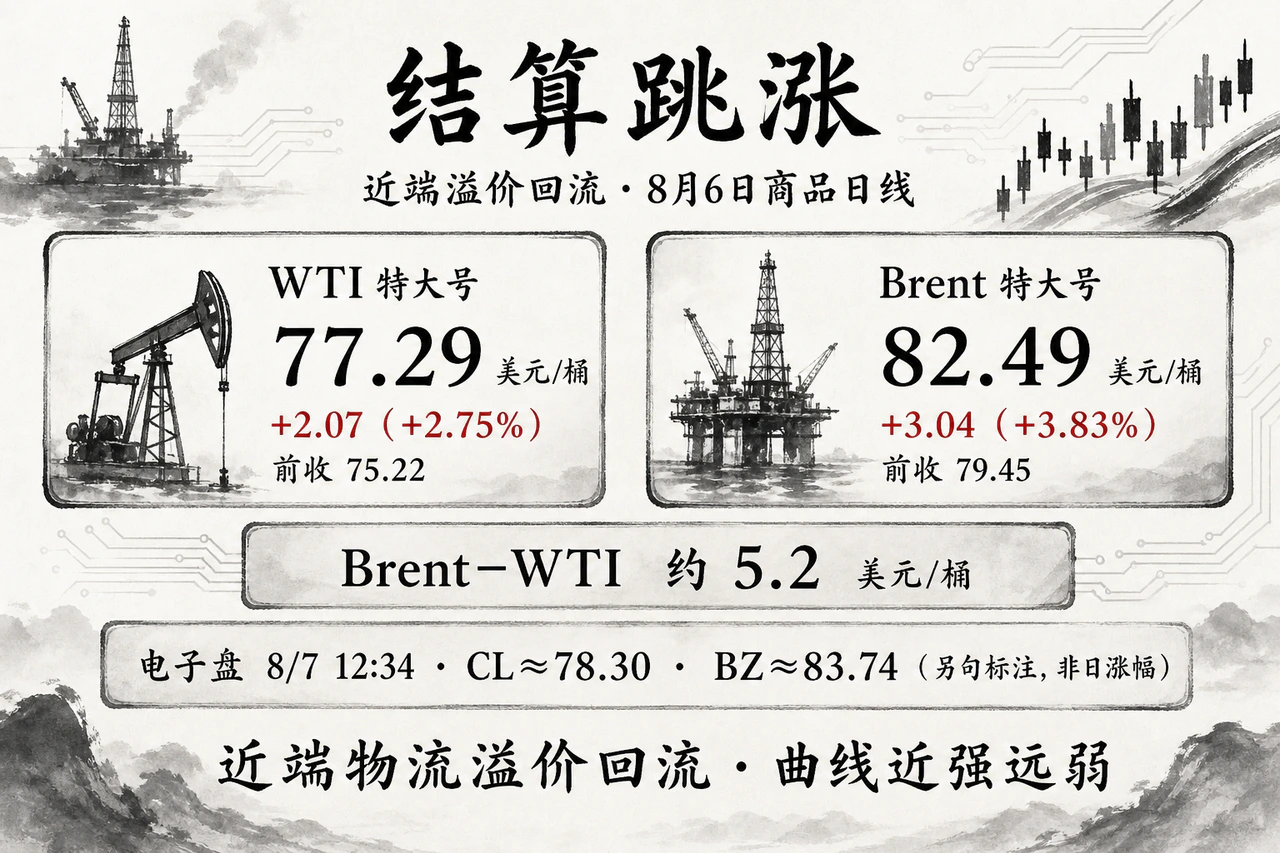
Official commodity settlements for Thursday, August 6 showed a broad rebound in crude. The active nearby WTI contract settled at $77.29 per barrel, up $2.07, or 2.75%, from $75.22 in the previous session. Nearby Brent settled at $82.49 per barrel, surging $3.04, or 3.83%, from $79.45. Brent’s premium to WTI widened to about $5.2 per barrel, showing that the global benchmark most directly exposed to the Middle East’s oil transport arteries was more sensitive to geopolitical disruption of shipping. Barchart reported a settlement gain of $2.07, or 2.75%, for September WTI (CLU26), fully consistent with the official figures.
Intraday monitoring produced snapshots of roughly $75.72 for WTI and $80.10 for Brent. These were momentary readings during the session and are excluded from the official daily changes. Buying spread further in Asian trading: at 12:34 Beijing time on August 7, an electronic trading snapshot showed WTI (CL) near $78.30 and Brent (BZ) around $83.74, another $1.0–1.3 above Thursday’s settlements. These are intraday reference prices and are not included in the previous trading day’s official statistics.
Although a complete series of month-by-month futures spreads was unavailable in the current window, public trading data still pointed clearly to extremely steep backwardation, with nearby contracts trading at substantial premiums to deferred contracts. This reflects the acute concern among physical buyers and refiners over the scarcity of immediately deliverable crude: the prompt premium for interrupted flows and logistics friction has barely faded. Relatively flatter deferred prices suggest that the market still partly incorporates a neutral longer-term outlook in which tensions around the strait gradually ease and producing countries release more supply. Downstream, September RBOB gasoline futures also posted a strong settlement gain of about 3.5%. Alongside tight US distillate inventories, this supported the crude rebound through refining margins.
US commercial crude stocks build while OPEC+ gradually raises paper quotas
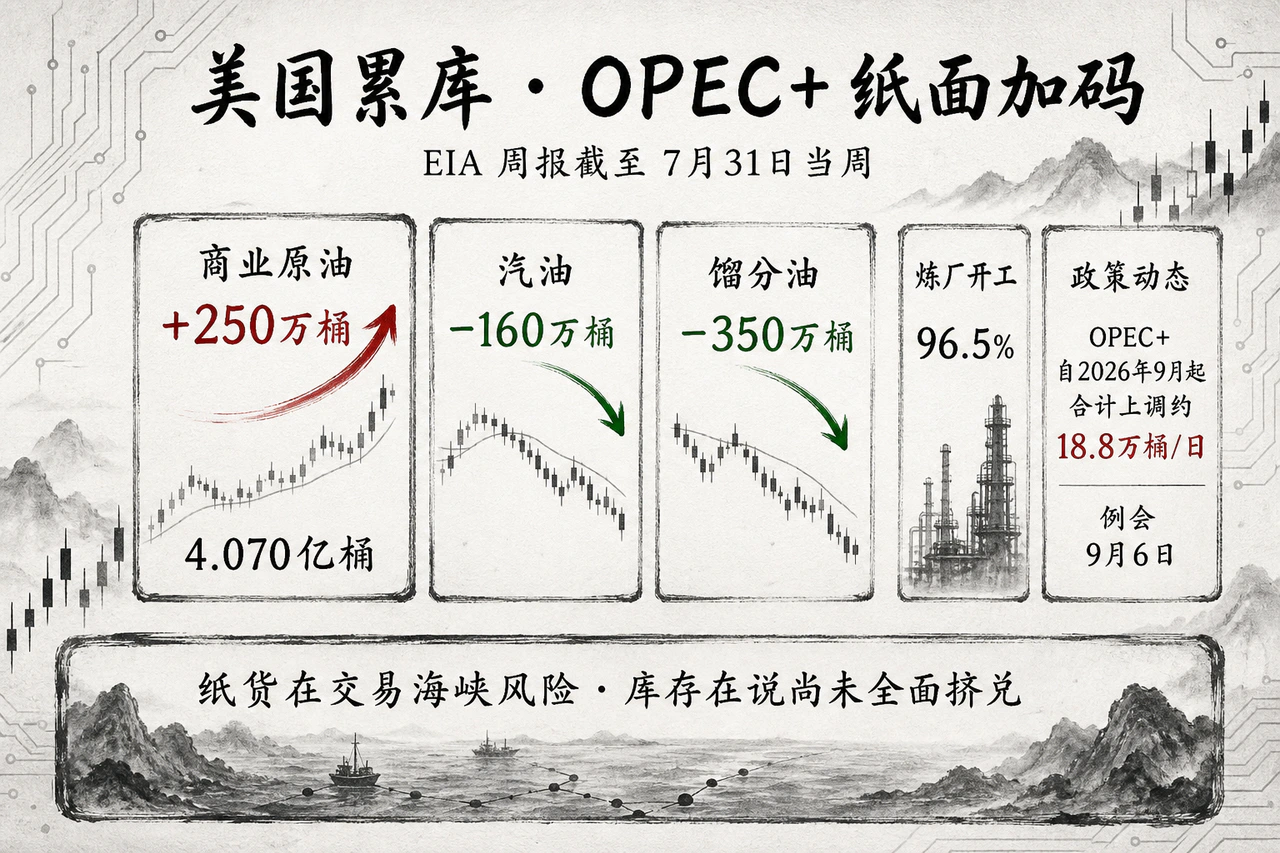
Despite the sharp futures rebound, US inventory data did not depict a wholesale breakdown in physical supply. The Energy Information Administration’s weekly report, released on August 5 for the week ended July 31, showed US commercial crude inventories excluding the Strategic Petroleum Reserve rising by 2.5 million barrels to 407.0 million barrels. Stocks remained about 6% below their five-year seasonal average, but still increased in absolute terms. Product inventories continued to draw: gasoline fell by 1.6 million barrels and distillates by 3.5 million barrels, leaving the latter about 12% below their five-year seasonal average. Refinery utilization remained very high at 96.5%, down slightly from 97.2% a week earlier. Average crude imports rose to around 6.2 million barrels per day, an increase of approximately 515,000 barrels per day from the previous week. Derivatives markets were clearly trading the extreme geopolitical risk of a blocked Persian Gulf chokepoint. Physical data, however, showed that at least within the United States, the supply chain had not suffered a system-wide depletion and scramble for supplies. The next official EIA weekly inventory report was expected around August 12.
On producer policy, seven OPEC+ countries—Saudi Arabia, Russia, Iraq, Kuwait, Kazakhstan, Algeria and Oman—announced after their August 2 online meeting that they would raise combined crude production quotas by about 188,000 barrels per day from September 2026. This would complete the phased withdrawal of the additional voluntary cuts introduced in 2023. The joint statement, however, set no binding production path for the fourth quarter. The group’s next regular meeting was scheduled for September 6. Although specialist institutions and industry media generally considered a pause in further increases during the fourth quarter more likely, the only firm facts traders could establish before a formal decision were the announced September adjustment and the still-open Q4 policy outlook.
A stronger dollar and higher rates fail to halt the supply-disruption premium
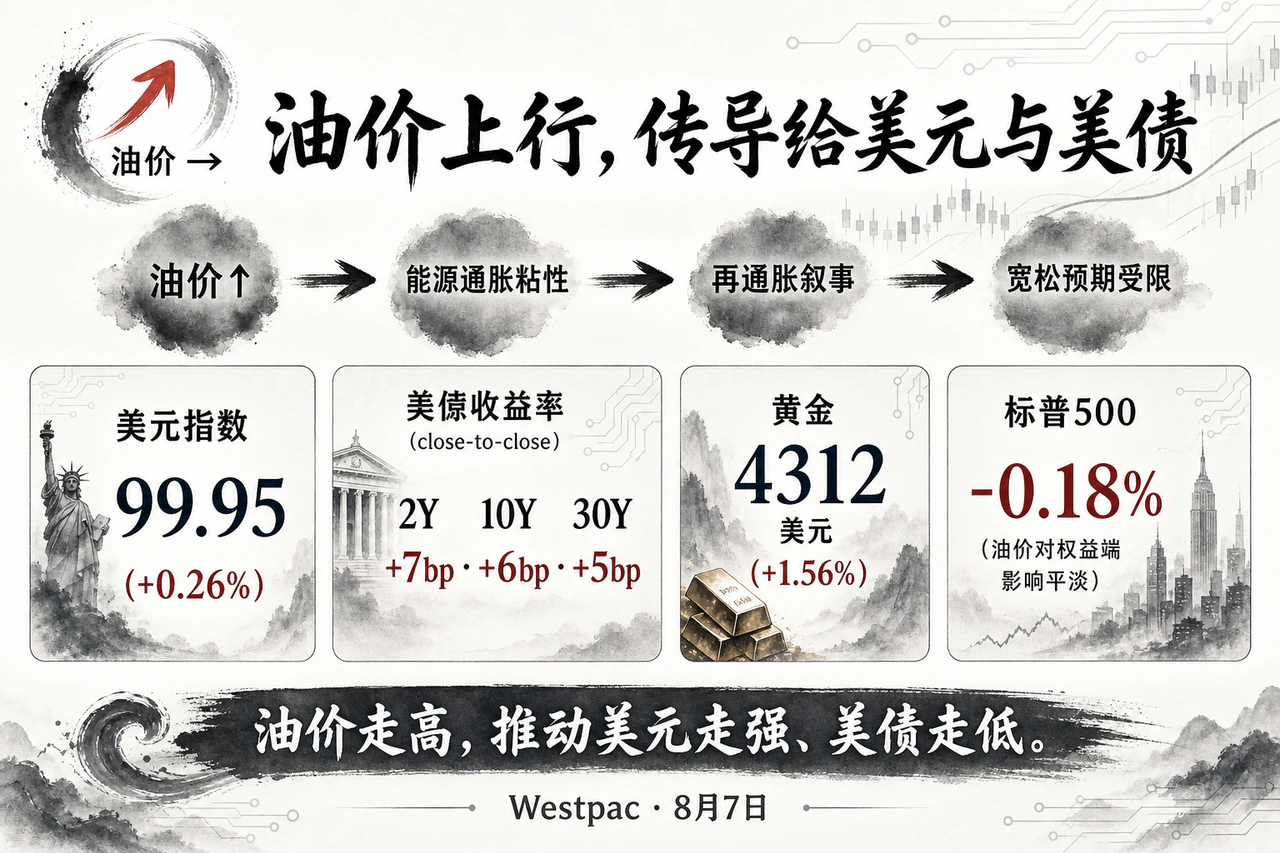
Across the broader macro environment, financial conditions created a direct valuation headwind for commodity bulls during the session. The dollar index settled near 99.97, up 0.28% from the previous session. Treasury yields rose across the curve: the two-year yield closed at 4.25%, up 7.0 basis points, while the benchmark ten-year yield reached 4.69%, up 6.0 basis points. In a conventional macro framework, higher real interest rates and a stronger dollar would place substantial pressure on dollar-denominated risk commodities. Crude futures ignored that headwind and rallied sharply, demonstrating how thoroughly physical supply disruption and geopolitical shipping risks dominated current pricing. Macro liquidity had temporarily become a secondary consideration.
In equities and other asset markets, the S&P 500 slipped about 0.18%, while the VIX volatility index actually eased toward 15.15. The oil surge had therefore not spread into systemic stagflation fears or deleveraging across asset classes. COMEX gold futures settled essentially flat, down about 0.09%. Additional electronic-session fluctuations in international gold prices around the reporting window reflected localized liquidity changes and should not be folded into the main account of that day’s commodity pricing.
Shipping through the strait is nearly stalled, with extraordinary freight rates pricing geopolitical friction
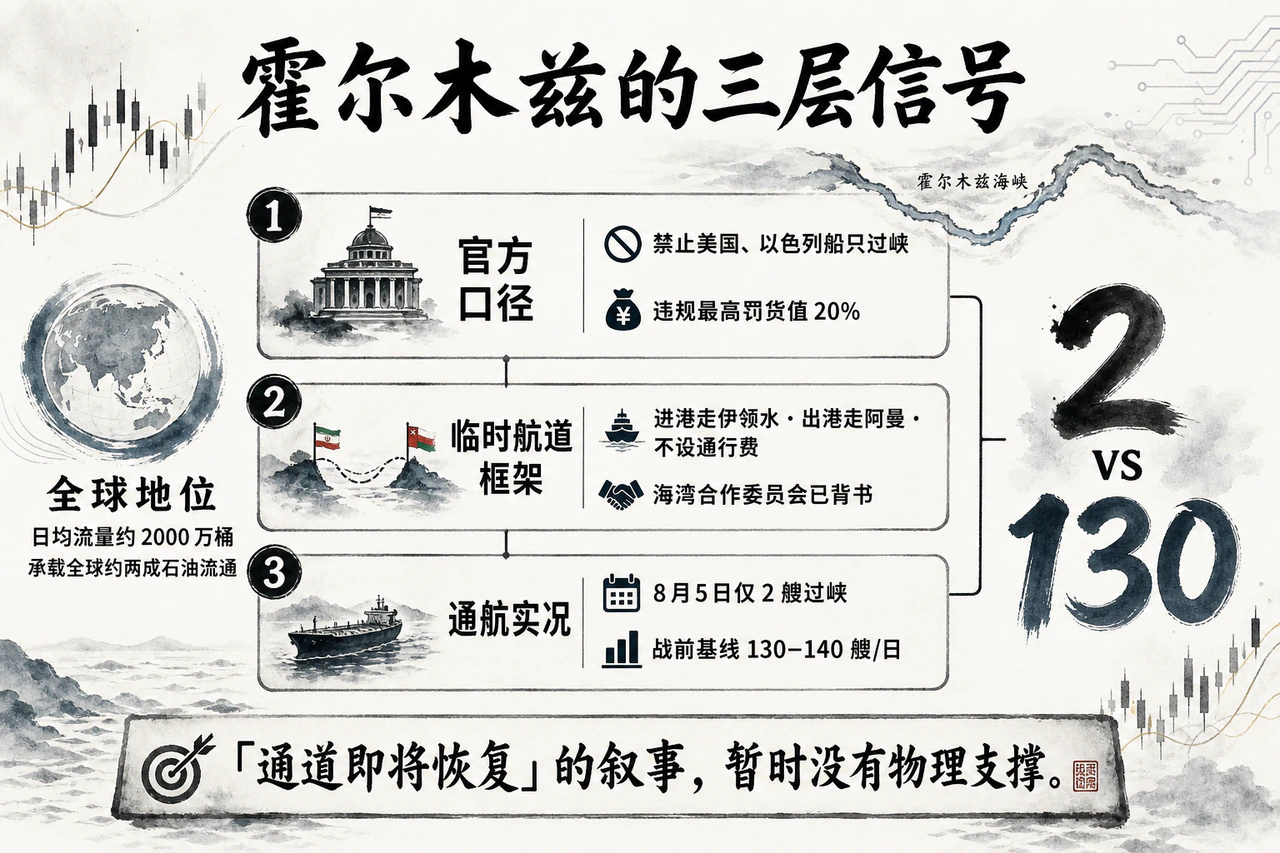
In shipping and energy markets, high-frequency satellite tracking often provides a more objective measure than diplomatic language. Although Iranian and Omani officials had said they had reached broad agreement in principle on safe passage coordinates, with inbound traffic near Iranian waters and outbound traffic near Omani waters, conditions at sea showed no sign whatsoever of a return to normal navigation. FreightWaves, citing the latest monitoring by energy vessel tracking firm Kpler, reported that only about 8 vessels of all types passed through Hormuz on August 5, including just 5 crude tankers, compared with more than a hundred daily transits before the crisis. Maritime publications recorded only single-digit commercial cargo-vessel crossings in the same period. Cyprus Mail and other overseas media described commercial shipping in the Persian Gulf as nearly paralyzed. Tracking sources differed slightly in their counting methods, but the central finding was consistent: merchant vessels had simply not returned.
Meanwhile, restrictive passage terms reported by Iran’s Fars news agency and other channels deepened market caution. The reported rules imposed stringent screening and access restrictions on certain nationalities and on shipowners Tehran considered to have harmed Iranian interests. Crude and shipping traders interpreted this to mean that even if a political opening emerged, passage would most likely remain limited and conditional, far short of unrestricted navigation. The prompt logistics premium was therefore quickly restored. In the Red Sea and near Saudi Arabia’s western port of Yanbu, several maritime defense organizations reported that Yemen’s Houthis had again claimed an attack on a Saudi-linked tanker. Whether such attacks amounted to a regular blockade still required assessment. They nevertheless created a parallel maritime security threat outside the Persian Gulf, shutting off overly optimistic expectations based on pipeline diversions to the west coast.
Shipping-market conditions were particularly extreme. According to benchmark assessments by Lloyd’s List, time-charter-equivalent earnings for very large crude carriers on the Persian Gulf–Far East TD3C route had recently reached an extraordinary level of about $296,000 per day. By comparison, VLCC earnings on the Atlantic West Africa–China route, which was not directly exposed to the strait crisis, were around $128,000 per day. This enormous regional freight-rate divergence illustrated the severe fleet misallocation caused by Hormuz-related geopolitical risk. War-risk insurance surcharges quoted by international protection and indemnity clubs also remained at crisis levels, many dozens of times their prewar rates. For multinational oil companies and commercial shipowners, the availability of insurance was itself the hard constraint determining whether the maritime flow could restart.
Nearby contracts price a shipping option; deferred contracts weigh the ceiling imposed by new supply
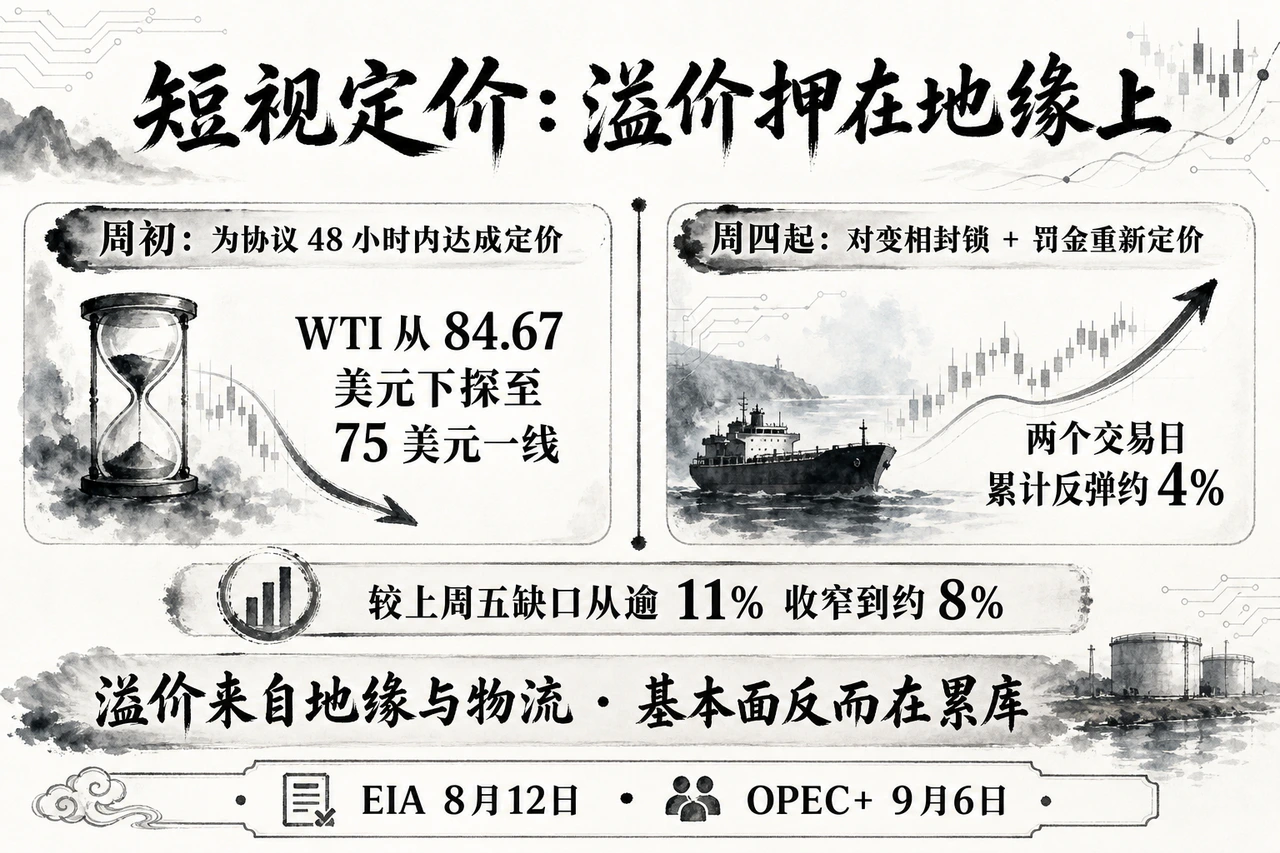
The crude futures curve vividly reflects two distinct pricing calculations. At the front end, traders are dynamically pricing a call option on when Hormuz will genuinely reopen and how restrictive its conditions will be. The session’s sharp rebound was essentially a forceful repricing of the gulf between a diplomatic agreement seemingly within reach and physical cargo traffic unable to move. Farther along the curve, investors are weighing OPEC+ quotas that gradually authorize more supply, the actual drag from rising US commercial crude inventories, and the global demand destruction and regional logistics restructuring that persistently high prices could trigger if the strait remains obstructed.
Cross-asset behavior was equally revealing: oil surged, US equities remained broadly stable, and the VIX showed no panic-driven spike. This combination clearly indicates that the crude rally was a pulse in supply-chain logistics premiums caused by a localized physical chokepoint, rather than part of a global retreat from risk. The steep and resilient backwardation shows that speculative investors and physical-market participants remain unwilling to impose expectations of medium- to long-term oversupply prematurely on nearby delivery contracts.
From here, oil’s next moves depend heavily on several hard measures over the coming days: whether actual daily commercial transits through Hormuz rise meaningfully; whether maritime war-risk surcharges and regional VLCC freight premiums begin to peak and fall; whether the next EIA inventory report around August 12 strengthens the US stock-build narrative; and how OPEC+ ultimately defines its fourth-quarter production path at the September 6 meeting. Until these questions are resolved, high prompt premiums, sharp swings and volatile trading are likely to persist.


