On August 12, 2026, softer July U.S. CPI and delivered AI-infrastructure earnings lifted equity risk appetite and lowered short- and intermediate-term Treasury yields. The 30-year remained unchanged, showing supply and term premiums still weighing on the long end. Oil moved narrowly between a huge commercial build and Gulf-shipping geopolitical premiums, while gold rose despite a firmer dollar.
This was structural repricing driven by cooler inflation and earnings, beyond a simple rate-cut trade. S&P 500 gained 0.26%, Nasdaq 100 0.54%, Russell 2000 0.61% and VIX fell 4.78%. Two- and ten-year yields each fell two basis points, but the dollar rose 0.19% to 100.01 and COMEX gold 0.59%. Buying benefited from both inflation relief and profit delivery, while cross-asset funds still priced tail risks from long-term debt supply and Middle East energy-route disruption cautiously.
Fixed income: inflation relief helps the front end; supply and term premiums constrain the long end
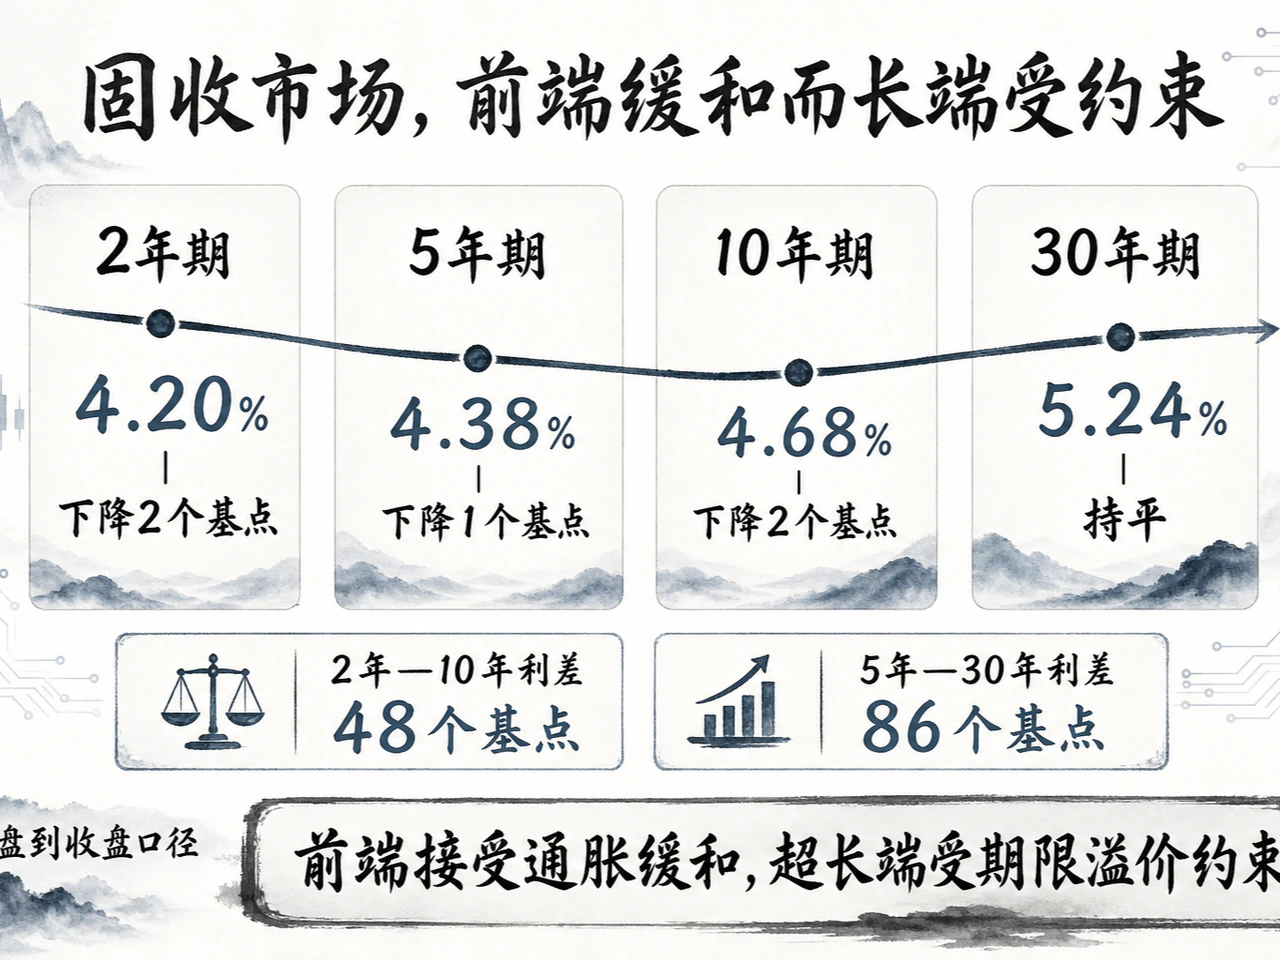
Treasury's August 12 daily par curve closed with the two-year at 4.20%, down two basis points; five-year 4.38%, down one; ten-year 4.68%, down two; and 30-year 5.24%, unchanged. These are strictly official close-to-close changes, excluding intraday noise.
The curve steepened slightly. The two-to-ten spread stayed near 48 basis points; five-to-30 widened from 85 to 86. Short bonds priced reduced policy pressure from softer inflation, but the ultra-long end did not follow, anchored by deficits, issuance and required term premiums. Ten-year breakeven inflation edged down one basis point to 2.26%. Credit was stable: investment-grade OAS unchanged at 0.79%, high yield one basis point narrower at 2.71%, without deterioration from high rates.
Around 23:44 Beijing time August 13, intraday proxies were approximately 4.639% for ten years, 4.318% for five and 5.208% for 30. These publication-time snapshots cannot replace August 12 official benchmarks.
AI earnings lead growth-stock recovery while high rates pressure cyclicals
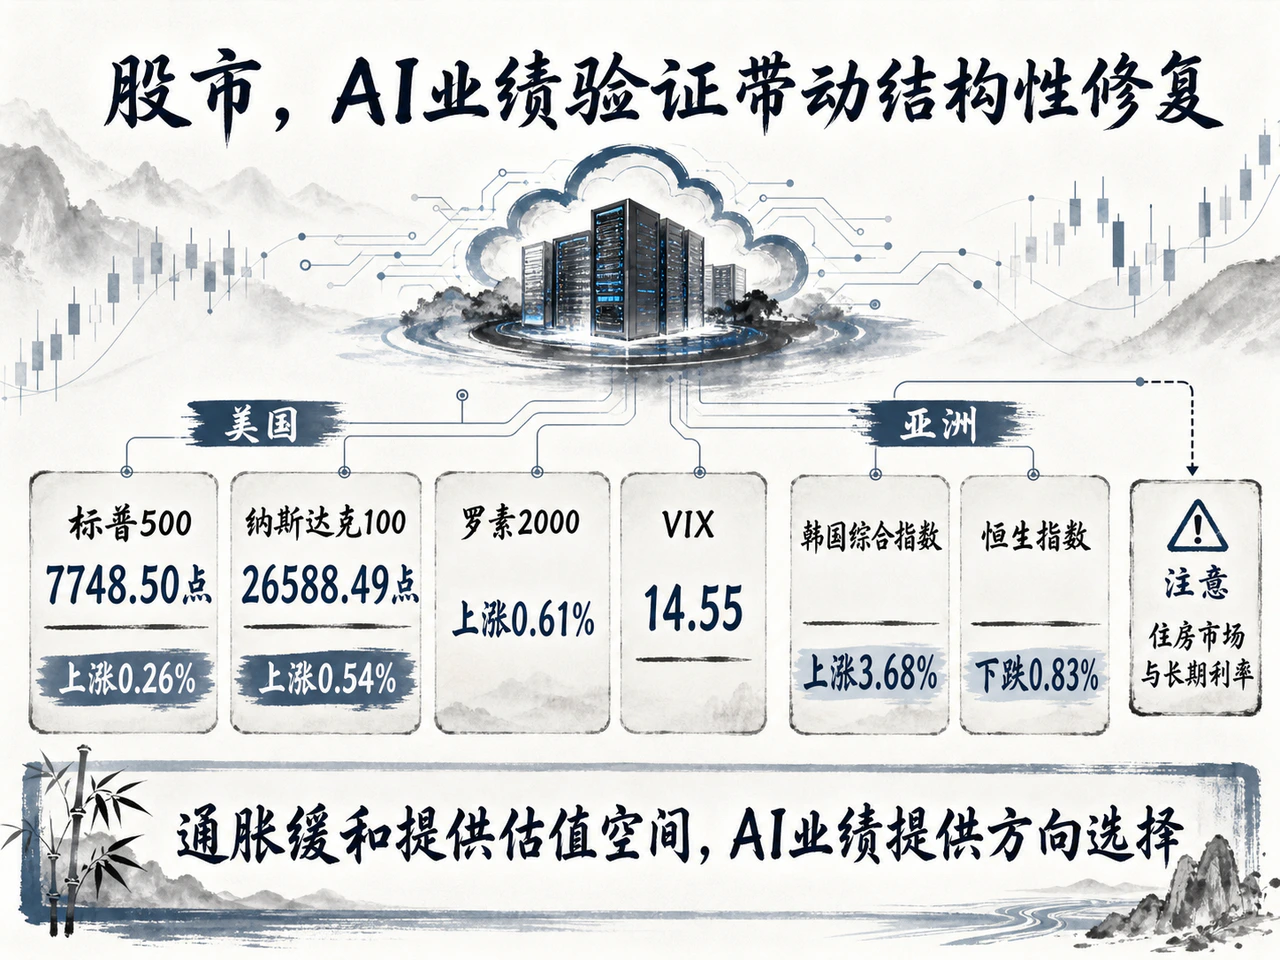
Growth and small caps outperformed while traditional heavyweights diverged. S&P 500 closed 7,748.50, +0.26%; Nasdaq 100 26,588.49, +0.54%; Dow -0.04%; Russell 2000 +0.61%; VIX 14.55. Better-than-expected AI server and cloud-computing earnings lifted Nvidia and other leaders, moving the chain from pure multiple expansion toward verified profits.
Rate-sensitive homebuilders were weak, showing long rates restraining mortgage demand and property chains. August 12 was not a broad rally but selective repricing: cooler inflation created valuation room and AI earnings defined direction. Failure to convert downstream capital orders into sound revenue, profits and operating cash, or renewed long-rate increases, would still require high valuations to be recalibrated.
Asia also diverged: KOSPI rose 3.68% while Hang Seng fell 0.83%. Workbook snapshots near August 13's Asian close showed KOSPI about 6,813.34 and the Nikkei-related index about 68,308.59. Korea and Japan's deep semiconductor and computing links transmitted U.S. technology sentiment more directly. But energy-importing Asian economies remain sensitive to Gulf logistics, with higher import bills and depreciation pressure potentially emerging over the medium term.
Macro and policy: cooler inflation reduces urgency, but persistence needs broader confirmation
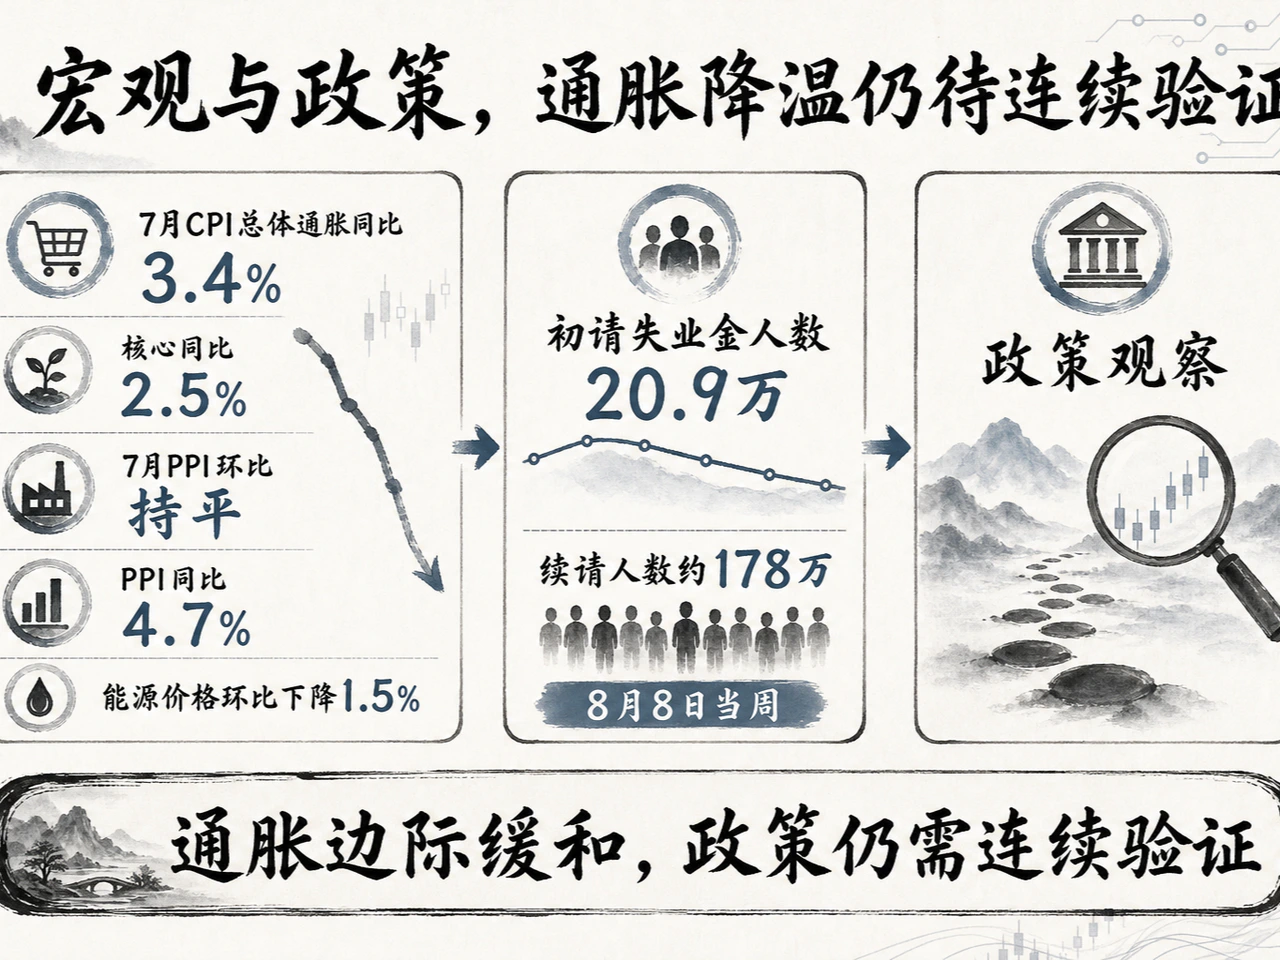
July headline CPI eased from June's 3.5% to 3.4% year on year and core from 2.6% to 2.5%. July PPI was flat monthly and slowed annually from 5.5% to 4.7%. This reduced the tail risk of broad renewed inflation and urgency for another hike, but did not justify rapid easing. Housing services remained the main monthly CPI driver, energy fell 1.5%, and some core industrial components stayed sticky.
Labor signals suggested modest cooling, not a stall. Initial claims for the week ended August 8 were 209,000, up 9,000 from the revised prior figure and slightly above expectations but still low. Continuing claims were about 1.78 million. One week cannot establish a turning point; together with inflation relief it allowed a data-dependent observation window.
No new rate decision, minutes or clearly incremental official speech was scheduled within the current window. Swaps and futures had reduced next-meeting hike pricing, but implied probabilities can swing sharply with high-frequency releases and are no policy promise. Employment, August inflation and July minutes remained key tests of the benchmark path.
Commodities: inventory builds offset geopolitical premiums while gold strengthens
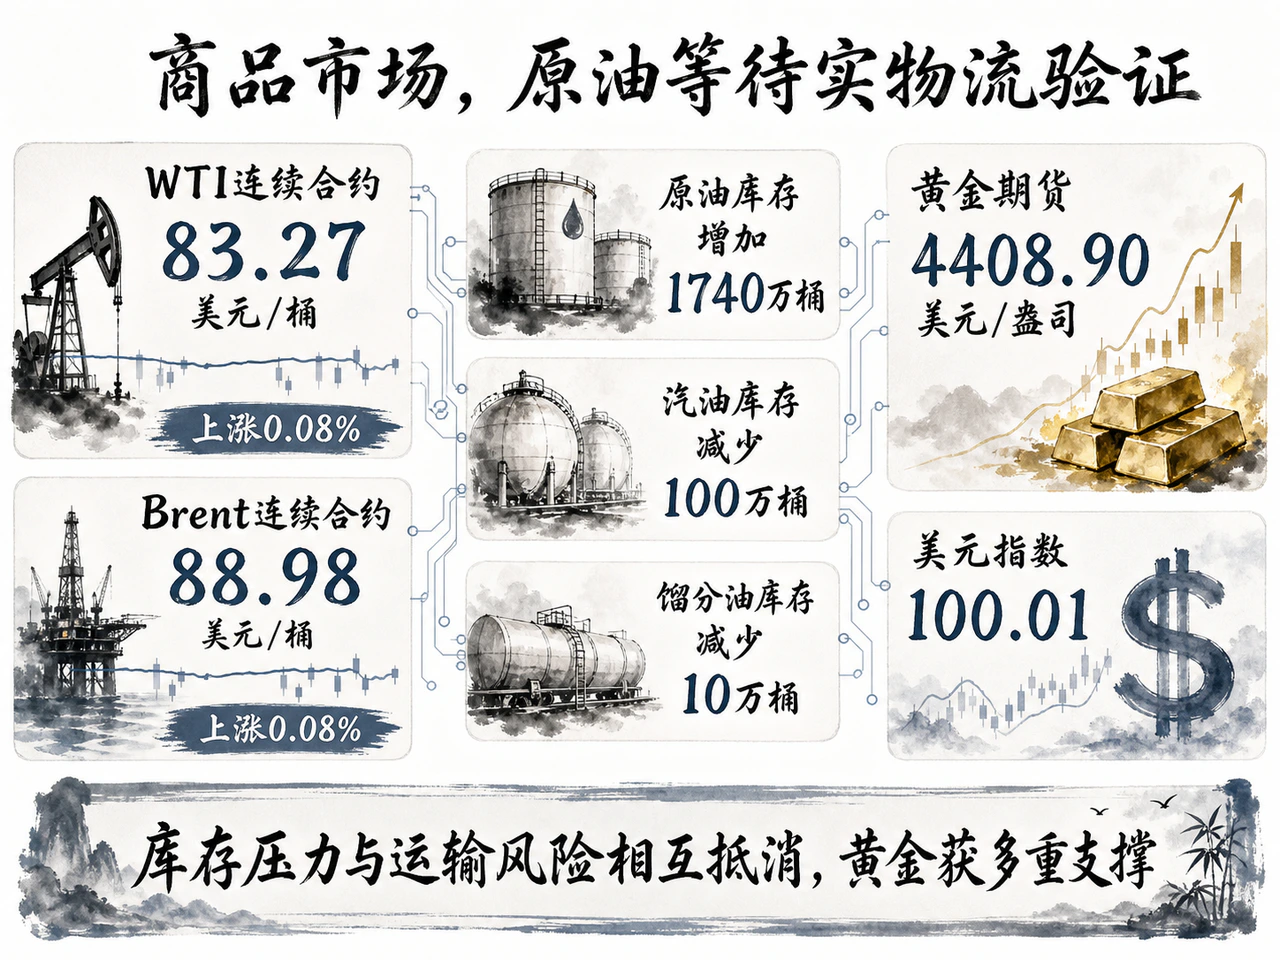
On August 12, continuous WTI closed at $83.27 a barrel, +0.08%, and continuous Brent at $88.98, also +0.08%. Narrow trading reflected a standoff between U.S. commercial inventory pressure and Gulf disruption and tight products supporting premiums. These are continuous daily quotes rather than official final settlements for a specific delivery month.
In the week ended August 7, commercial crude rose 17.4 million barrels to 424.4 million, a recent weekly high, while gasoline fell 1 million and distillates 100,000. The crude build capped prices, but product stocks remained well below five-year seasonal averages: passive crude accumulation coexisted with thin final-fuel buffers. Shipping flows and actual loading had not confirmed removal of Gulf transit and war-insurance risks.
Around 23:49 Beijing time August 13, intraday WTI and Brent fell to $82.43 and $88.15, below the prior continuous closes, but these were not new settlements. COMEX gold closed August 12 at $4,408.90 an ounce, +0.59%, while the dollar rose 0.19% to 100.01. Their unusual joint strength suggests gold benefited from lower nominal yields and central-bank reserve allocation, plus hedging of extreme geopolitical risks such as disordered Middle East energy routes.
Geopolitics: political signals fluctuate while markets await actual passage
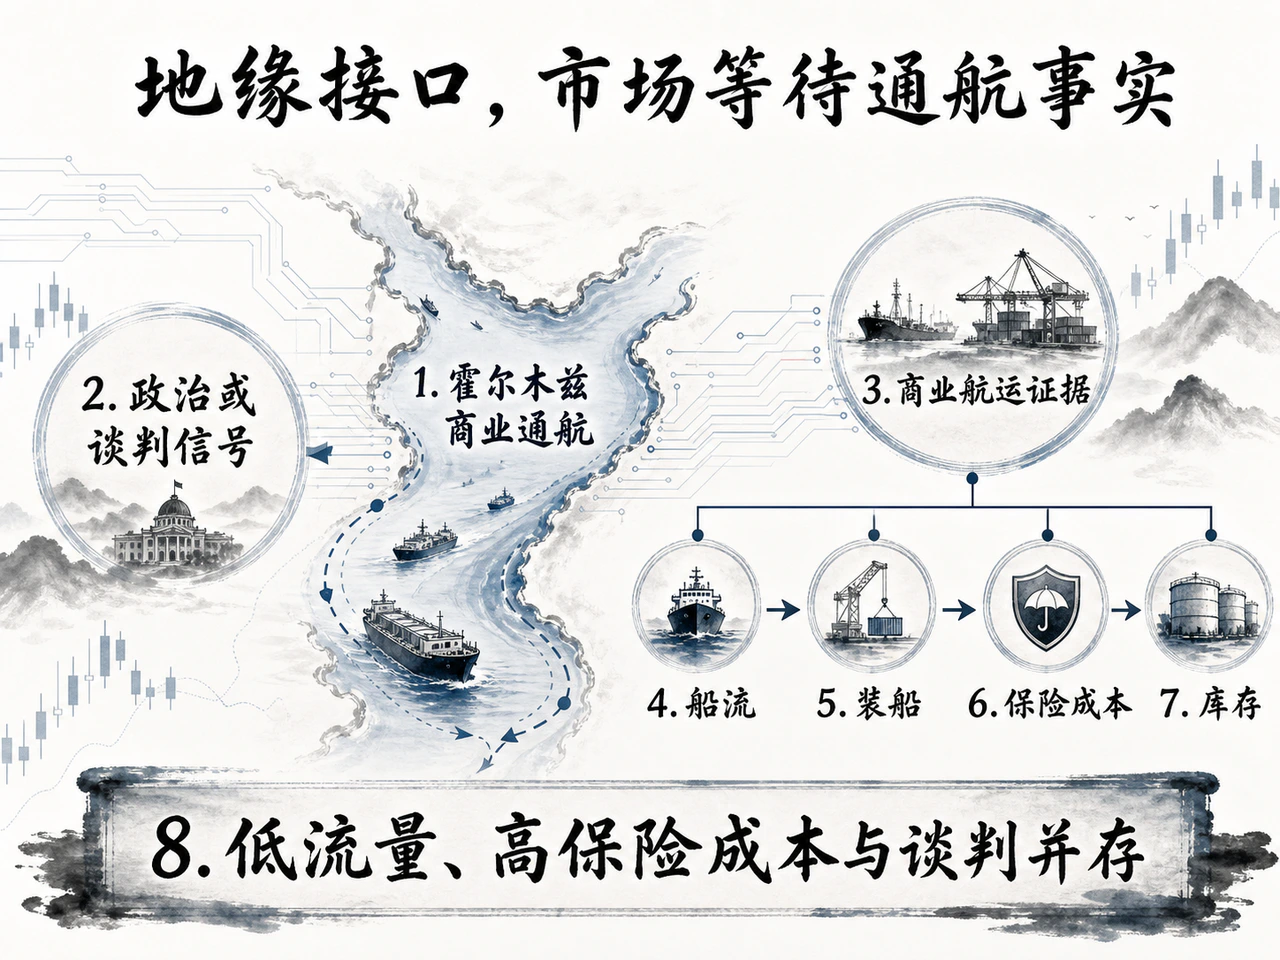
The core global-pricing link is credible restoration of commercial Hormuz shipping. Recent claims about control or impending arrangements remained political negotiating signals. At publication, no binding reopening agreement had been signed and enacted by the parties, and evidence from transits, tanker loading and sharply lower additional war premiums was absent.
The baseline remains prolonged coexistence of low traffic, expensive insurance and diplomacy. Premiums concentrate in nearby energy and logistics rather than a broad global liquidity squeeze. Peripheral clashes and incidents show continuing spillovers, but verification of actual crude-supply effects remains incomplete. Sustained traffic, loading, insurance and global inventory turning points matter more than declarations.


