On August 13, 2026, overseas markets moved in a coherent macro pattern: producer inflation cooled more than expected, Treasury yields fell and lower oil settlements helped US stocks reach new highs. Investors reduced fears of renewed near-term Fed hikes and restored valuation upside to risk assets.
A comprehensive dovish turn remained premature. Beneath mild headline PPI, services were sticky and 30-year Treasuries lagged shorter maturities. Oil's decline mainly followed demand downgrades, without resolving actual Hormuz bottlenecks or supply rigidity. Trading reduced the urgency of hikes temporarily; a durable pivot still required corroboration from key macro data.
Bonds move first as markets reduce the urgency of immediate tightening
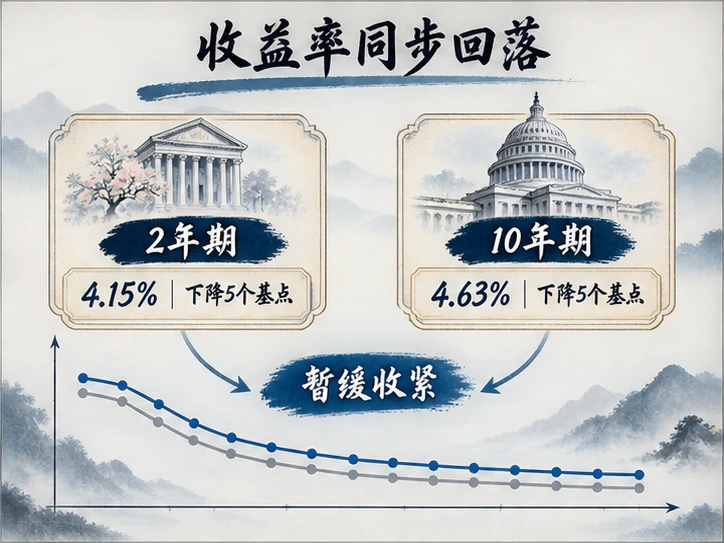
July final-demand PPI broke the rate stalemate. It was flat monthly, with annual inflation falling from June's 5.5% to 4.7%. Goods fell 0.7%, driven by energy's 3.1% monthly decline. Services still rose 0.2%, and PPI excluding food, energy and trade services increased 0.4%. The headline was reassuring without uniform cooling or the disappearance of core persistence.
Employment cushioned expectations. Initial claims in the week ending August 8 were 209,000, up 9,000 from the revised prior reading, with a low 199,000 four-week average. Continuing claims edged down to 1,777,000. Labor was cooling gradually rather than collapsing, supporting marginal relief in tightening expectations.
Bonds repriced near-term policy risk. On Treasury par-yield daily closes versus August 12, the 2-year finished 4.15%, down 5bp; 5-year 4.32%, down 6bp; 10-year 4.63%, down 5bp; and 30-year 5.21%, down only 3bp.
The 2- and 10-year moves kept 2s10s at 48bp. The policy-sensitive 5-year led, while the 30-year, more exposed to fiscal supply and long inflation compensation, lagged. The 5s30s spread widened from 86bp to 89bp. Traders welcomed less near-term hike risk but retained defenses against large long supply and persistent term premiums.
US equities hit records as Asian divergence becomes clearer
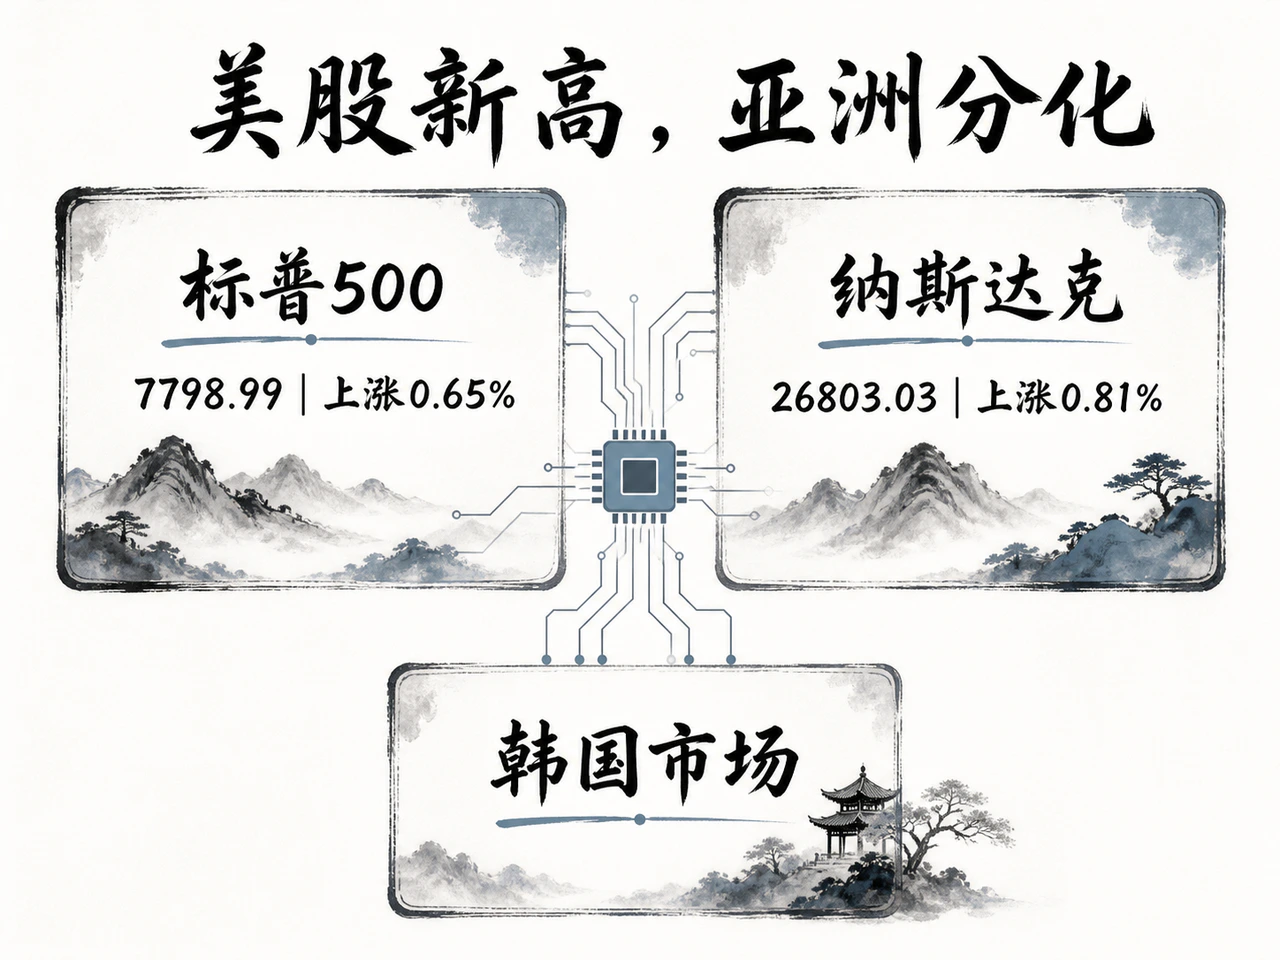
Lower rates and energy costs improved valuation denominators. The S&P 500 rose 0.65% to a record 7,798.99; Nasdaq Composite gained 0.81% to 26,803.03. The Dow rose 0.13% and Russell 2000 0.24%. Gains were not universal or explosive, but risk buying was clear.
Sector differences revealed positioning. Lower discount rates revived rate-sensitive property and high-dividend assets. Individual scrutiny remained strict: Cisco beat revenue and profit expectations but fell 8.4% intraday as investors questioned gross-margin durability and AI capex monetization. Index records did not relax fundamental standards.
VIX closed at 14.63, near historical lows. Alongside equity records, it indicated little macro systemic hedging demand, with investors instead using individual stocks to demand high-quality earnings.
Asia differed. On August 13, Nikkei 225 rose 1.16%, KOSPI surged 3.56% on semiconductors and Hang Seng fell 0.17%. Korea had the greatest responsiveness to AI and hardware; Japan benefited from weak-yen earnings translation; Hong Kong lagged global liquidity transmission. By August 14 afternoon, Japanese and Korean gains continued, while USD/JPY still hovered near 159. Currency volatility continued testing Asian importers' costs and offshore dollar financing.
Oil falls without eliminating risk premiums
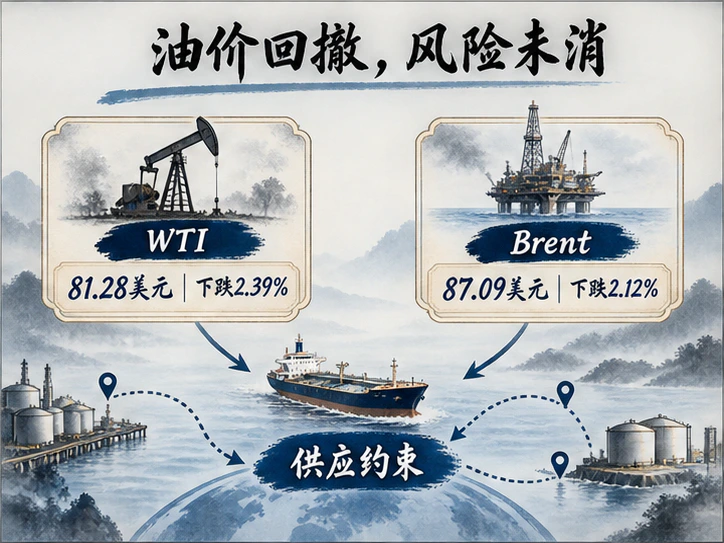
WTI continuous contracts closed $81.25 a barrel, down 2.43%, and Brent $87.07, down 2.15%. COMEX gold fell 1.03% to $4,363.60 an ounce while the dollar index slipped only 0.05%. Oil and gold's joint retreat mainly reflected positioning around weaker demand forecasts and reduced haven demand rather than dollar strength.
The IEA's August report cut 2026 global crude demand to a 1.6 million-barrel-per-day annual contraction, 510,000 lower than the prior forecast, giving short-term sellers a fundamental catalyst. Yet it still expected supply down 4.3 million barrels per day for the year and July observed inventories down 69 million barrels. Weaker demand expectations did not remove physical supply rigidity.
Geopolitical and transport constraints still impaired physical liquidity. Normal Hormuz passage, actual removal of port blockades, shipping compliance and war-risk insurance all lacked clear legally effective implementation. Demand and sentiment were traded first, but energy-logistics tails were not zero. Further smooth oil declines and sustained support to bonds and equities require actual loading, transit and inventory data.
The central lesson was that investors readily lowered near-term aggressive-tightening odds while retaining cushions in ultralong rates and energy exposure. Whether final US consumption confirmed moderate slowing would determine how long the joint stock-and-bond rally could last.


