Since the start of 2026, Treasuries have displayed a combination easily misread through habit: inflation remains high and long yields rise unevenly, yet the underlying driver is actual real yields, rather than fears of runaway long-term inflation.
At the complete official August 13 close, the 5-year nominal yield had risen 59 basis points from end-2025, with TIPS real yields up 64 and breakeven inflation down 5. The 10-year nominal yield rose 45, real yield 46 and inflation compensation fell 1 basis point. Of the 30-year's 37-basis-point rise, about 35 came from real yields. The selloff was fundamentally not pricing vicious reinflation over the coming decade.
Should the Fed respond to rising long real yields by raising policy rates to match? If not, what determines whether policy is behind the curve? Isolated rate levels cannot answer. Long real rates, expected short-rate paths, neutral r* and term premiums must be connected within one transmission framework.
This year's rise in Treasury yields is almost entirely driven by real yields
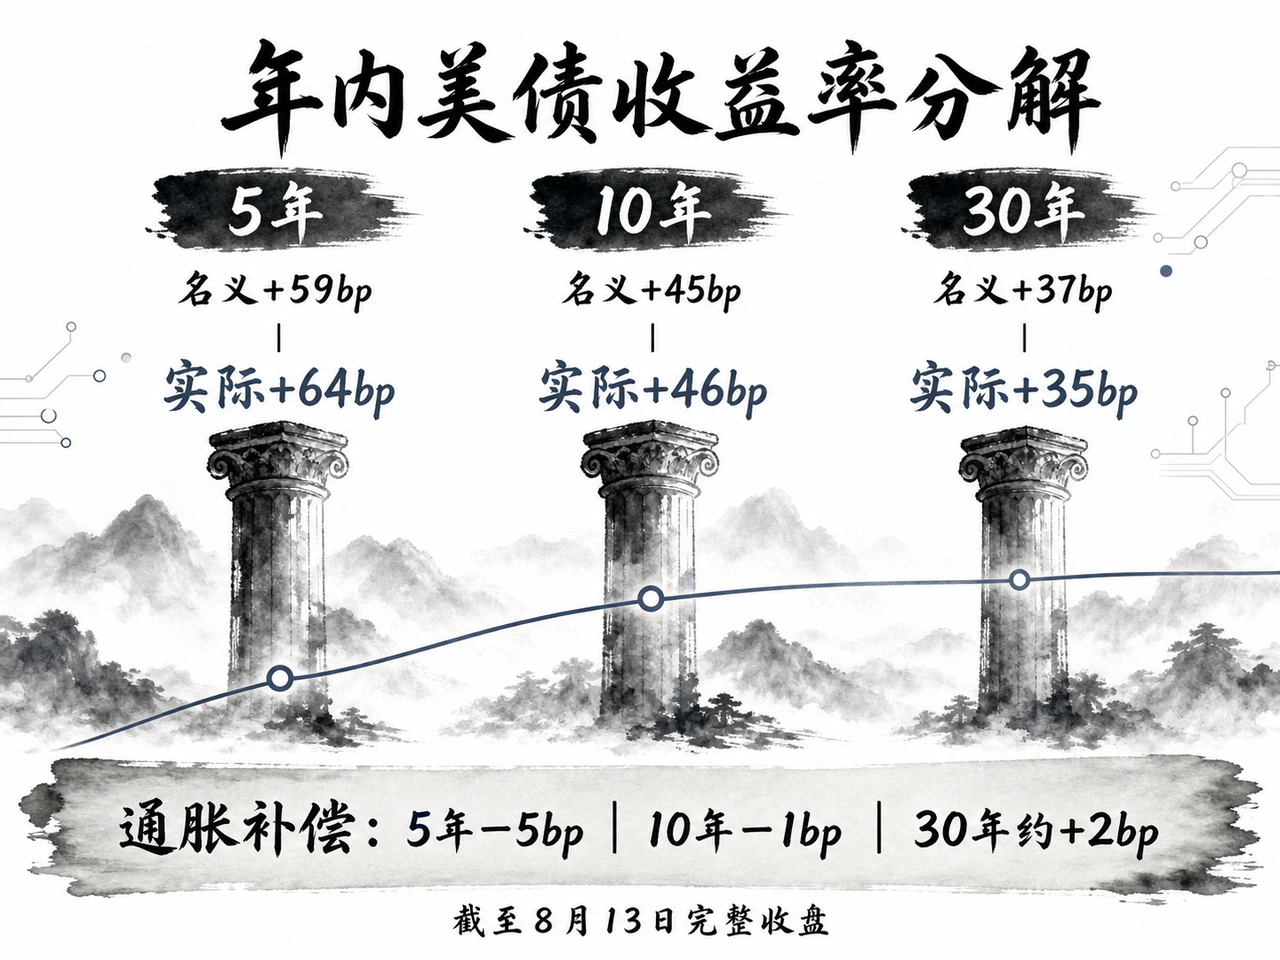
The Fisher framework decomposes nominal yields into real yields and inflation compensation, or breakevens. It is useful for attributing changes, but breakevens are not pure inflation expectations: they also contain inflation risk premiums, TIPS liquidity discounts and temporary supply-demand disturbances. Even allowing for these measurement effects, the 5-, 10- and 30-year signals agree: rising real yields overwhelmingly drove the curve's bear move.
Long inflation pricing showed no de-anchoring. Ten-year breakevens edged from 2.25% at end-2025 to 2.24% on August 13. The 5-year/5-year forward was around 2.30% on August 14, only about 8 basis points above the year's start. TIPS reference CPI while the Fed targets PCE, and CPI historically tends to be somewhat higher. Compensation of 2.2%–2.3% therefore cannot be compared mechanically with the 2% target. Levels and changes fit anchored expectations better than a 1970s inflation crisis.
The New York Fed's ACM model clarifies the pattern. From end-2025 to August 13, its fitted 10-year yield rose approximately 46 basis points: expected average nominal short rates contributed about 41 and the duration-risk term premium only about 5. The central trade was systematic repricing of future short policy rates higher for longer, rather than suddenly extreme required holding premiums.
This also defines the explanatory role of fiscal supply and liquidity. Annual net marketable borrowing near $2 trillion, heavy ultralong issuance and limited primary-dealer balance sheets structurally support a higher yield floor. If they dominated the year's marginal rise, modeled term premiums should have surged. Evidence instead favors policy-path recalibration as the main actor, with fiscal supply and liquidity friction as background.
The pattern closely mirrors 2018: from late March to early November, nominal 10-year yields rose 45 basis points, real yields 46 and compensation fell 1. Underlying economic dynamics more resemble late-cycle 2005–2006: resilient activity and employment, controlled expectations and repeatedly higher terminal-rate estimates. It differs fundamentally from 2013's taper tantrum, driven by surging term premiums, leveraged-long liquidation and immediate fear of QE withdrawal, with different severity and mechanics.
Why real rates rise: inflation can operate through the policy response
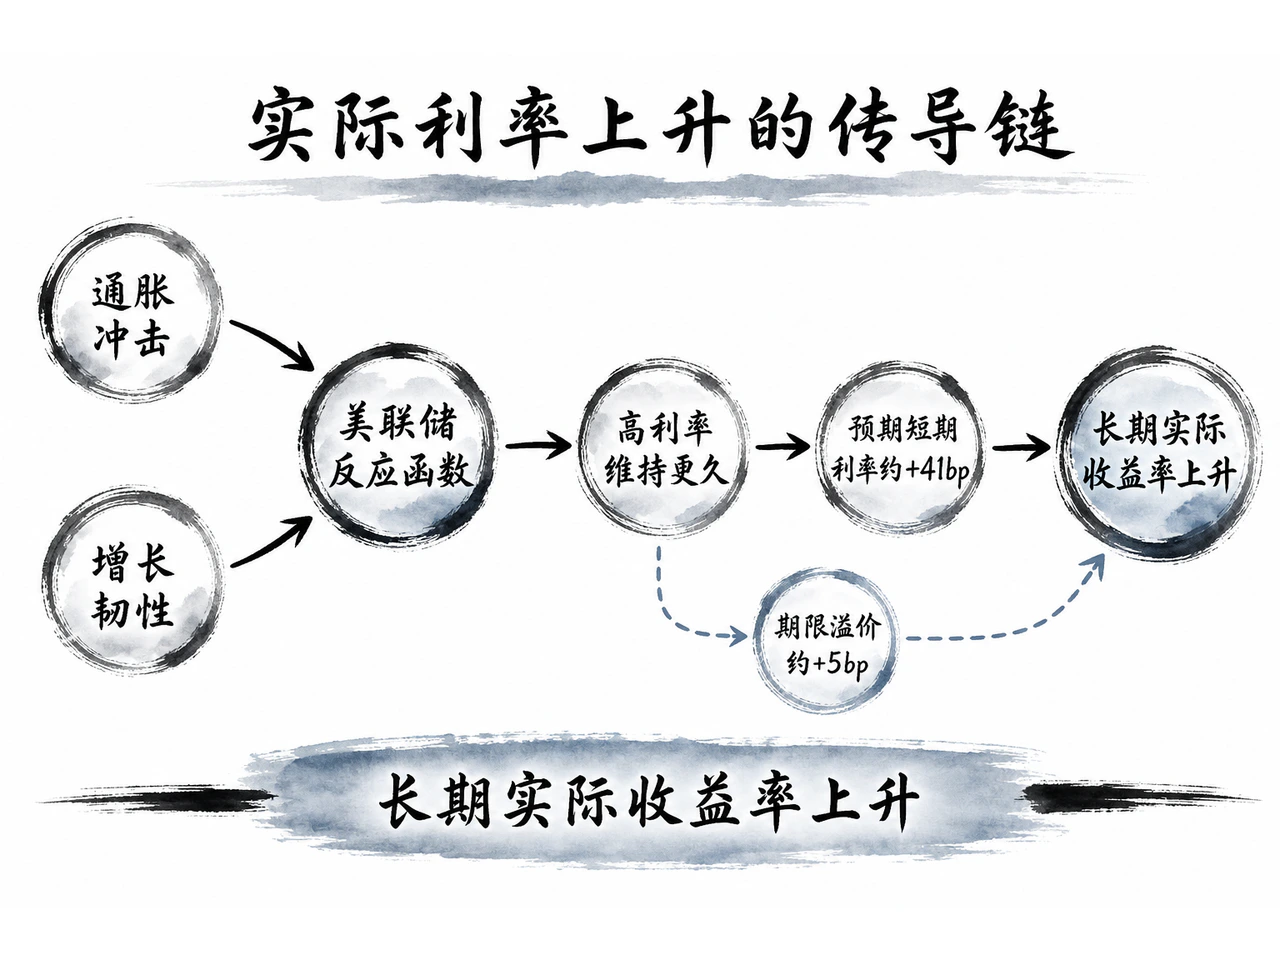
Higher expected short rates are not the end of causal analysis; stopping there explains one rate circularly with another. A coherent chain begins with inflation, growth and financial conditions. Markets reassess prices and activity, apply the expected Fed reaction function, infer future policy and transmit that path into long real yields through intertemporal arbitrage.
Stubborn inflation was this year's main trigger. June's SEP raised median 2026 headline PCE from March's 2.7% to 3.6% and core PCE from 2.7% to 3.3%. Median year-end funds projections rose from 3.4% to 3.8% for 2026 and 3.1% to 3.6% for 2027. The joint revision in official inflation and rates nearly matched markets' short-benchmark repricing.
Long inflation expectations need not worsen for this mechanism to work. If markets trust price-stability commitments, temporary tariff, energy and supply-chain shocks imply restrictive rates must last longer. Higher nominal policy alongside medium-term inflation assumed to converge to target widens the real gap. Near-term inflation thus raises long real yields rather than ten-year breakevens. This apparently counterintuitive combination reflects confidence in central-bank credibility.
Growth provided a different anchor. June cut projected 2026 real GDP growth from 2.4% to 2.2%, contradicting a simple explosive-growth-upgrade story. Yet the unemployment rate had not worsened sharply, productivity remained steady, and broad AI capital expenditure and strong technology profits demonstrated capacity to absorb expensive borrowing. Resilience may not explain most nominal-yield gains directly, but removes the case for precautionary cuts, allowing inflation to translate into higher-for-longer pricing.
Over a longer horizon, neutral real r* may be a structural factor. Productivity advances, large investment needs, persistent deficits and global safe-asset reconfiguration could raise the neither-stimulative-nor-restrictive equilibrium. But r* is unobservable and historical productivity–rate relationships noisy. The FOMC's median long-run funds projection remained 3.1%, unchanged from March. Subtracting a 2% inflation anchor implies only about 1.1% real neutral. Officials had not formally confirmed a materially higher neutral-rate regime.
Higher long real yields do not require matching policy rates
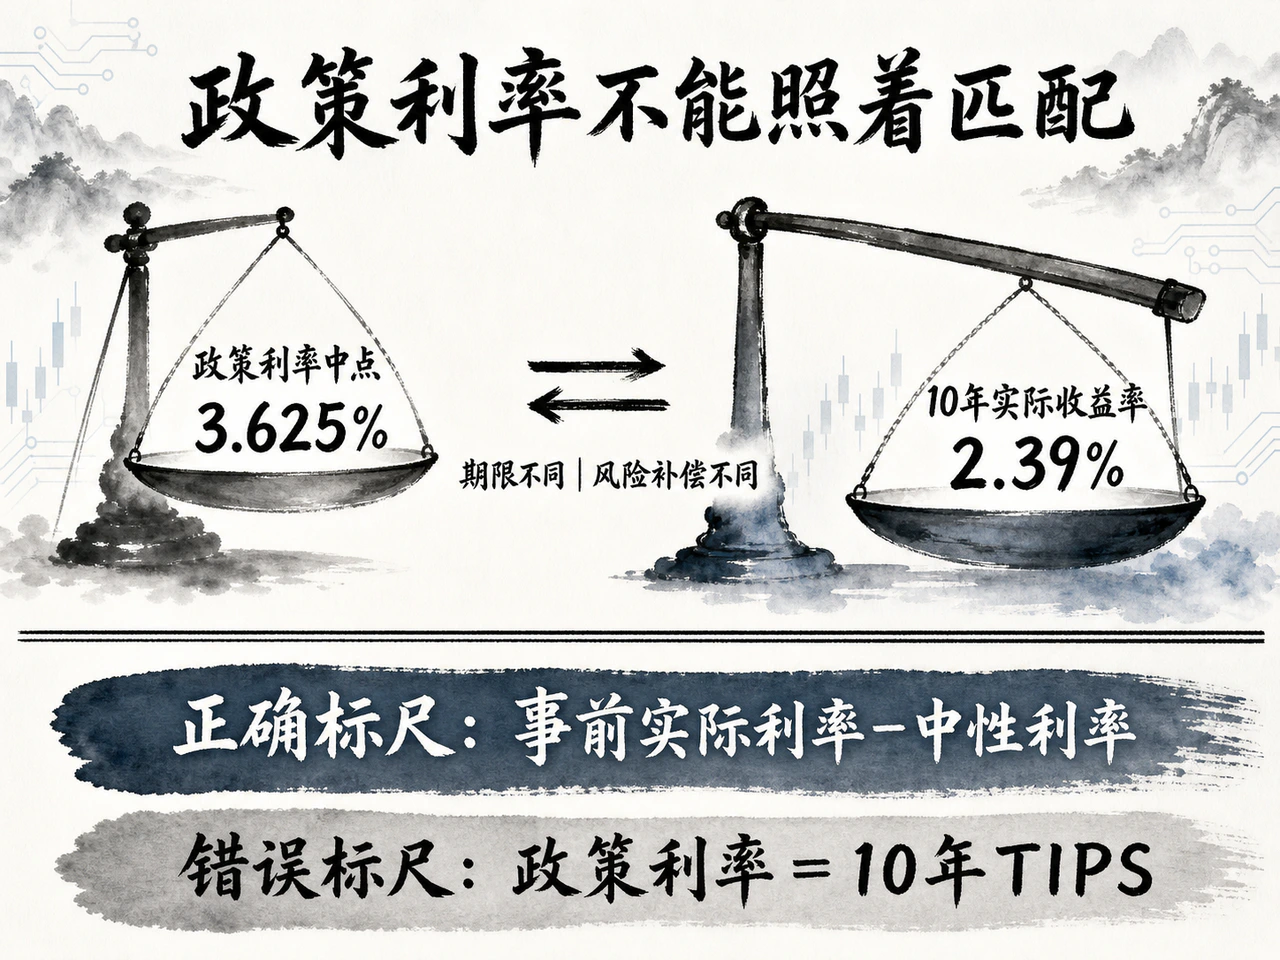
The Fed directly sets only overnight nominal rates. Ten-year TIPS reflect expected geometric-average real short rates over a decade plus real term and liquidity premiums or discounts. There is no theoretical or practical requirement that short policy and long real yields equalize. Treating the current 2.39% 10-year TIPS yield as the benchmark for today's real policy rate confuses maturity and risk compensation and risks dangerous overtightening.
The relevant calibration is ex-ante real policy relative to short-term neutral. The 3.50%–3.75% target has a 3.625% midpoint, but estimated restraint varies substantially with expected inflation. Deflating by the New York Fed July consumer survey's 3.6% one-year expectation gives a real rate near zero. Using Cleveland's August modeled one-year CPI expectation of about 2.39% gives approximately 1.2%. The same nominal rate can look below neutral or slightly above the long-run center depending on the inflation anchor.
This disagreement is at the heart of policy uncertainty, not simply a technical flaw. Consumer surveys are sensitive to gasoline and grocery costs, while market-based models embed liquidity premiums and asset-pricing assumptions. Policymakers cannot select a convenient measure. They must jointly assess wages, core-service persistence, demand, labor supply and demand, and multiple expectations measures to judge whether real policy sufficiently restrains renewed inflation.
Different drivers imply opposite responses. If higher real yields merely anticipate Fed hikes, the Fed need not follow mechanically to validate pricing. If fiscal supply or term premiums drive long yields, borrowing costs already tighten corporate issuance and mortgages; additional short-rate hikes risk double tightening. Policy has sufficient grounds to rise with equilibrium only if productivity, investment and fiscal expansion genuinely raise neutral, or renewed inflation and overheating clearly show inadequate restraint.
The reverse is equally direct. Falling expected inflation with unchanged nominal policy passively tightens ex-ante real rates. If employment and final demand weaken, the Fed will need timely nominal cuts to avoid self-tightening borrowing costs without an explicit hike. Its duty is to smooth inflation and employment cycles, not force policy to fit a predetermined curve shape.
A modest calibration risk, rather than severe policy misalignment
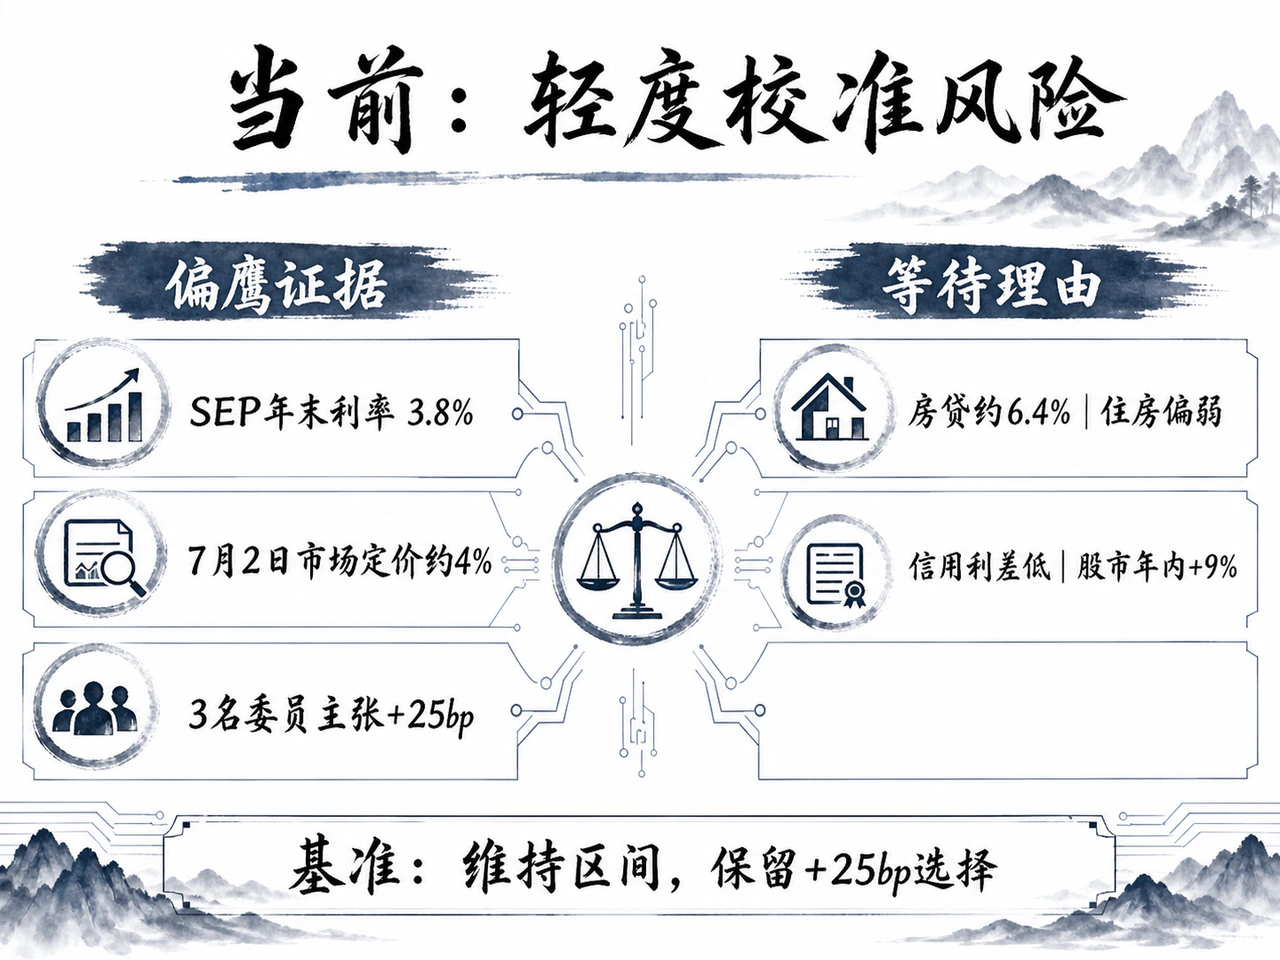
Hawkish evidence is accumulating. June's median appropriate year-end 2026 rate of 3.8% exceeds the current 3.625% midpoint. The July monetary report cited futures as of July 2 expecting effective year-end funds near 4%. Three July members favored a 25-basis-point increase. Current settings therefore differ moderately from official and market projections by roughly 25–40 basis points.
Actual inflation supplied no permission to ease. In the twelve months through May, headline PCE rose 4.1% and core 3.4%; July one-year consumer expectations remained 3.6%. Even if geopolitical energy pressure fades, shelter inflation peaks and trimmed-mean PCE is milder, officials cannot casually call the rise a set of automatically mean-reverting relative-price shocks. Renewed acceleration across core goods, nonhousing core services and wages would strongly justify a corrective 25-basis-point increase.
The constraint on hawkish impulses is the severe tightening already imposed at the long end. Ten-year TIPS at 2.39% are at multiyear highs, 30-year fixed mortgages near 6.4%, housing investment and existing sales depressed, and bank credit for smaller firms tight. Blindly lifting short rates would deepen contraction in already struggling rate-sensitive sectors.
The deeper reality is unusual K-shaped divergence rather than uniform liquidity tightening. Investment-grade and high-yield spreads remain near historical lows, major multinational blue chips access bonds readily, the S&P 500 is up about 9% for the year and AI infrastructure investment outpaces other sectors. High real yields coexist with easy funding for risk assets and large companies. Fragmented conditions give the Fed room to wait for evidence rather than choose a side immediately.
A prudent baseline is to maintain the restrictive 3.50%–3.75% range and retain a 25-basis-point hike option, rather than chase 10-year TIPS yields through repeated increases. Persistent core and trend inflation, strong payrolls and booming technology investment would justify adjustment to 3.75%–4.00%. If high long real costs instead broadly damage employment, consumption and non-AI private investment while expectations remain controlled, stabilization or discretionary cuts would prevent overtightening.
Being behind the curve should be judged by three observable signals: whether external energy and tariff pressure spreads into endogenous wages and core services; whether productivity and investment genuinely and durably raise neutral rates; and whether persistently high real borrowing costs begin broadly damaging jobs and final demand. A modest 25–40-basis-point calibration risk exists, but claims of severe market-policy disconnection and systemic failure overstate the evidence.


