On August 14, 2026, the closely watched US July retail report arrived. The Census Bureau's preliminary seasonally adjusted retail and food-service estimate was $763.6 billion, down 0.6% month on month, the first decline since October and the largest in nearly 14 months, well below the Reuters median of +0.1%. Preliminary August University of Michigan sentiment also slumped to 51.0. Weak data quickly reshaped near-term rates, cutting September hike odds to roughly 30%. Yet the official 10-year Treasury end-of-day yield rose five basis points to 4.68%. The curve showed an asymmetric contest: the short end accommodated policy patience, while the long end demanded compensation for rigid supply and real borrowing costs.
The cooling narrative began with August 7 payrolls: July employment fell 23,000 and May–June were revised down a combined approximately 103,000. CPI broadly matched expectations, while annual PPI inflation dropped from 5.5% to 4.7%. Friday's weak retail and sentiment reinforced slower final demand. Softer macro data restrained the tail risk of an immediate renewed hike, but elevated term premiums did not yield.
Bonds: The Short End Gives Ground; the Long End Demands Compensation
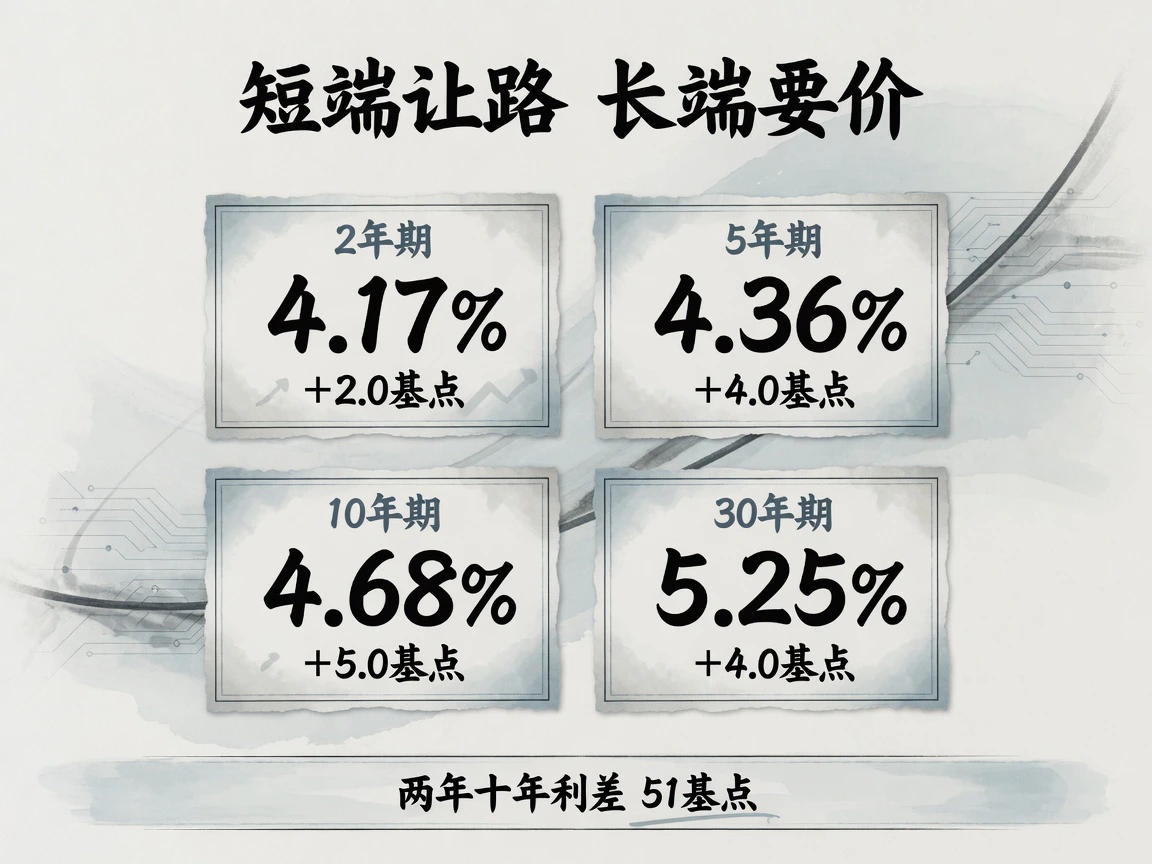
US Treasury daily par curve, official end-of-day close-to-close, August 14 versus August 13:
| Maturity | Close | Daily Change |
|---|---|---|
| 2-Year | 4.17% | +2.0 basis points |
| 5-Year | 4.36% | +4.0 basis points |
| 10-Year | 4.68% | +5.0 basis points |
| 30-Year | 5.25% | +4.0 basis points |
The curve bear-steepened markedly, with the two-year/10-year spread (2s10s) widening from 48 to 51 basis points. Three-month bills edged down one basis point to 3.86%. Short cash rates were almost flat, with upward pressure concentrated in five-year and longer maturities.
Weak retail briefly pushed yields sharply lower intraday, but afternoon US military statements on an indefinite blockade and comprehensive economic isolation of Iran reversed sentiment and lifted long yields. Reuters' retail report references to falling yields describe only the immediate intraday response, not official closing levels. Of the five-basis-point 10-year increase, roughly two came from real rates and three from wider inflation compensation. Ten-year TIPS real yields closed at 2.41%, with breakevens at 2.27%; five-year real yields were 2.12% and 30-year real yields 3.00%. The two-year's two-basis-point rise mainly tracked reduced immediate hike odds, while long maturities reclaimed reflation and primary-supply absorption premiums.
Against August 7 official closes, the week's curve clearly bear-steepened: two-year 4.19% to 4.17%, -2 bp; five-year 4.35% to 4.36%, +1 bp; 10-year 4.65% to 4.68%, +3 bp; 30-year 5.19% to 5.25%, +6 bp. The 2s10s spread widened from 46 to 51 bp and 5s30s from 84 to 89 bp. Cooling growth expectations constrained the short end, while large-auction clearing levels and a 3.00% 30-year real yield anchored the ultra-long end.
Primary supply was expensive. The $42 billion new 10-year issued August 12 stopped at 4.683%, the highest issuance cost since 2007, with a 2.53 bid-to-cover ratio. The August 13 $25 billion 30-year auction stopped at 5.216%, the highest since 2001, with 2.39 coverage and an 11.5% dealer allocation. Friday's secondary market reinforced Thursday's auction as a yield floor, taking the official 30-year close to 5.25%. Fitch maintained US sovereign AA+ that week while forecasting a 2026 general-government deficit of 7.4% of GDP. The rating held, but persistent deficits and rigid supply were fully reflected in prices.
Housing credit followed long discount rates. Existing-home sales released August 11 were just 4.06 million annualized, down 1.7% month on month. Freddie Mac's weekly 30-year fixed mortgage rate was 6.67%, around 70 basis points above prewar levels. High long financing costs kept resale activity frozen, and weak retail did not break that feedback loop.
The federal funds target remained 3.50%–3.75%, held by a 9-to-3 July 29 vote. Reuters cited CME FedWatch at approximately 69.4% for no change on September 15–16 and 30.6% for a 25-basis-point hike, down from Thursday's 33.9% and nearly 50% a week earlier. Across all remaining year-end meetings, cumulative implied odds of at least one more hike remained above 90%. Two-year yields were about 42 basis points above the policy ceiling, showing reduced immediate urgency but no case for cuts. Credit was calm: August 13 high-yield and investment-grade OAS were 271 and 79 basis points, respectively, historically narrow.
Cash Treasuries were closed for the weekend. CNBC's quote feed around 21:02 US Eastern on August 16 showed two-year 4.156%, five-year 4.348%, 10-year 4.684% and 30-year 5.257%, only off-hours liquidity references rather than official settlement changes. On the morning of August 17 Beijing time, 10-year futures were near 108.6875 and ultra-bond futures 109.03125, slightly above Friday. Last week's new three-, 10- and 30-year securities all settled Monday, allowing their first full repricing against the week's macro and geopolitical information. Early policy futures nudged September hike odds from 30.6% to near 32%, still leaving a hold as the baseline.
Macro: Retail Shifts Down a Gear; September Initially Favors a Hold
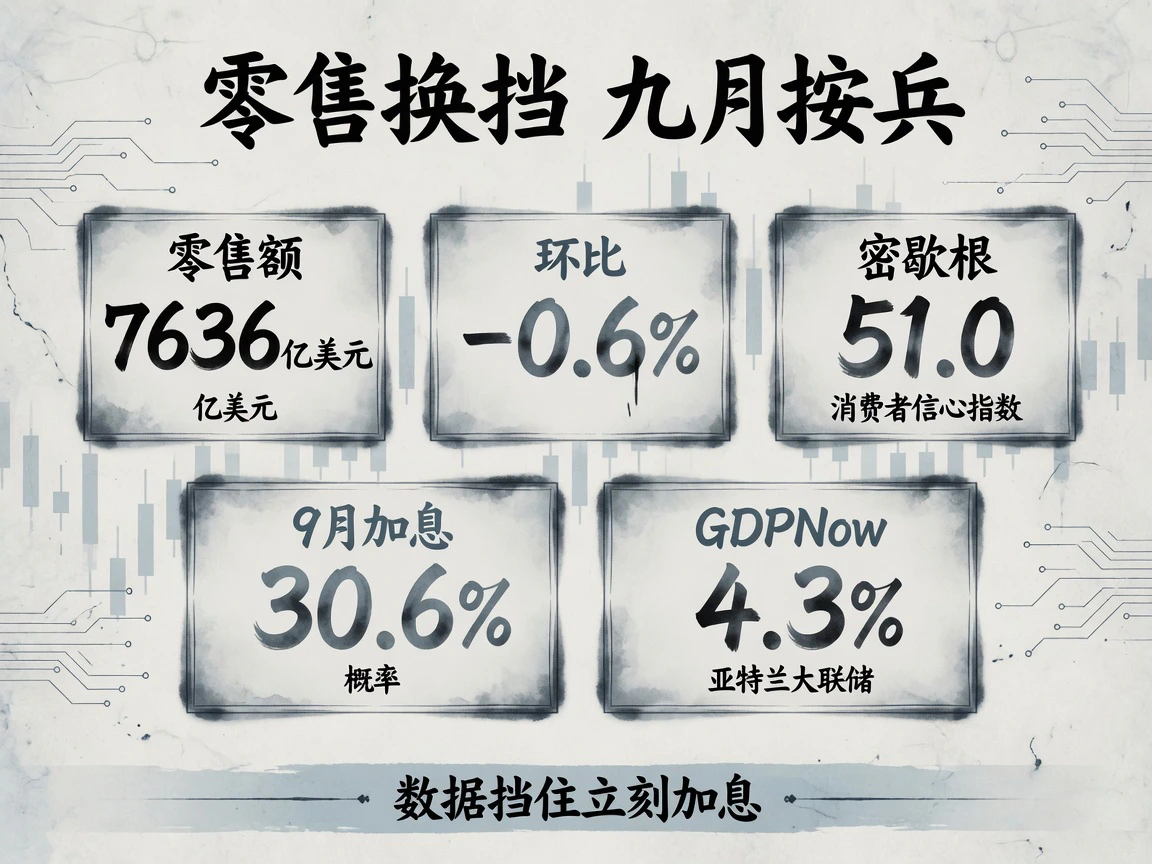
July retail cooling was uneven. Nonstore sales fell 2.2%, autos and parts 1.8%, and gas stations 0.9%; back-to-school clothing rose 1.9% and food services 0.5%. The Census Bureau stressed that these were preliminary nominal figures, unadjusted for inflation, with a monthly sampling error around ±0.4 percentage points. Sales still rose 5.0% year on year, and May–July combined grew 6.3%. With July CPI up only 0.1% monthly, Reuters judged the drop to reflect more real consumption contraction. Markets pointed to fading tax-refund stimulus and payback after Amazon moved Prime Day to June. Clothing and dining supported the base while online and auto sales pulled down the total, suggesting a shift after promotional timing changes and fading stimulus rather than a consumption collapse.
Goldman Sachs cut its third-quarter annualized real GDP tracker 0.5 percentage points to 2.2%. Some economists estimated annualized real private-consumption growth could fall from roughly 3.2% in Q2 to below 2%. Atlanta Fed GDPNow cut Q3 growth from 5.8% on August 6 to 4.3%, with consumption falling from 4.1% to 2.5%, while business investment remained near 15%. Investment alone was struggling to carry the economy as consumption shifted down. June business inventories were broadly flat and sales fell 1.1%, leaving the inventory-sales ratio at 1.30. Prior inventory rundown creates technical scope for restocking to support GDP, but under high living costs this does not necessarily improve household experience.
Preliminary August Michigan sentiment fell to 51.0, ending two months of recovery. Current conditions dropped to 51.8 and expectations to 50.6. One-year inflation expectations rebounded to 4.3%, with five-to-10-year expectations fixed at a concerning 3.3%. Only 8% of households expected income to outpace prices over the next year. Oil and geopolitics continued dominating household experience: regular gasoline hovered near $4 a gallon versus about $2.98 before the war. Rate futures used these sequential cooling indicators to support a September hold.
The reduced September hike weight was driven entirely by weak data. July's 9-to-3 split remained: Cleveland's Hammack, Minneapolis's Kashkari and Dallas's Logan firmly favored a 25-basis-point hike. Richmond's Barkin viewed tariff, oil and AI-investment price impulses as temporary supply shocks; Hammack and others worried that another three or four years to reach 2% could entrench long-term expectations. Kevin Warsh had remained unusually silent. August 19 minutes would provide the first complete account of policy debate under him. Data closed the route to an immediate September hike but fell well short of the employment collapse or deflation needed for immediate cuts. A hold was the baseline, while one hike by year-end remained an option: energy inflation stayed in double digits, long expectations at 3.3%, and June's median dots still showed one hike.
No other major official US macro release had arrived before cutoff. Abroad, Japan's preliminary Q2 annualized real GDP growth was +1.1%, below Reuters' +2.0% consensus. Private consumption was nearly flat and business equipment investment fell 1.2%. This was insufficient to displace the US-centered global narrative. This week's focus turns to Empire State manufacturing, housing starts and permits, industrial production and Wednesday August 19's July FOMC minutes.
Commodities: Oil Retains a Premium; Gold Follows Policy
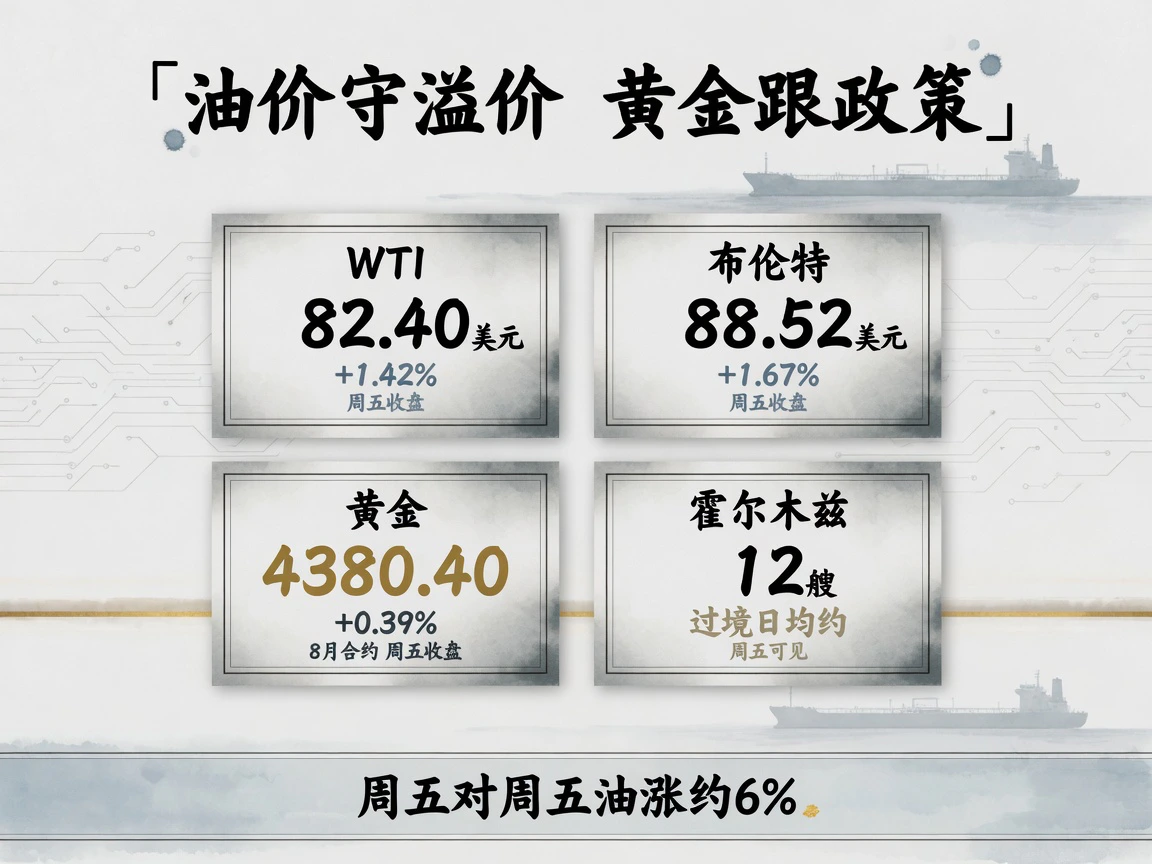
Oil bought back the earlier geopolitical supply-premium retreat over the week. Inventory reports briefly tested longs, but forceful blockade language supported prices. Continuous front-month WTI closed August 7 at $78.18 and Brent at $83.55, then jumped early in the week to $82.13 and $87.72. Friday WTI rose 1.42% to $82.40 and Brent 1.67% to $88.52. Friday-to-Friday gains were 5.4% and approximately 6.0%, mostly from the opening gap between the prior Friday and Monday. Brent's quality and transport spread over WTI widened from $5.37 to $6.12.
Friday's main question was how long the blockade would last. Defense Secretary Hegseth said the US could maintain it indefinitely; Bessent previewed unprecedented economic-isolation sanctions the next week. Kpler recorded only two Hormuz crossings Friday and no crude tanker. August traffic averaged around 12 a day versus more than 130 prewar. In contrast, EIA reported a 17.4 million-barrel US commercial crude build and exports down to the wartime low of 3.06 million bpd. Those would normally hurt prompt crude, yet prices held in an $80–$90 range, below early-war panic but above levels expected with full reopening. The extreme tightness lay in refined products: US crude tanks were not empty, but seaborne fleets and refinery export networks lacked clean fuels available for immediate delivery.
Gold closely followed Fed expectations. August COMEX gold closed Friday at $4,380.40 an ounce, +0.39%, up 0.91% from August 7. It rose despite the five-basis-point 10-year yield increase, supported by the dollar index at 99.67, down 0.29%, and September hike odds falling from approximately 50% to around one-third. Cooling retail and a weaker dollar dominated; the opposing chain from higher oil through inflation to Fed tightening did not lead that day's trading.
After Sunday electronic reopening, early August 17 Beijing-time WTI was near $82.06 and Brent $88.49, almost flat. Gold's snapshot at $4,453.5 was close to the active December contract, whose Friday settlement was $4,437.30. This must not be confused with the August contract's $4,380.40. SPR stocks had fallen further to 298.7 million barrels, the lowest since January 1983. Observable Hormuz registrations again reached zero Sunday, but oil stayed near $82/$88.5. Friday had already absorbed indefinite-blockade and tanker-attack sentiment; weekend traffic merely confirmed the same narrative.
Equities: Only a Small Step Back from Records
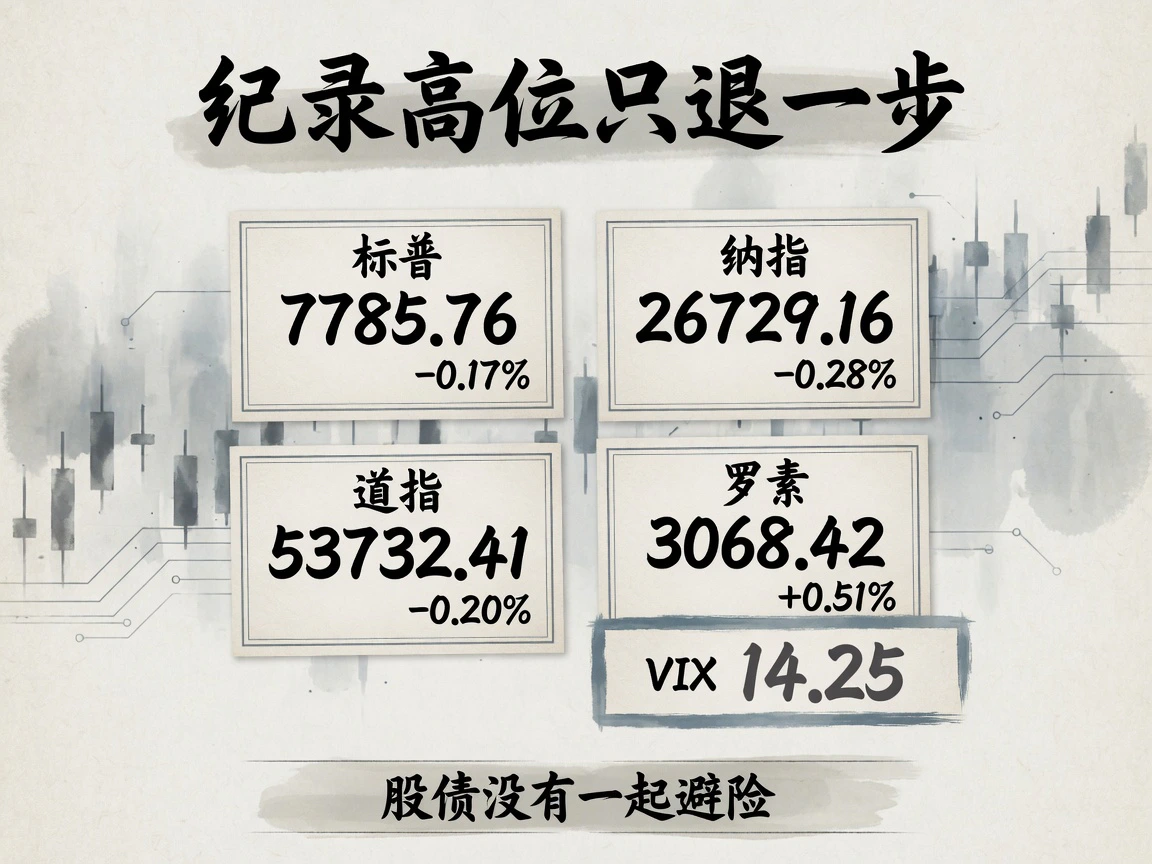
The S&P 500 eased 0.17% to 7,785.76, only 13.23 points below August 13's record close. The Nasdaq Composite fell 0.28% to 26,729.16 and the Dow 0.20% to 53,732.41, while the domestic-cycle Russell 2000 rose 0.51% to a new record 3,068.42. VIX fell 2.60% to 14.25. Exchange volume was approximately 9.6 billion shares versus a 20-session average near 17.4 billion. Advancers led about 1.1 to 1; 15 S&P stocks made 52-week highs and one a low. Stocks and bonds did not jointly seek safety: equity implied volatility remained suppressed while long Treasuries sold off.
The modest retreat centered on semiconductor equipment and major chips that had already doubled this year. Applied Materials fell 5.1% on heavy volume despite quarterly revenue of $9.12 billion, +25% year on year, and Q4 guidance near $10.25 billion. Attention shifted to remaining gross-margin expansion and whether high long discount rates would force a broad compression in technology multiples. Broadcom fell approximately 5.9%. Energy rose around 1.4% with oil, while XLK lost 0.40%. Reddit jumped roughly 13% after announcing its inclusion in the S&P 500.
LSEG counted approximately 456 S&P 500 reporters as of that week, with about 85% beating forecasts. Capitalization-weighted Q2 net profit growth was approximately 52% year on year, or around 32.7% after removing some unusual fair-value gains. The S&P had risen roughly 14% this year. Reuters-cited bank card data showed wealthier and older households converting expanding balance sheets into consumption. Forward P/E was near 20 versus 19 in late July, with valuation expansion resting heavily on an approaching end to tightening and a more moderate future rate path.
Weekly equity performance remained broadly positive. From August 7, the S&P 500 rose 0.36%, Nasdaq 0.14% and Russell 2000 1.12%, while the Dow fell 0.56%; the S&P and Nasdaq gained for a third week. Energy ETF XLE rose 7.7% and technology XLK 1.1%. EPFR showed approximately $2.58 billion entering US equity funds in the week through August 12, including $8.78 billion into large-cap growth, while technology sector funds lost $4.62 billion. Broad allocation capital kept buying a core US equity position, but showed reluctance and profit-taking in expensive, high-beta semiconductor exposure.
Asia-Pacific closes preceded US cash trading. Nikkei 225 rose 0.59% to 68,713.80, up about 4.7% for the week; KOSPI gained 2.42% to 6,977.94, up approximately 11.5%; Hang Seng fell 1.10% to 25,116.85, down about 2.15%. High semiconductor exposure continued leading, while offshore Chinese assets faced discounts. At cutoff, US futures edged higher, with S&P near 7,810 and Nasdaq around 30,196, up only a few points. Tokyo opened near flat after weaker Q2 GDP. The blockade and tanker attacks anchored premiums in prompt oil and cracks, but low equity volatility showed no market-wide systemic flight from risk.


