A compelling narrative has emerged around Treasuries: foreign official and private holdings fell in June, with Japan, the UK and mainland China all reducing exposure, while enormous US deficits keep issuance rising. Retreating foreign buyers meeting a fiscal supply wave seems a ready explanation for multiyear-high long yields.
The narrative conflates three different things: month-end holdings changes and actual transactions; nominal financing totals and duration supply; and long-yield pricing levels and one month's cross-border flows. Separating definitions produces a very different picture.
Foreign Treasury holdings did fall $72.1 billion in June, but foreigners were small net buyers of long Treasuries. Most incremental net issuance over the past year concentrated in bills; 20- and 30-year net supply actually declined. These distinctions matter precisely because yields remain high. The central question is no longer simply whether buyers exist, but what compensation marginal buyers demand for duration as liquidity preferences change.
1. Demand: Lower reported holdings do not mean collective foreign selling
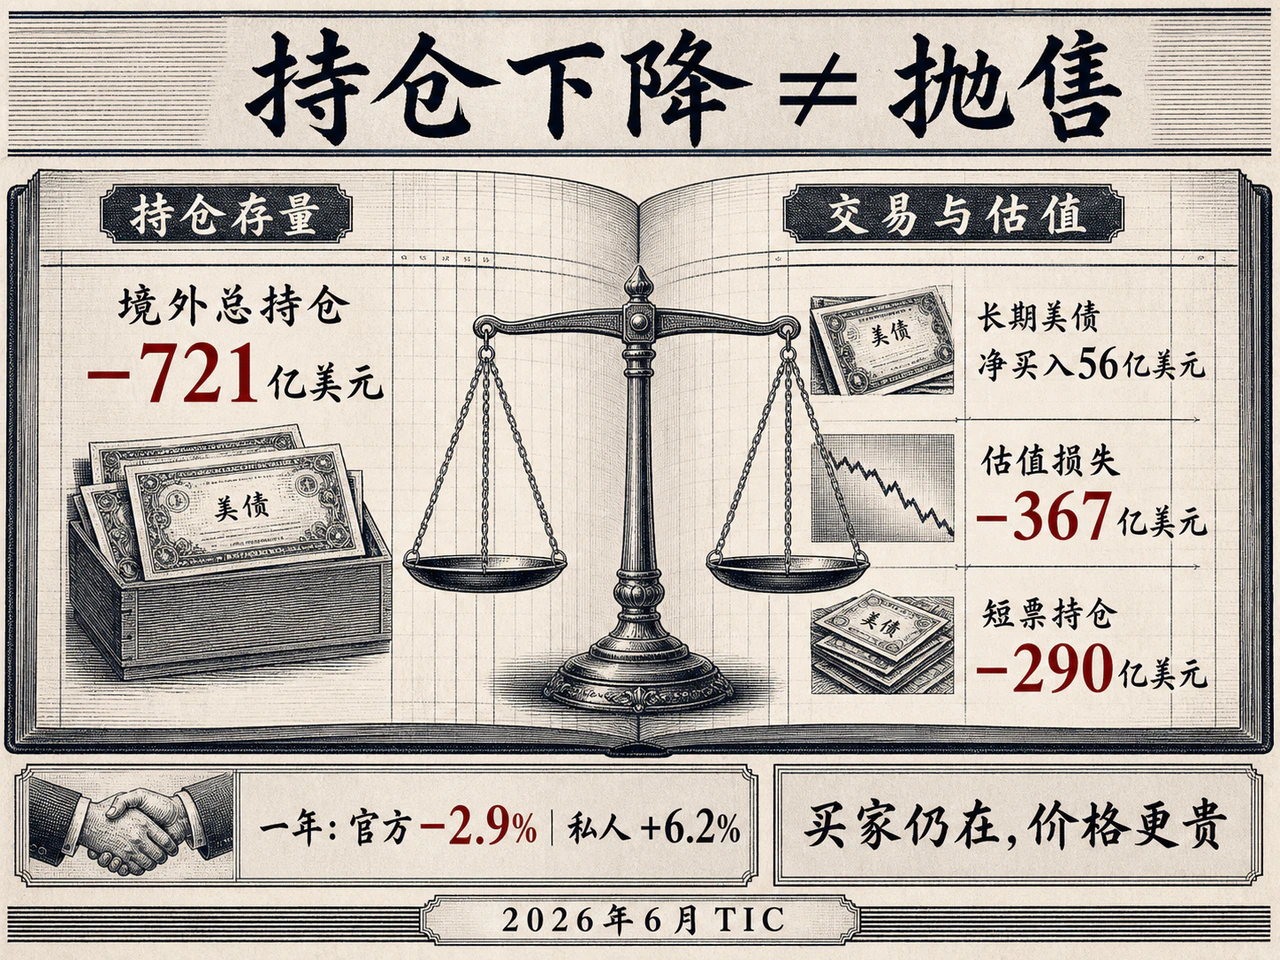
The Treasury's Major Foreign Holders table shows total holdings falling from $9.3711 trillion in May to $9.2990 trillion in June, down $72.1 billion. Japan, the UK and mainland China declined $26.4 billion, $8.7 billion and $25.9 billion respectively, around 85% of the total fall. The table alone can suggest coordinated withdrawal.
TIC month-end holdings are market-value stocks, not net cross-border flows. Treasury long-term securities details show June foreign long-Treasury market value down about $43.1 billion, including $36.7 billion in valuation losses and $11.9 billion in other nontransaction adjustments, while actual transactions were net purchases near $5.6 billion. Foreign bill holdings fell about $29 billion. Rising yields themselves lower bond prices, creating reverse causality: much of the holdings decline resulted from higher yields rather than selling causing them.
Country behavior differed. About $23 billion of Japan's decline was in cash-like bills, with only $3.8 billion of long-bond net sales. UK long holdings fell about $10.8 billion, but valuation losses accounted for $10.1 billion and actual net sales were only $4.1 billion. London is a global custody and management center influenced by multinational flows. In June, mainland China sold about $15.8 billion of long securities and reduced bills about $6.2 billion, showing clearer active adjustment.
Even country labels cannot reveal who sold or why. TIC uses immediate holders and custody locations, not ultimate beneficiaries or necessarily central banks. China's broadly stable reserves and declining Treasury holdings combine diversification, maturity/liquidity management, custody migration and commercial allocation. UK data mix sovereign funds, bank market-making and leveraged hedge funds. Japan's front-end reduction fits yen-related liquidity management, not necessarily strategic abandonment of US long sovereign credit. Calling these heterogeneous choices coordinated long-bond selling misstates trading reality.
Sector detail clarifies the picture. June foreign official holdings fell about $69.9 billion, versus just $2.2 billion for private holdings. Actual long-Treasury trades showed official net sales near $9.8 billion and private net purchases near $16.6 billion. Over a year, official holdings fell about 2.9% and private holdings grew 6.2%; total foreign holdings increased $205.4 billion, about 2.3%.
This is a migration in buyer composition rather than a cutoff of global liquidity. Official reserve managers prioritize safety, immediate liquidity and intervention capacity, with less sensitivity to short-term spreads. Private funds, banks, pensions, insurers and leveraged traders compare Treasuries with repo, high-grade credit, other sovereigns and FX hedging costs. Fed research shows foreign ownership of marketable Treasuries falling from about 55% during the 2008 crisis to about 32% at end-2025, staying just above 30% since 2020. Fiscal expansion outpacing reserve growth leaves more supply for domestic institutions and foreign private balance sheets.
The constraint is a shrinking share of official buyers willing to expand at low rates regardless of short-term cost. June TIC was released only in mid-August—August 17 this time—so it cannot explain an individual mid-August trading swing. It is a medium-term variable: as marginal pricing shifts toward sensitive private capital, compensation required to absorb duration, the term premium, necessarily rises.
2. Supply: How $906 billion of additional bills reshaped maturities
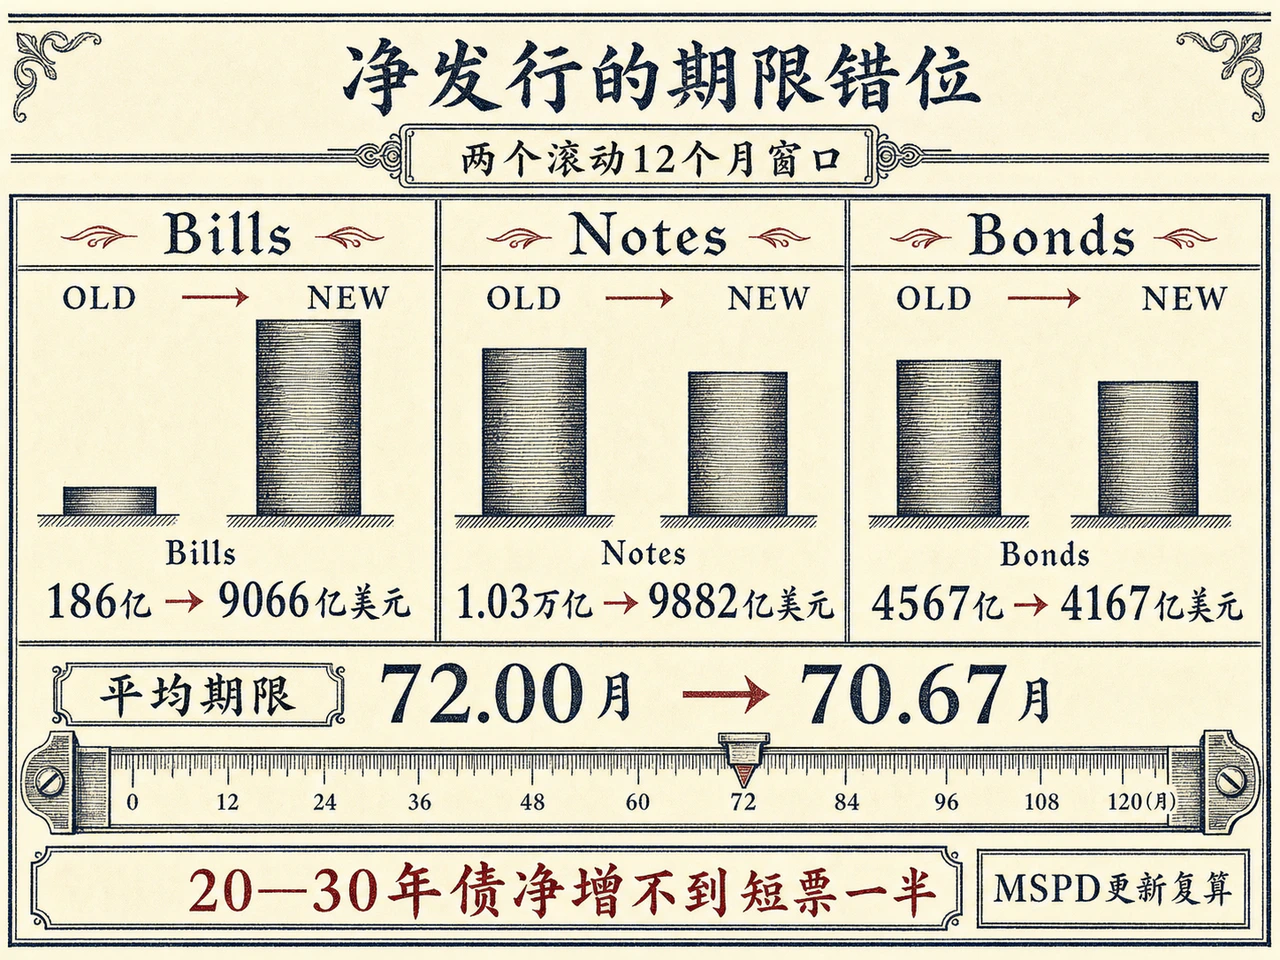
Many blame high yields on excessive long issuance. Following CME's June 25 research on rolling net issuance/GDP and recalculating from Treasury's end-June public debt data reveals the opposite. Over the 12 months through June 2026, publicly held bills increased about $906.6 billion, around 2.9% of nominal GDP, versus only $18.6 billion in the prior 12 months. Net issuance of 2–10-year notes fell from about $1.03 trillion to $988.2 billion, while 20- and 30-year bonds fell from $456.7 billion to $416.7 billion.
Shorter issuance coincided with lower average maturity. Unrounded third-party figures fell from 72.00 to 70.67 months; official rounded quarterly figures from 72 to 71; security-level weighted calculations from 72.3 to 70.6. Minor decimal differences do not alter the clear shift of marginal funding toward the front end.
Three definitions are essential:
First, these figures measure year-on-year changes in month-end debt held by the public, not gross auction issuance or financing only from private commercial buyers. The public definition includes Fed accounts.
Second, narrowly defined 20- and 30-year nominal long-bond net supply was less than half the bill increment and down nearly 9%. Combining 2–10-year notes and bonds as medium/long fixed-rate debt gives about $1.405 trillion, still above bills but not accelerating uncontrollably.
Third, bills supplied about 37.4% of the $2.427 trillion rise in all publicly held marketable debt. Notes, bonds, TIPS and FRNs still rose by about $1.521 trillion combined. The Treasury has not stopped issuing long debt. Additional marginal deficit funding was almost entirely absorbed by bills, while medium/long fixed supply stayed high without expanding recklessly at the margin.
The pattern continued into third-quarter 2026. Treasury projected $739 billion in private marketable net borrowing for July–September. TBAC recommendations included about $409 billion in bills and $375 billion in coupon net issuance, alongside about $45 billion in liquidity-support buybacks. August's refunding statement said nominal coupon auction sizes would remain unchanged for at least several quarters. Treating the whole $739 billion as an imminent long-bond flood contradicts the official breakdown.
Bills protect the regular-and-predictable reputation of coupon issuance. Frequently changing 10-, 20- or 30-year auctions with taxes, spending and cash balances would weaken dealer liquidity support and abruptly release duration risk. Weekly bills have minimal duration and price risk and naturally absorb seasonal fiscal swings. This is maturity management rather than speculation on the next cut.
TGA rebuilding after the 2025 debt-ceiling resolution amplified rolling bill changes. Restrictions had suppressed borrowing and depleted cash. After July 2025's adjustment, rebuilding became urgent: TGA rose from about $457 billion at second-quarter end to $891 billion at third-quarter end, with about $613 billion of bill net issuance that quarter. A low base and concentrated replenishment drove the rolling 12-month increment from $18.6 billion to $906.6 billion.
Bills also found natural buyers in money funds, bank liquidity reserves and corporate cash. Fed reserve-management purchases and reinvestments through early July, nearly $250 billion, chiefly targeted bills under one year to maintain ample reserves. That liquidity balanced money markets without absorbing 20- or 30-year duration.
At end-July, bills were about 22.2% of marketable debt, close to TBAC's roughly 22% long-run center and far below the historical crisis peak of 36%. Average maturity of 70.67 months also exceeded June 2020's compressed 62 months. The shift deserves monitoring but is far from early-pandemic forced short-termism.
There are costs. Rapid bill turnover requires frequent large refinancing and transmits high Fed rates faster into federal interest expense. Deferring duration release transfers refinancing and rate risk forward. Balancing predictable issuance, capacity, immediate cost and rollover risk is tactical liability management, not simply stealth QE.
Each dollar of 30-year debt embeds tens of times the rate risk of an ultrashort bill. The $416.7 billion net increase therefore still matters for prices despite being smaller than bills. It nonetheless disproves a single explanation based on a massive current expansion of long supply.
3. Pricing: Short and long yields rise for increasingly different reasons
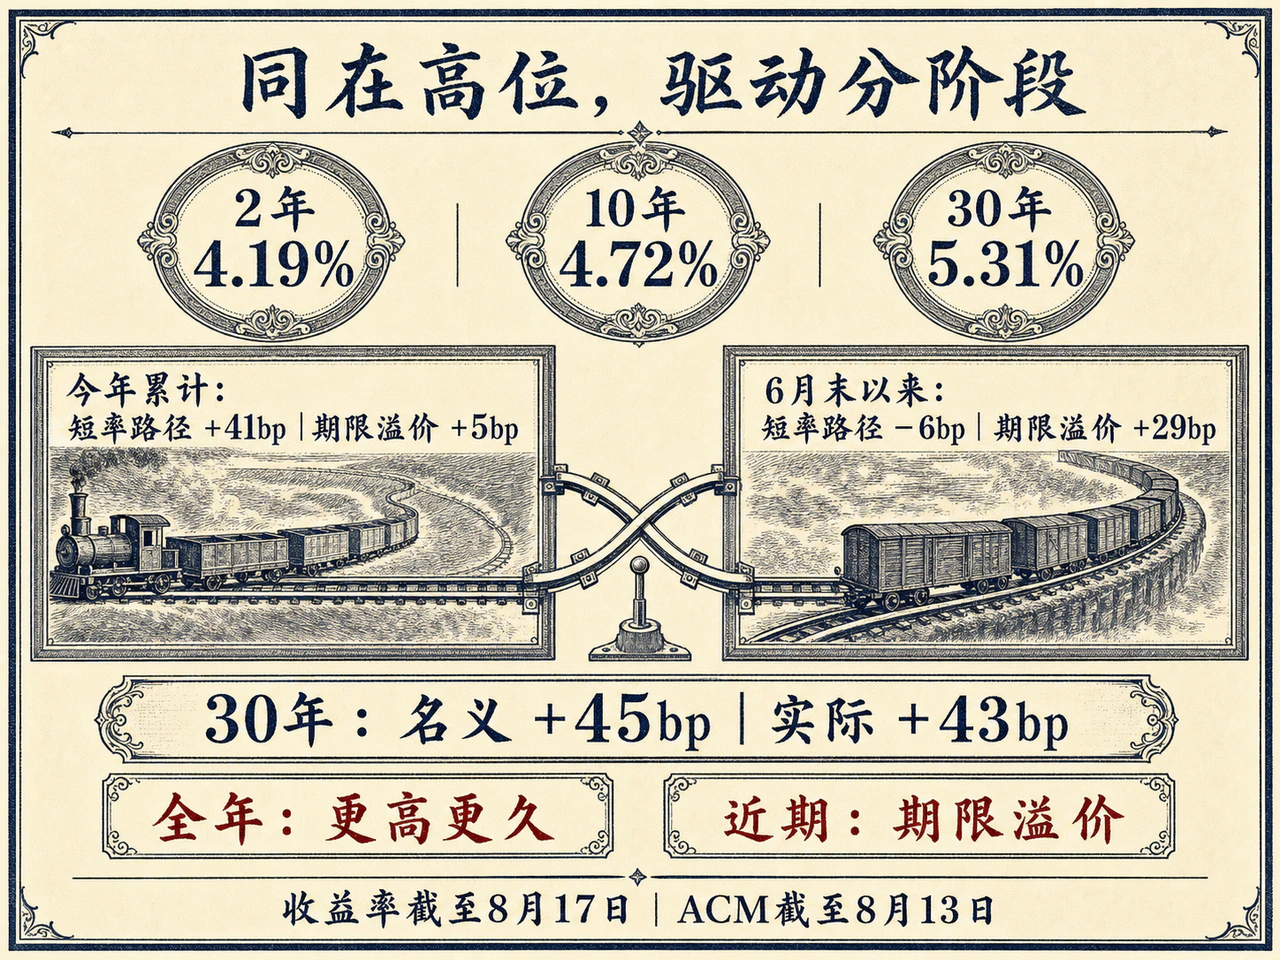
On August 17, 2-, 10- and 30-year yields were 4.19%, 4.72% and 5.31%, up about 72bp, 53bp and 45bp from the first trading day of the year. The curve's rise cannot simply be summarized as too many bonds and insufficient demand.
At the short end, core inflation and activity calibrate expectations of the Fed's response and future target path; expected average short rates anchor the 2-year. July's FOMC held 3.50%–3.75%, emphasizing solid growth and inflation still too high. Without sustained declines in core inflation persistence, wage growth and real private consumption, markets hesitate to price deep easing, keeping 2-year yields firm.
Expectations are not an empty tautology: the modeled short-rate path maps inflation, potential growth, employment and financial conditions through policy rules. Bill-supply fluctuations affect repo, overnight spreads and local liquidity at the margin, but with ample money-fund demand and Fed absorption they are not the central driver of 2-year yields.
Long yields combine expected average future risk-free short rates over the bond's life and a term premium for committing capital and bearing duration. The New York Fed ACM model for the 10-year yield shows different drivers over two horizons:
From end-2025 to August 13, the fitted 10-year yield rose about 46bp: expected short rates contributed 41bp and term premium only 5bp. Over the year, higher-for-longer policy repricing dominated, reflecting resilient fundamentals forcing acceptance of a higher real neutral-rate level.
From June 30 to August 13, the picture reversed. The fitted 10-year yield rose about 23bp, while the short-rate component fell about 6bp and term premium rose around 29bp. Since midsummer, the dominant driver shifted from possible continued Fed tightening to sharply higher compensation for holding long duration.
Real yields corroborate this. From year-start to August 17, the 30-year nominal yield rose from 4.86% to 5.31%, or 45bp, while its real TIPS yield rose from 2.63% to 3.06%, or 43bp. Breakeven inflation widened only around 2bp. The 10-year showed a similar pattern. High long yields therefore reflected repriced real returns and duration compensation rather than runaway inflation expectations or currency debasement.
Why did term premium rise without a current supply surge? Long bonds price accumulated debt and medium-term supply, not one recent auction. Structural deficits ensure steep debt growth, and duration postponed through bills will return when coupon sizes must rise. TBAC had warned of roughly $1.45 trillion of funding gaps in fiscal 2027–2028 under current coupon sizes and private bill capacity. Dealers widely expected coupon increases in 2027. With less price-insensitive foreign official demand and more private duration absorption, investors demanded compensation now. Recent Fed research also linked rising forward real risk premiums to deficits, sustainability concerns and supply shocks, without unanchored long inflation expectations.
Higher term-premium yields do not mean lost buyers or failed auctions. August's 30-year auction had a solid 2.39 bid-to-cover, indirect bidders including foreign central banks and asset managers took 66.8%, and primary dealers only 11.5%. Capital still entered smoothly, but at a higher clearing yield under supply and refinancing pressure. Stable buying and high rates are two sides of market clearing.
The phased interpretation is clear. Short rates remain tied to growth, inflation and Fed policy. The long end's full-year foundation also reflects higher terminal policy and real neutral rates. Since midyear, however, renewed gains have come from term premium pricing rigid deficits, future duration supply and private marginal-buyer compensation. Excess bills affect money-market rates and future rollover risk; long debt prices actual duration absorption. A sudden current-year long-supply surge is not a sound explanation for this persistent long-yield rise.
Sustained long-yield declines require two conditions together: convincing continued cooling of core inflation, labor costs and final private demand that lowers expected Fed rates; and orderly fiscal and coupon-supply expectations with consistently comfortable auction absorption that reduces term premium. Mild cuts under political or liquidity pressure, without fiscal repair or reduced inflation persistence, may produce only short-end rallies while the long end stays high, steepening the curve again.
Policy should not mechanically interpret rising 10- or 30-year real yields as a higher neutral rate and add tightening. A term-premium surge itself restrains financial conditions. An additional policy response is warranted only when higher long yields coincide with unanchored inflation expectations, renewed credit and demand overheating and a threat to price stability. If the rise comes only from fiscal imbalance and duration-risk compensation, following with hikes adds damage through double tightening.


