For more than a decade, comparisons between dim sum and dollar bonds have often rested on a mismatch: a 2.5% offshore renminbi coupon versus a 4.7% dollar-bond yield naturally makes the latter look superior. But this assumes either no exchange-rate risk or costless hedging. Neither premise holds on a real trading desk.
Most institutional investors use a simpler practical framework: borrow renminbi for renminbi assets and dollars for dollar assets, eliminating net currency exposure. Under strict same-currency asset-liability management (ALM), most of the nominal spread of more than 200 basis points disappears before the meaningful comparison begins.
Within matched-currency liabilities, dim sum bonds are an indispensable domestic-currency benchmark for the RMB pool rather than merely an alternative to dollar bonds. They can offer carry of a similar magnitude with materially lower volatility, while this August added a key missing hedge. What they cannot yet replace is the dollar market's vast capacity, continuous credit spectrum and deep secondary liquidity. These set the objective ceiling on substitution rather than invalidating it.
1. Comparing correctly: Most nominal spread reflects policy differences rather than excess return
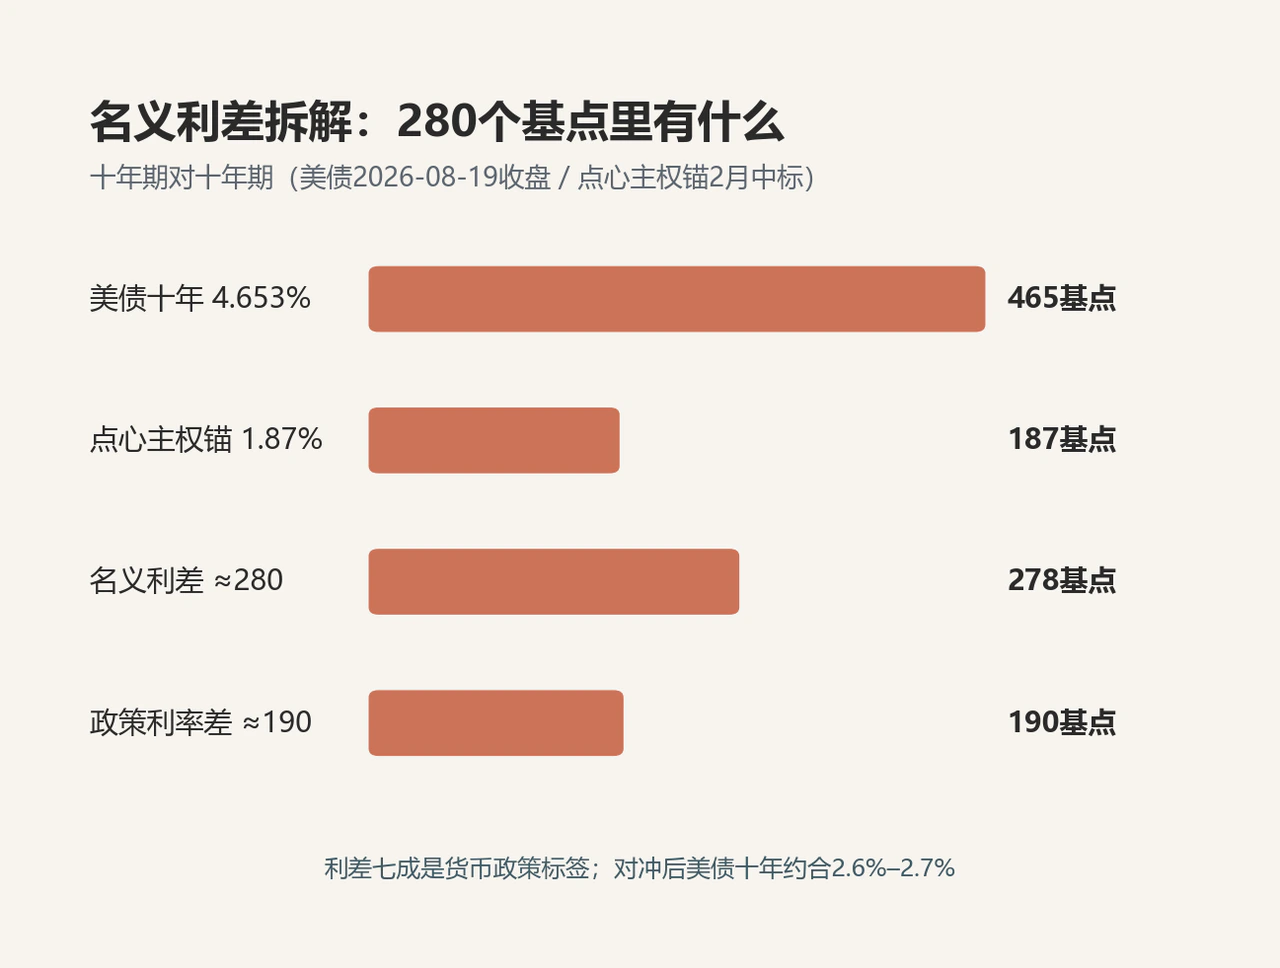
At the August 19, 2026 close, Treasury yields were 4.168% at 2 years, 4.353% at 5, 4.653% at 10 and 5.194% at 30. China's 10-year was around 1.68%; the Finance Ministry's February Hong Kong 10-year offshore RMB sovereign issue cleared at 1.87%. Comparing 10-year sovereigns gives the dollar benchmark about 280 basis points more. Even against the Bloomberg Dim Sum Bond Index investment-grade static coupon of 2.53%, the reported difference exceeds 210 basis points.
That spread must first be decomposed. Dollar liabilities face a 3.50%–3.75% federal funds range and SOFR near 3.63%, versus one-year CNH HIBOR of 1.70% on August 18. Monetary-policy and benchmark-funding differences alone account for around 190 basis points. Roughly 70% of the nominal spread is therefore the price of different sovereign policy cycles, rather than free alpha.
Covered interest parity (CIP) means the dollar's forward discount against CNH broadly reflects that rate gap, with a one-year currency hedge costing around 2 percentage points. An RMB-funded institution buying 10-year Treasuries and hedging back through forwards or swaps would obtain only around 2.6%–2.7% in RMB. Cross-currency basis and trading friction leave little difference from high-grade dim sum bonds. The reverse, a dollar investor hedging dim sum purchases, likewise offers no free gain.
Nominal coupons without reference to liability currency are meaningless for investment. The useful comparison returns to four same-currency dimensions: carry, volatility and drawdowns, credit capacity and spectrum, and hedging tools and liquidity.
2. Same-currency accounts: Carry remaining in each pool
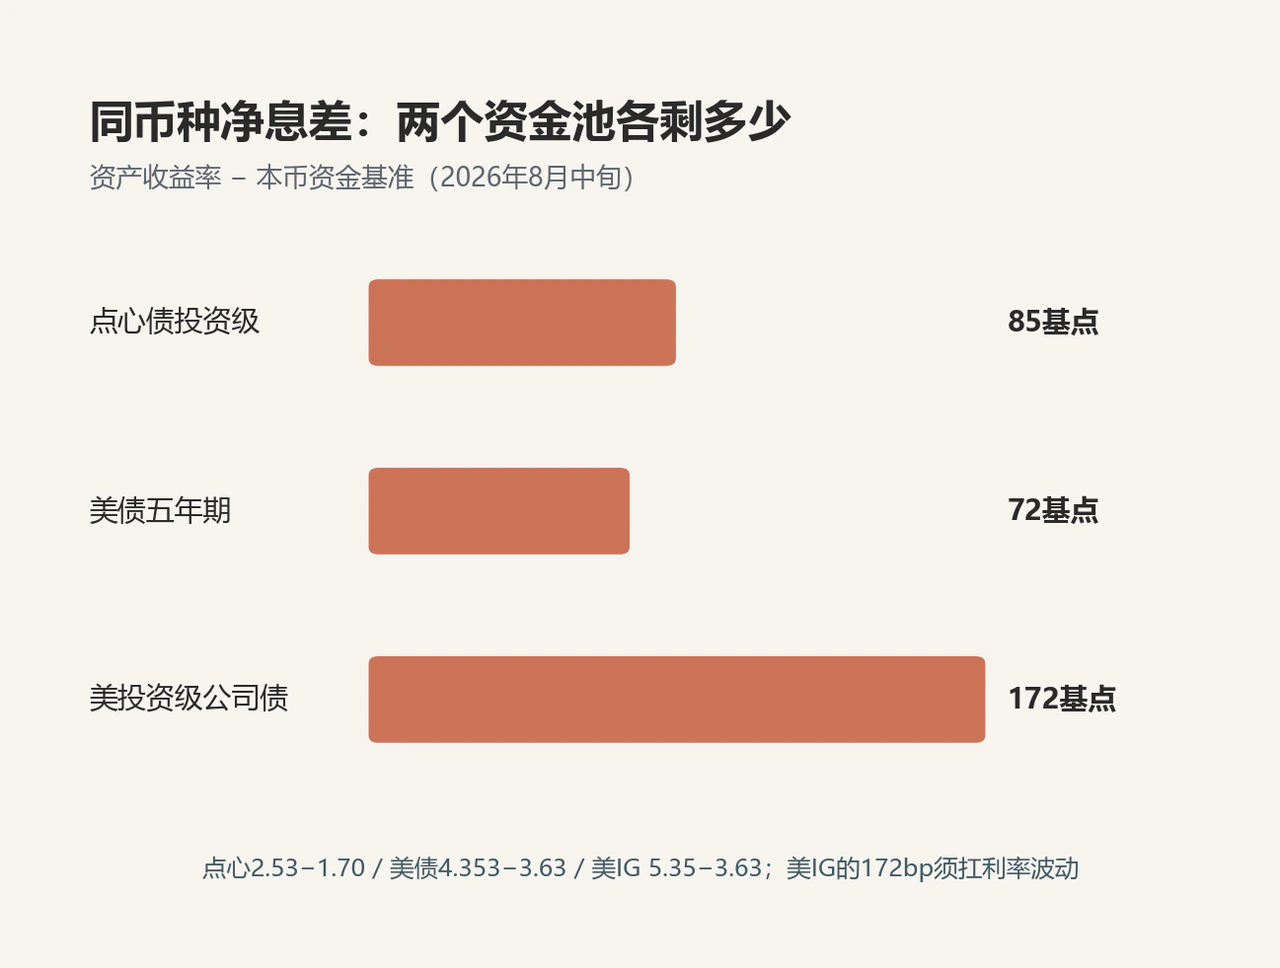
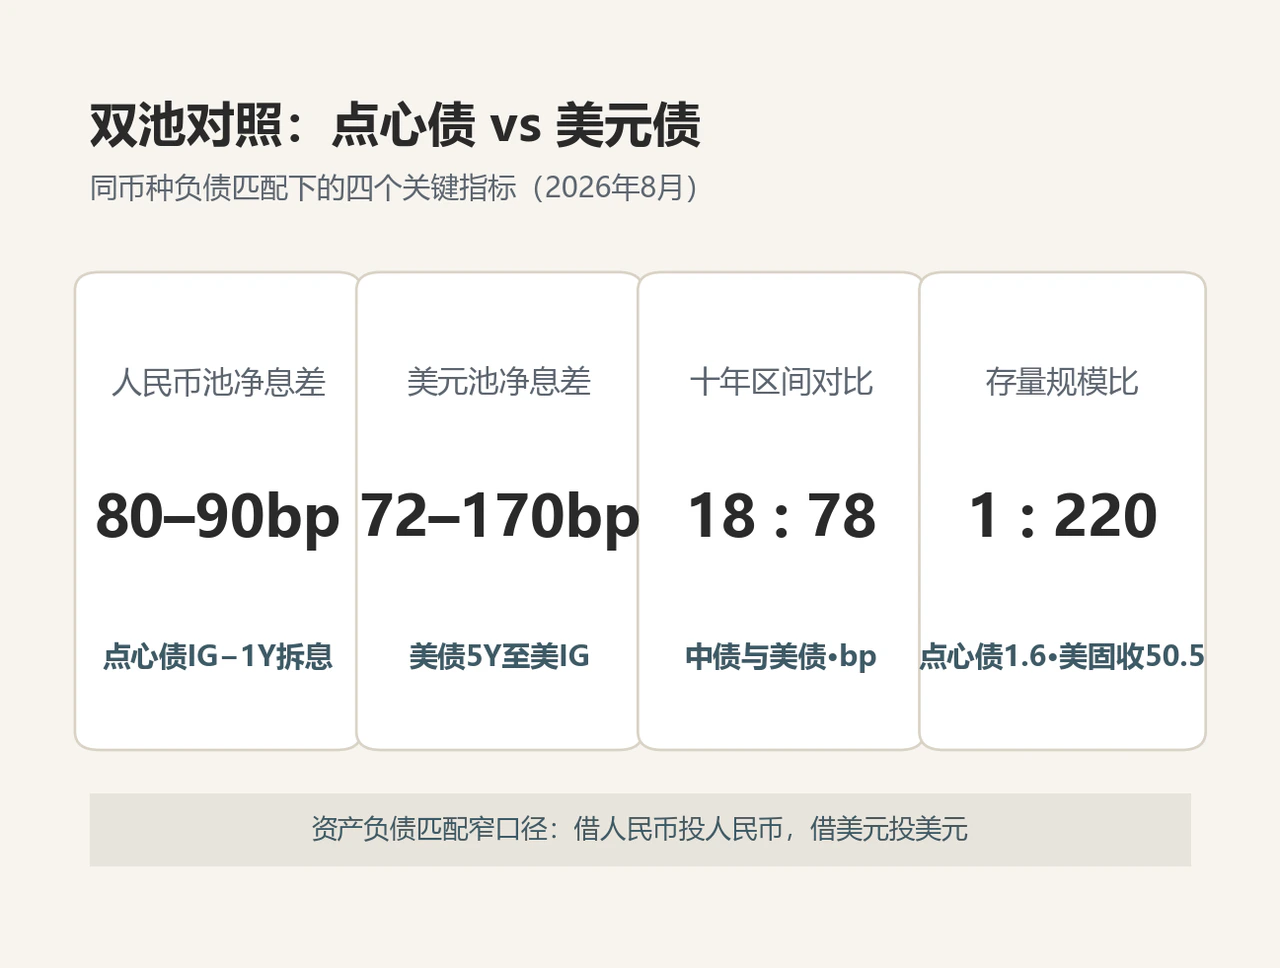
Start with dollars. By mid-August, asset yields were 4.353% for 5-year Treasuries and 5.35% for the ICE BofA US Corporate Index, including 5.60% for BBB and 7.08% for high yield. With SOFR near 3.63% as the short-funding anchor, static carry was around 72 basis points for 5-year Treasuries and 170 for investment-grade corporates. The latter excludes capital costs and expected credit losses. Investment-grade OAS was only 82 basis points and high-yield OAS 275, both historically tight, leaving fragile buffers for defaults or widening spreads.
For the RMB pool, the Bloomberg Dim Sum investment-grade static coupon was 2.53% in January–April 2026. Newly issued offshore sovereign yields were 1.57% at 5 years and 1.87% at 10. One-year CNH HIBOR was around 1.70% and three-month 1.62%. Investment-grade dim sum bonds offered around 80–90 basis points of static carry. Sovereigns alone could produce negative carry, with 1.57% against 1.70%, meaning credit premiums and moderate duration drove nearly all the pool's spread return.
The comparison differs from intuition. RMB investment-grade carry of 80–90 basis points matches dollar government-bond carry near 72. It is below the dollar corporate figure of 170, but the latter must absorb much larger benchmark-rate volatility. Dim sum also retains an offshore premium over domestic bonds: January–April 2026 Bloomberg Dim Sum total return was 1.22%, outperforming comparable onshore bonds at 0.83%, supported by systematically higher offshore coupons.
3. Low volatility is measurable: 78 versus 18 basis points
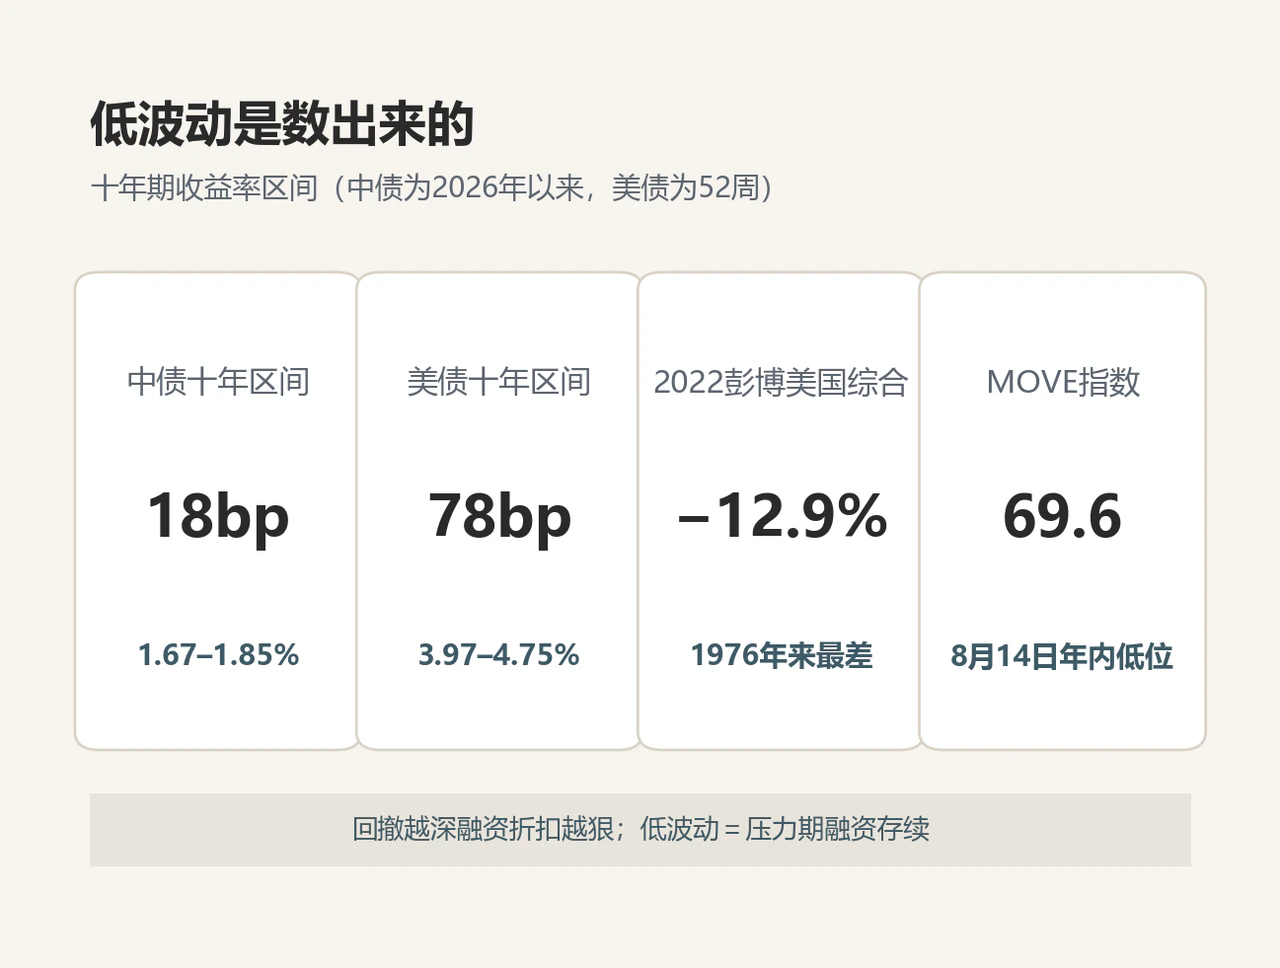
Low dim sum volatility is demonstrated in market data. Over 52 weeks, the US 10-year swung from 3.97% in October 2025 to 4.75% in July 2026, a 78 basis-point range. China's 10-year moved only between 1.67% and 1.85% during 2026, an 18 basis-point range. The yield ranges differed by more than four times.
Stress comparisons are sharper. During aggressive 2022 tightening, the Bloomberg US Aggregate lost 12.9%, its worst year since inception in 1976. China's total wealth bond index instead earned a positive return despite year-end wealth-management redemptions, supported by coupons and restrained volatility. MOVE recently fell to a yearly low of 69.58, but that was only a calm interval after two turbulent years; it had spent extended periods above 100 in 2022–2023.
For leveraged, liability-driven portfolios, volatility determines survival. Deeper NAV losses make financiers cut collateral lending values more aggressively and demand margin more often, raising forced-liquidation risk near panic lows. A curve with only an 18 basis-point annual range makes funding withdrawal and liquidation far less likely even during liquidity drains.
Combining carry and volatility, the RMB pool obtains government-dollar-bond-scale carry with only around one-quarter of dollar-market rate swings. On carry per unit of volatility, dim sum bonds are fully competitive.
4. Capacity, credit spectrum and liquidity: An undeniable difference in scale
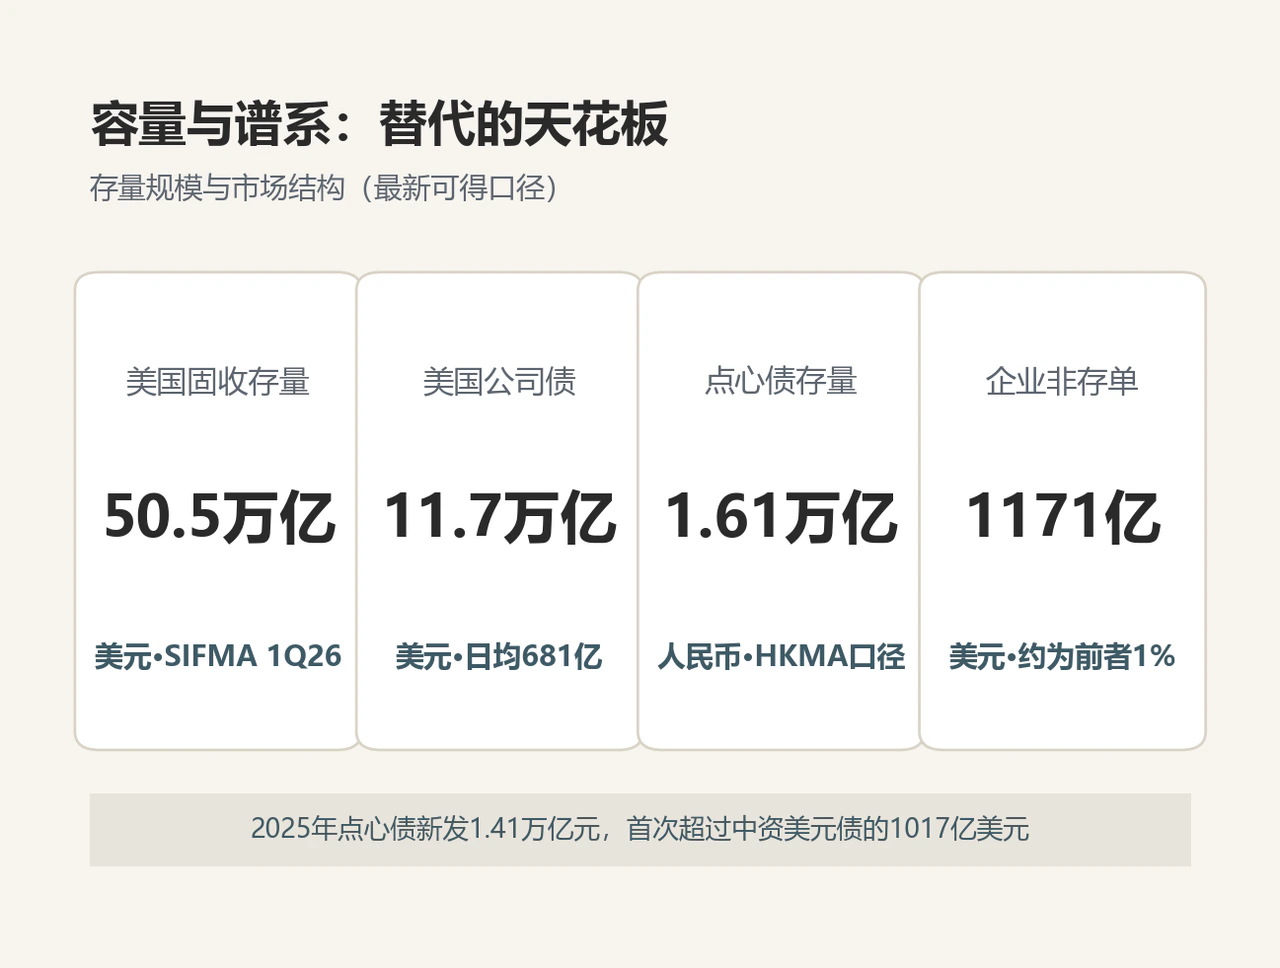
An objective assessment must also recognize differences of orders of magnitude.
First, outstanding size and liquidity. SIFMA put US fixed income excluding MBS and ABS at $50.5 trillion in Q1 2026, including $31.5 trillion Treasuries and $11.7 trillion corporates. During the first seven months, daily Treasury turnover averaged $1.21 trillion and corporate trading $68.1 billion. HKMA put Hong Kong offshore RMB debt securities at RMB 1.6073 trillion, around $230 billion, at end-2025, up a strong 27.6%. The non-CD corporate bonds directly comparable with credit debt were only around $117.1 billion, roughly 1% of US corporates.
Second, the credit-spectrum gap. Dollar markets offer a complete curve from Treasuries and AAA down through BB and below; the 7.08% high-yield index reflects a mature ecosystem with many issuers. Dim sum remains dominated by sovereigns, quasi-sovereigns, policy banks and a few central and state-owned companies. Landmark transactions including Meituan's RMB 7.08 billion debut and Shandong Gold's RMB 2.035 billion green issue, nearly 15 times subscribed, are strengthening the middle. High yield and lower credit tiers remain largely absent, leaving few options for RMB institutions seeking returns by taking lower ratings.
Substitution has already occurred on the liability side. Hong Kong offshore RMB issuance reached RMB 1.1009 trillion in 2025, or RMB 1.41 trillion under Wind's broader definition, exceeding Chinese dollar issuance of $101.7 billion for the first time. Companies and Chinese institutions have already voted with financing decisions, replacing expensive dollar liabilities with cheaper RMB funding at scale.
Asset-side substitution is therefore constrained by physical market capacity rather than allocation appetite. It will proceed in tiers: sovereigns, quasi-sovereigns and strong high-grade credits absorb funds first, while high yield and complex hybrid capital remain dependent on dollar markets in the near term.
5. Relaunch after eight years: Offshore government futures complete the hedge
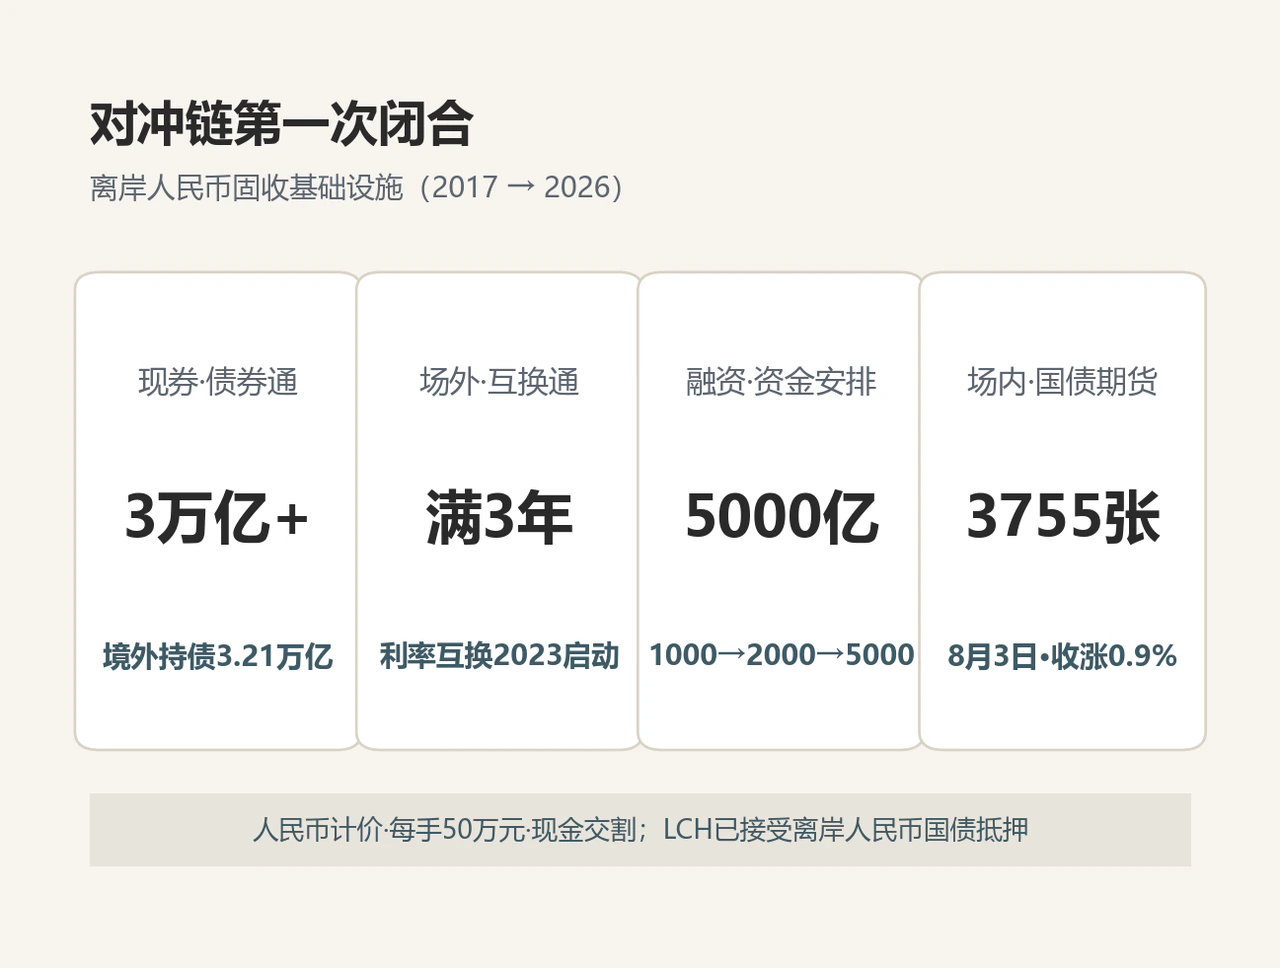
HKEX launched 5-year offshore RMB Chinese government-bond futures on August 3. The only offshore Chinese sovereign futures reference onshore 5-year bonds, are fully RMB-denominated and cash-settled, and have RMB 500,000 face value, half CFFEX's onshore specification. First-day volume was 3,755 contracts and settlement rose 0.9%, with 13 initial liquidity providers. Trading continues on Hong Kong holidays except New Year's Day.
This was not HKEX's first attempt. A similar product launched in April 2017, but stopped after contracts expired at year-end following only eight months. Foreign holdings of onshore bonds were then around RMB 800 billion, leaving too small a cash-bond base for derivatives.
Eight years later the base and infrastructure are very different. At end-May 2026 foreign domestic-bond holdings exceeded RMB 3.21 trillion, including around RMB 2 trillion sovereigns. Bond Connect holdings exceeded RMB 3 trillion; Swap Connect had operated smoothly for three years. HKMA's RMB Business Facility grew from RMB 100 billion to RMB 500 billion, adding nine-month to three-year funding. LCH accepted offshore RMB sovereigns as collateral. Hong Kong's RMB deposits and CDs exceeded RMB 1.1 trillion, and it handled around 75% of offshore RMB payment clearing worldwide.
Cash access through Bond Connect, OTC rate hedges through Swap Connect, HKMA funding, cross-border LCH collateral and standardized exchange-traded duration hedging together formed a complete offshore risk-management chain for the first time. The longstanding mismatch of long assets and short liabilities, with no exchange hedge, gained its final missing piece.
Why start at 5 years? Outstanding dim sum weighted maturity is around five years, making the contract a close anchor for the core duration. Liquid exchange hedges let dealers hold bonds and quote more confidently, narrowing secondary spreads. Asset managers can adjust duration with futures instead of selling cash bonds into shallow markets. First-day 3,755 contracts, around RMB 1.9 billion notional, is tiny against millions of Treasury-futures contracts, but 2017 showed that a cash base must precede the ecosystem. That foundation now exists.
The baseline is accelerating segmented substitution: high-grade dim sum continues taking issuance share from Chinese dollar debt, futures trading and open interest grow, and maturities may extend to 2 and 10 years. Watch open interest and daily turnover, Finance Ministry offshore reopenings and incremental Southbound Bond Connect allocations.
Adverse surprises remain possible: sudden CNH tightening, as overnight HIBOR briefly reached 2.31% in January 2026, would raise RMB funding costs; dollar long yields could surge again; geopolitics could weaken foreign appetite for CNH assets. Four concrete gauges are futures open interest, non-CD corporates' issuance share, currently around 30%, secondary bid-ask convergence, and stability in CNH HIBOR's spread to onshore Shibor.
Can dim sum replace dollar bonds? Within currency-matched balance sheets, substitution is already happening. Each completed infrastructure link extends its boundary. Institutions with RMB liabilities should return to a simple investment principle:
If liabilities are in renminbi, why cover them with dollar assets carrying currency mismatch and much greater volatility?


