The most common market narrative about dim sum bonds is crude: low renminbi rates and high dollar rates encourage issuers to borrow in renminbi to save costs, while investors naturally favor dollar bonds' attractive coupons. Both sides appear satisfied, but both focus on nominal figures and overlook the first question institutional fixed-income investors must answer: where does the funding come from?
Borrowing dollars to buy dollar bonds and offshore renminbi (CNH) to buy dim sum bonds largely locks down currency exposure. The investment's value then depends on what net interest margin remains within each currency after funding costs, expected credit losses, liquidity discounts and internal capital charges. Detailed accounting often reduces an apparent yield gap of more than 200 basis points to a few dozen basis points, or even reverses it during funding shocks.
Dim sum bonds cannot comprehensively replace dollar bonds today, but have the foundations to become Hong Kong's second core offshore fixed-income curve. Mature asset managers and treasuries should build two separate asset baskets, each strictly matched to its liabilities, and then manage duration, credit composition and immediate monetization capacity across them.
1. Structural differences behind trillion-renminbi totals: replacing dollar bonds is premature
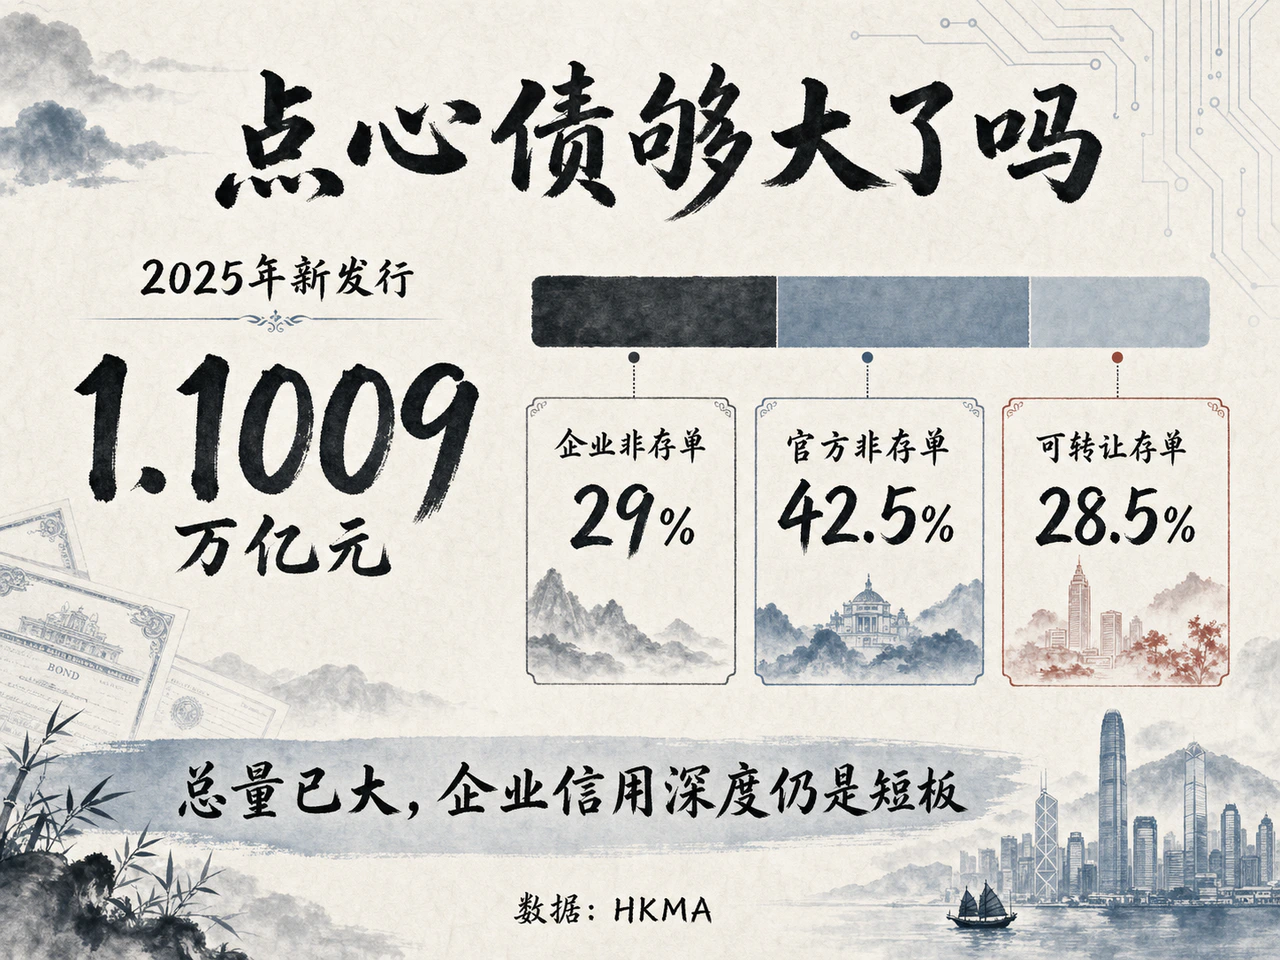
HKMA data show 2025 offshore renminbi debt issuance in Hong Kong at RMB 1.1009 trillion, up 2.7% year on year, with year-end outstanding securities at RMB 1.6073 trillion, up 27.6%. Those trillion-renminbi totals suggest a market moving beyond its formerly marginal role into rapid scale expansion.
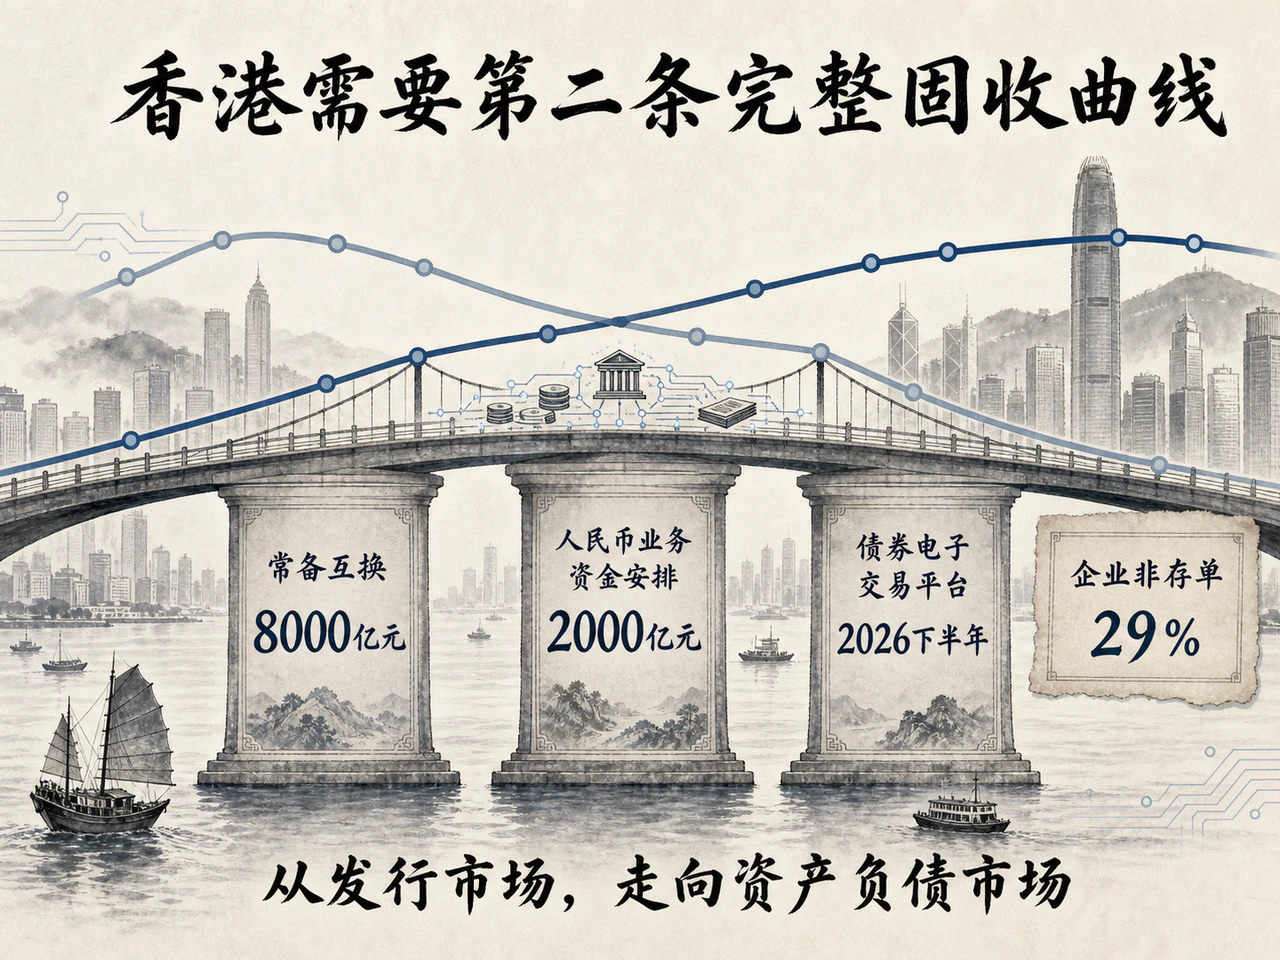
Aggregate figures conceal a different microstructure. HKMA's broad debt-securities measure includes bonds, medium-term notes, negotiable certificates of deposit (CDs), commercial paper (CP) and asset-backed securities (ABS). A breakdown on the dollar-reporting basis shows CDs around 28.5% of 2025 issuance, official/sovereign and quasi-sovereign non-CD issuance about 42.5%, and corporate non-CD securities only about 29%, approximately RMB 319 billion. The apparent abundance therefore translates into a much thinner set of investable corporate credits comparable with international dollar bonds.
Outstanding amounts make the gap clearer. At end-2025, Hong Kong offshore renminbi non-CD securities totaled about $184.9 billion, versus $533.6 billion of G3-currency bonds, mainly dollars. Corporate offshore renminbi non-CD securities were only about $117.1 billion, versus over $501.7 billion of G3 corporate credit. Statistical definitions and registration differ, permitting only order-of-magnitude comparisons. Nevertheless, while dim sum bonds are significant, issuer breadth, individual-bond market-making depth and secondary turnover remain substantially smaller than in dollars.
The likely outcome is tiered substitution, not wholesale replacement. Sovereigns, policy financial institutions, multilateral development banks, highly rated central/state-owned enterprises, global banks and companies with cross-border renminbi cash flows can quickly connect CNH financing and asset accumulation. Dollar markets remain indispensable for high-yield issuers, complex subordinated capital instruments and large institutions reliant on deep global dealer networks.
Data basis: HKMA, The Hong Kong Bond Market in 2025. CNH and G3 use different statistical methods; this article compares scale only.
2. Start with liabilities: what remains of a 200-basis-point yield gap after funding?
The logic of evaluating a real buy-side portfolio is straightforward:
Actual net interest margin = bond yield to maturity − actual same-maturity, same-currency funding cost − transaction and swap-hedging costs − expected credit losses − liquidity and capital charges.
Policy rates, interbank funding benchmarks and an institution's actual liability cost are different concepts. Fed funds and the PBOC seven-day reverse-repo rate indicate policy; SOFR, CNH HIBOR, FX swaps and repo rates measure marginal market liquidity prices. Individual institutions must add their own credit premium, collateral haircuts, internal funds transfer pricing (FTP) and Basel capital consumption. Subtracting an overnight policy rate from a five-year bond yield describes liquidity conditions, not securely realizable carry.
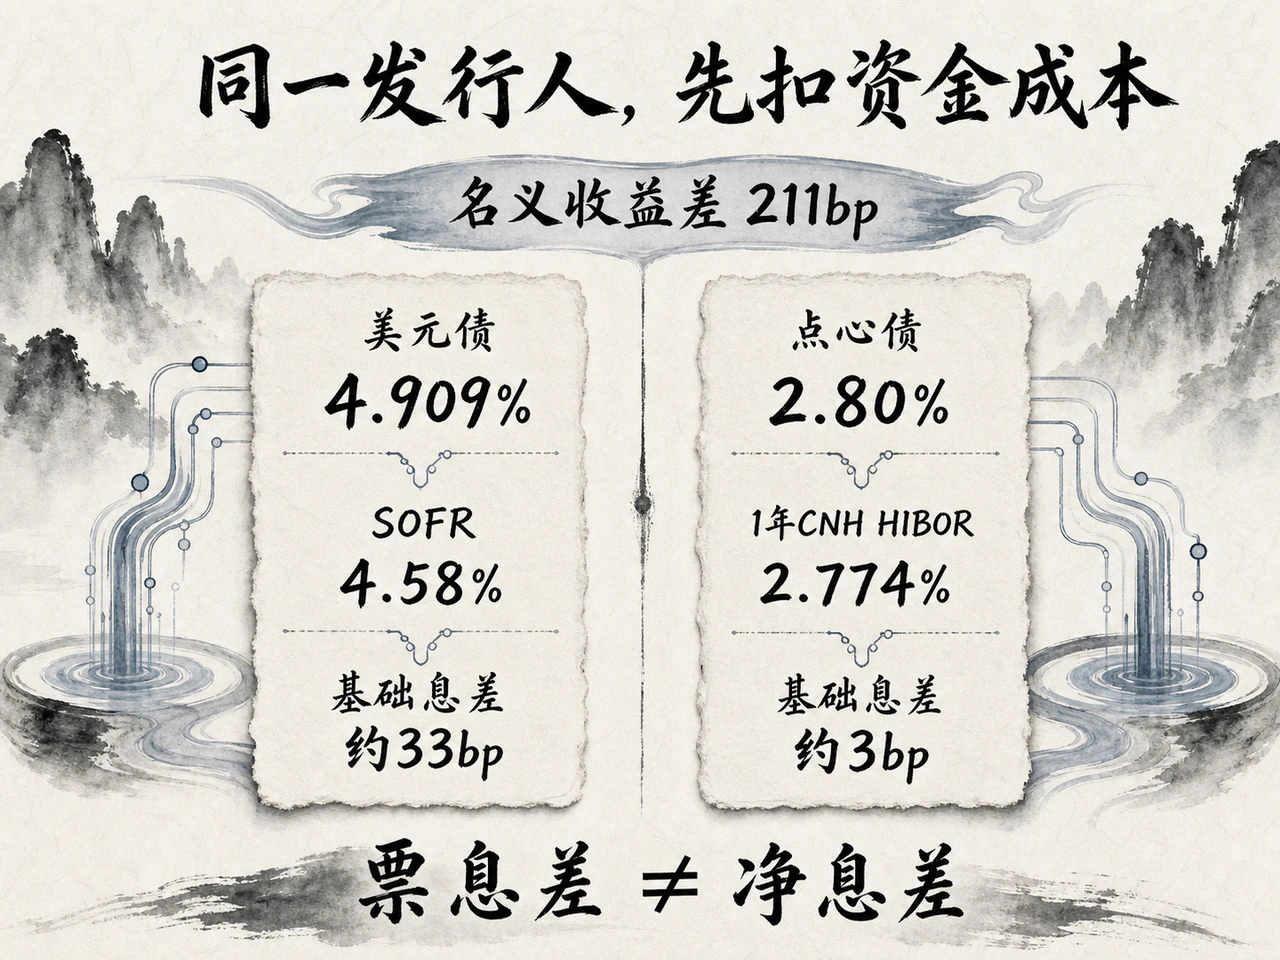
Alibaba's senior unsecured dollar and renminbi bonds issued in the same week in November 2024 provide a rare, clean same-issuer comparison. Its dollar bond due 2030 had a 4.875% coupon and 99.838 issue price, implying about 4.909% yield. The CNH bond due 2029 had both coupon and yield of 2.80%. Similar maturities and identical seniority left an apparent 211-basis-point nominal yield gap.
Policy-rate comparison seems to favor dim sum. Fed funds was then 4.50%–4.75%, midpoint 4.625%, leaving the dollar bond only about 28 basis points above policy. The PBOC seven-day reverse repo was 1.50%, a full 130 basis points below the renminbi bond.
Actual funding costs immediately change the result. On the dollar issue date, SOFR was 4.58%, leaving about 33 basis points. The day before the renminbi issue, one-year CNH HIBOR was 2.774%, leaving only about 3 basis points against 2.80%. Even using the one-year dollar/renminbi cross-currency basis-swap implied cost of 2.526% left only about 27 basis points. The apparent 211-basis-point nominal gap largely disappears after matching funding currencies, bringing the basic spreads close to a modest 20–30-basis-point range.
Maturity-mismatch refinancing risk is more dangerous. Around the renminbi issue, overnight CNH HIBOR spiked to 4.707% amid offshore liquidity disturbances. Funding the five-year bond by rolling overnight money would instantly create sharply negative carry. A common fixed-income failure is mistaking short-funded long-asset maturity transformation for risk-free return. A five-year asset should be funded against five-year internal FTP or asset-swap spreads. Rolling overnight or one-month money requires explicit buffers for month-end, quarter-end and exchange-rate-defense liquidity premiums.
Current portfolios illustrate the same pattern. At end-June 2026, iShares 1–5 Year Investment Grade Corporate Bond ETF (IGSB) had a 4.73% 30-day SEC yield, effective duration 2.69 years and three-year annualized volatility 2.33%. Against New York's August 18 SOFR of 3.65%, the basic spread was about 108 basis points. The Hang Seng Renminbi Bond Fund had average yield to maturity 2.75%, average rating A+, duration 4.53 years and three-year annualized volatility only 0.95%. TMA's August 18 one-year CNH HIBOR of 1.70% left about 105 basis points. Different snapshots, maturities and credit distributions prevent treating them as simultaneous comparable quotes, but they challenge intuition: after fully accounting for liabilities, high-coupon dollar assets have no overwhelming actual spread advantage over dim sum bonds.
3. Two-currency allocation: move beyond directional FX bets to separate liability baskets
From an asset-liability management (ALM) perspective, the biggest mistake is turning a combined dim sum/dollar portfolio into a one-way renminbi bet. A robust structure has two internally separate local-currency asset/liability baskets: dollar liabilities fully match dollar bonds, and CNH liabilities fund dim sum holdings. The portfolio layer aggregates clean net margins, matches duration, monitors underlying credit and assesses emergency liquidity while keeping net FX exposure very low. The returns below are within each local-currency budget, not unhedged renminbi assets mechanically translated into dollar NAV.
Historical samples illustrate volatility reduction. Using Markit iBoxx ALBI China Offshore for CNH bonds and ICE BofA 1–5 Year US Corporate for short-duration dollar investment-grade credit, 2021–2025 local-currency total returns show dollar credit annualized at about 2.24%, with 5.51% annualized volatility and a worst year of −6.07%. CNH bonds returned about 3.39% annualized with only 1.05% volatility; their worst year was still +1.76%.
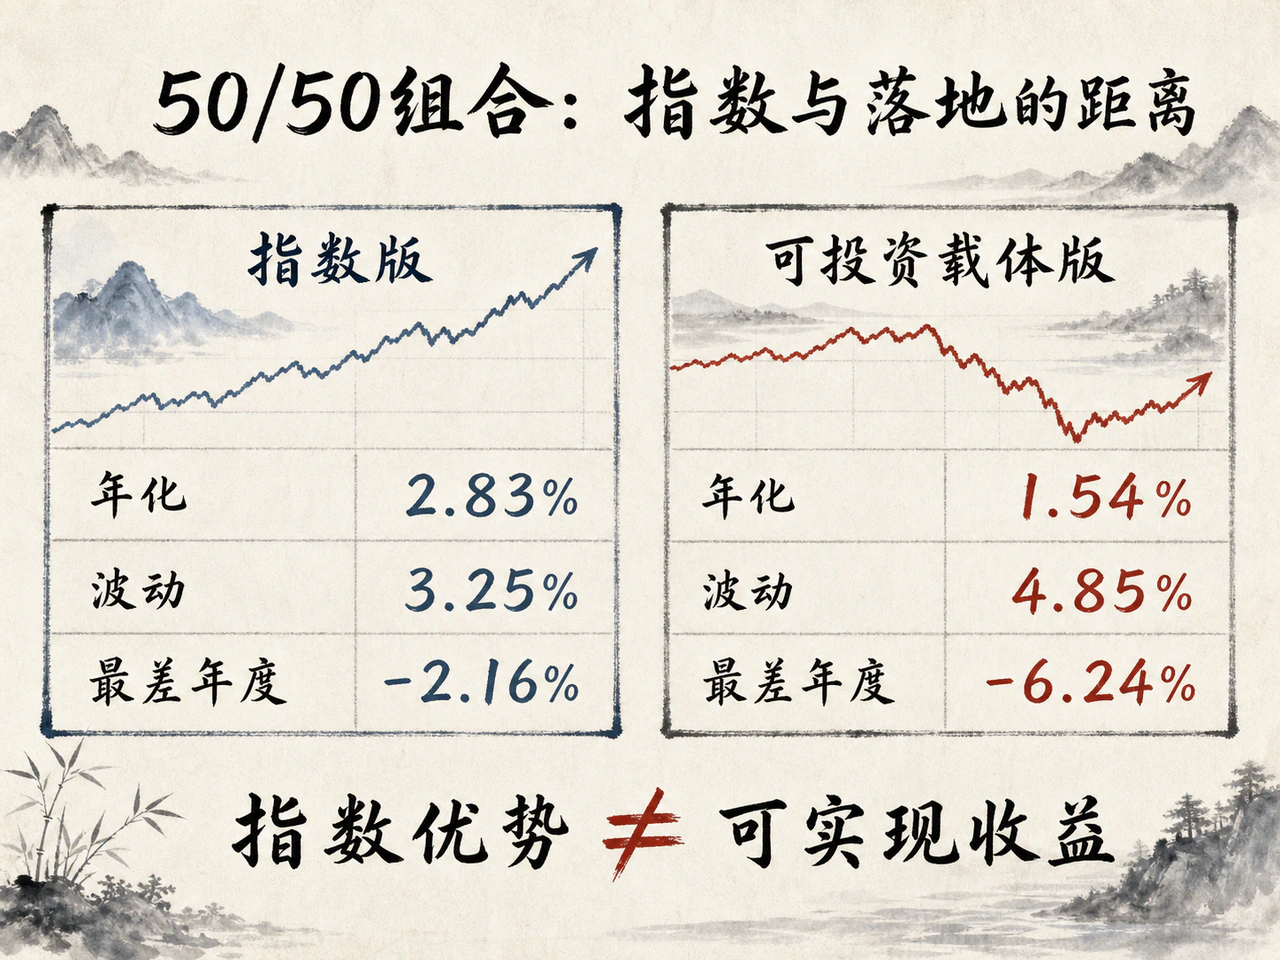
With zero net FX exposure and annual rebalancing, a 50% dim sum/50% dollar portfolio returned 2.83% annualized, with 3.25% volatility and a worst-year loss of −2.16%. At 75% dim sum/25% dollar, annualized return rose to 3.11%, volatility fell to 2.13%, and the worst year was −0.20%. This is not a low-correlation free lunch. The five sampled annual returns had correlation 0.92. Drawdown reduction came from CNH's exceptionally low volatility in that period, not structurally negative correlation.
Real investable public funds can produce a much worse outcome than indices. Over the same period, IGSB NAV returned about 2.33% annualized, while Hang Seng Renminbi Bond Fund Class A returned only 0.73%. Their 50/50 portfolio returned 1.54%, with sample volatility worsening to 4.85%, a worst-year loss of −6.24% and correlation still 0.93. The roughly 2.65-percentage-point annual gap between CNH benchmark and fund exceeded its maximum 0.75% management fee. Active duration deviations, credit selection, redemption cash drag, foreign-currency exposure—the fund still held 16.49% dollar assets in June 2026—and OTC spreads consumed returns, before a potential 2% front-end subscription charge. Because the fund changed its return-accounting basis in September 2022, this is not an attribution judgment on one fund but an implementation stress counterexample. Index backtests can be too optimistic; friction between modeled returns and real vehicles is itself a core risk.
The two-basket strategy rests on three structural benefits. Chinese and US monetary-credit cycles are not always synchronized, allowing asynchronous duration rotation. Dollars offer global issuer-sector breadth and deep complex derivatives, while dim sum provides a natural reservoir for renminbi liability matching and cross-border liquidity. Finally, during extreme offshore dollar or CNH squeezes, the two independent funding ecosystems rarely suffer liquidity breaks in exactly the same direction and magnitude.
Strict stress testing is essential. A simplified one-year model—starting yield minus effective duration times yield increase minus emergency liquidation discount—gives dollar returns about −0.65%, renminbi −6.31% and a 50/50 portfolio −3.48% if both yields rise 200 basis points. A CNH liquidity/credit shock of +250 basis points plus a 2% emergency sale discount produces approximately −10.58% for renminbi and −2.92% for the 50/50 portfolio. Most dangerous is buying dim sum as a yield substitute against entirely dollar liabilities without FX hedging. A 7% renminbi depreciation would produce a dollar-translated annual basket loss of −4.44%, turning fixed income into a highly risky directional FX bet.
Four strict disciplines should protect the balance sheet:
- Within each currency, keep asset DV01 matched to liability PV01 within a 90%–110% band;
- Limit total net currency exposure to 5% of NAV, eliminating unhedged directional FX speculation;
- Maintain immediate high-quality liquid-asset coverage above 1.5 times the coming 30 days' needs;
- Core dim sum holdings must have regular executable two-way quotes from at least two established international dealers. Remove bonds from the liquidity buffer if secondary spreads widen by more than 50 basis points or only one-way indicative quotes remain. Never add leverage to speculate on future rate declines when actual net margin after internal funding, expected credit losses and market impact is negative.
4. From financing channel to ecosystem: infrastructure for Hong Kong's second offshore-renminbi curve
The macro backdrop remains supportive. China's first-half 2026 GDP grew 4.7% year on year, slowing to 4.3% in the second quarter, with moderately loose monetary policy. The Fed held 3.50%–3.75% in July. The short-policy-rate gap remained large, so renminbi's relative funding advantage was unlikely to disappear quickly. Tail risks remained: renewed US inflation could prolong high rates and dollar-bond valuation swings; exchange-rate defense could drain CNH liquidity and trigger violent short-rate spikes, damaging leveraged dim sum carry.
Hong Kong's initiatives address a market historically strong in issuance but weak in trading and market making. The PBOC–HKMA standing swap has expanded to RMB 800 billion; HKMA's 2026 intraday and overnight renminbi business-funding arrangements to RMB 200 billion. The government proposed regular CNH issuance across maturities to complete the sovereign curve and liquidity benchmarks, alongside a bond electronic-trading platform. Crucially, HKMA's offshore-renminbi overnight liquidity arrangement is priced at CNH HIBOR plus a spread, connecting official support with market funding costs.
To judge the next stage of maturity, attention should shift from gross new issuance to three deeper micro indicators:
- First, whether genuine corporate non-CD credit gains a steadily rising share of issuance and outstanding securities;
- Second, whether the same issuer's CNH and dollar relative credit spreads form stable, fair and tradable curves;
- Third, whether interbank repo volume, cross-institutional rehypothecation of high-grade dim sum collateral and regular two-way dealer depth extend materially to more nonfinancial issuers.
Only qualitative progress in these mechanisms can move dim sum beyond an opportunistic financing-window product into a core asset that global institutions can hold in size, fund safely and hedge efficiently.
Hong Kong's dim sum development does not aim to displace dollar bonds, an unrealistic outcome inconsistent with global allocation. A healthier, emerging structure has parallel, complementary infrastructures: a deep global dollar curve for cross-border allocation and macro-risk transfer, and a CNH curve grounded in renminbi trade settlement, corporate cash balances and real liability matching under internationalization. Companies gain financing flexibility, investors another tightly matched margin basket, and Hong Kong progresses from a dollar-dependent offshore channel to a financial hub with genuine two-currency balance-sheet and market-making capacity.


