As Hormuz disruption enters its sixth month, oil seeks balance between extending geopolitical premiums and rebuilding stocks. August 19 official WTI and Brent settlements both reached near-four-week highs since July 24. Yet deferred prices still slope steeply downward and US commercial crude recorded a second large weekly build. Markets are pricing continued interruption rather than worsening interruption.
Tight nearby, looser deferred: the curve speaks
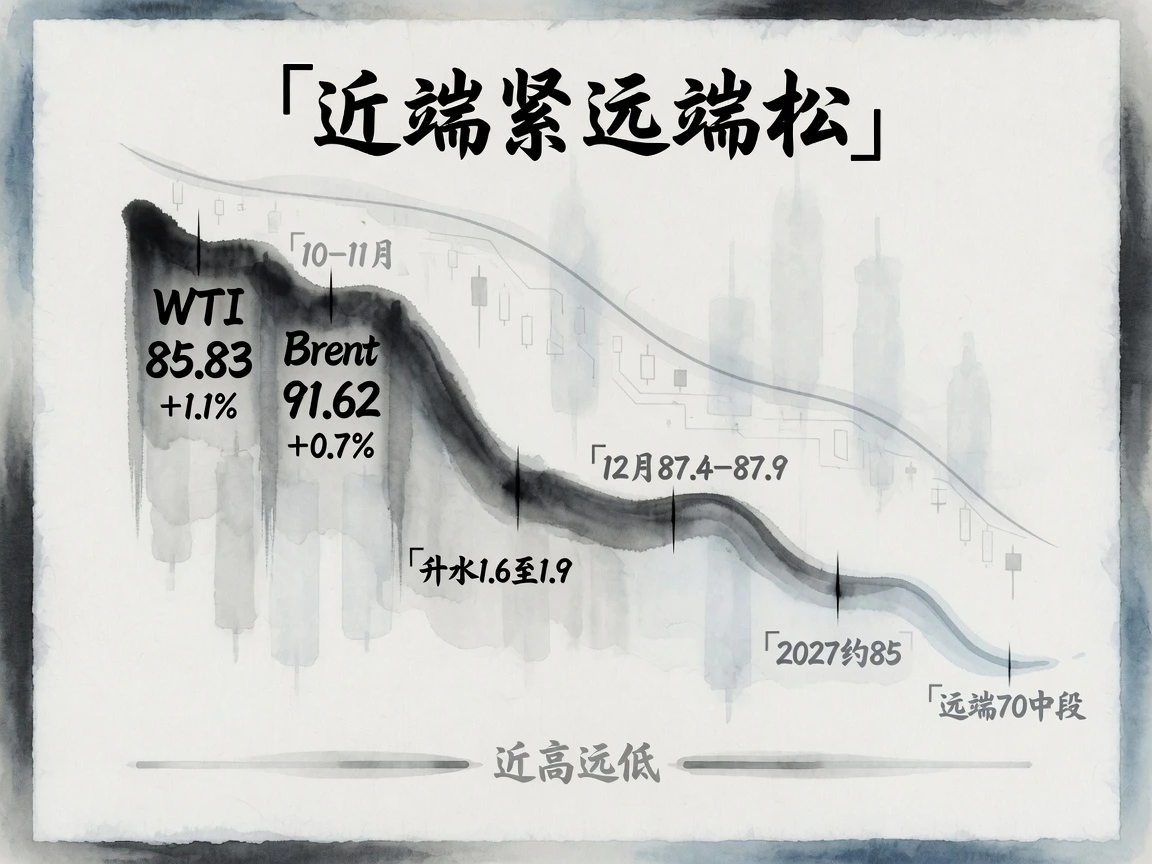
August 19 official settlements reported by MarketWatch/Dow Jones: nearby WTI $85.83/barrel, up $0.89 or 1.1%; nearby Brent $91.62, up $0.60 or 0.7%, both near-four-week settlement highs.
Deep backwardation persists. Brent October–November spreads were roughly +$1.6–$1.9, December about $87.4–$87.9, early-2027 near $85 and far maturities in the mid-$70s, on oilprice.com intraday snapshots. The steep curve shows immediate delivery pressure supporting nearby premiums while deferred pricing bets Hormuz eventually reopens and balances normalize.
At about 08:47 Beijing August 20 in electronic trading, WTI fell roughly $1.2 from settlement to $84.60 while Brent held near $91.90, widening Brent-WTI above $7. Disruption more directly supports the Middle Eastern benchmark than inland-oriented WTI. This is an intraday deadline snapshot separate from official daily settlements.
Why more than 20 million barrels of two-week builds cannot suppress prices
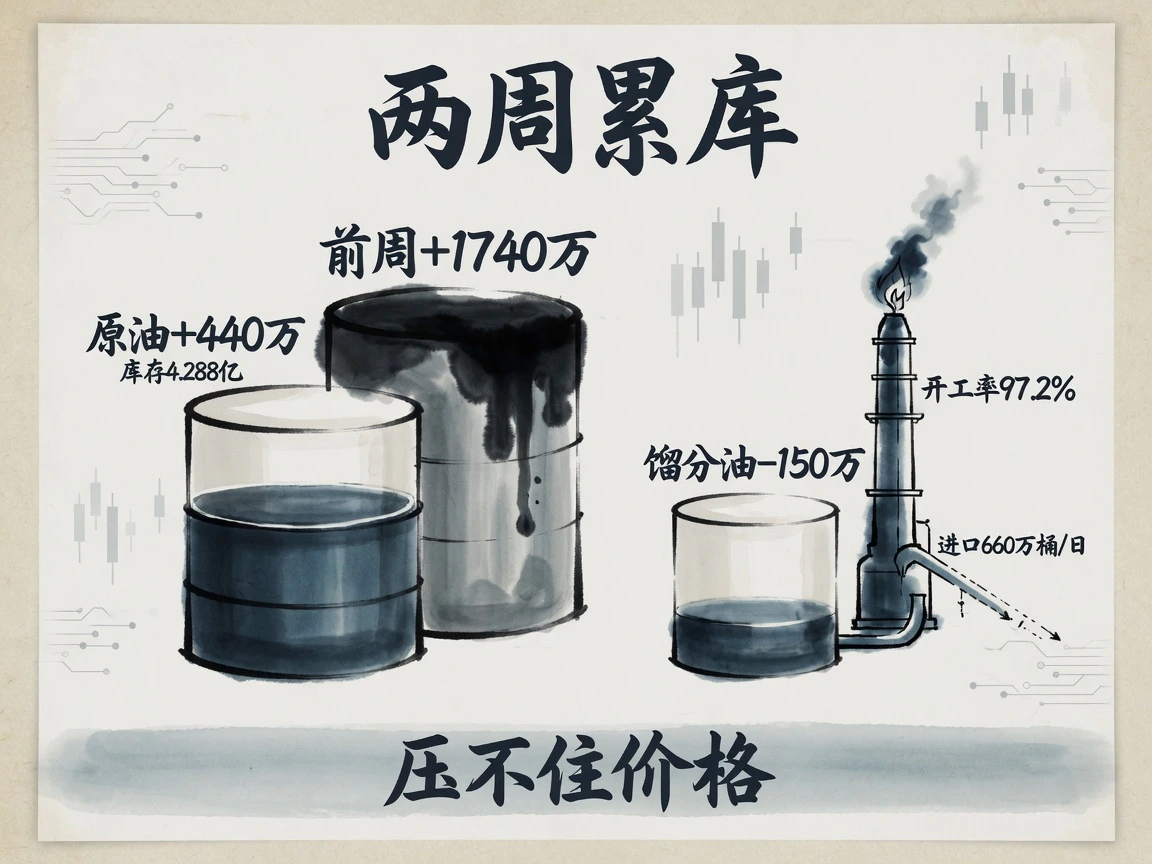
EIA's August 19 report for the week ended August 14 showed apparently bearish stocks: commercial crude rose 4.4 million barrels to 428.8 million, back to the five-year seasonal average. Following a build of 17.4 million barrels, the two-week increase exceeded 21 million.
Microstructure remained tight. Refinery utilization reached 97.2%, with runs at 17.4 million barrels/day. Distillate inventories, vital to industry and transport, fell 1.5 million, roughly 13% below the five-year average. Total product stocks rose 8.8 million, mainly propane and other chemical feedstocks. Crude imports fell 746,000 barrels/day to 6.6 million; as builds slow, tighter external inflows are a key marginal variable.
High prices increasingly hurt demand. Four-week average total product demand was 20.5 million barrels/day, down 2.9% annually, corroborating in US high-frequency data the IEA August report's projected 2026 global decline of 1.6 million barrels/day.
Physical supply bottlenecks matter more than quotas
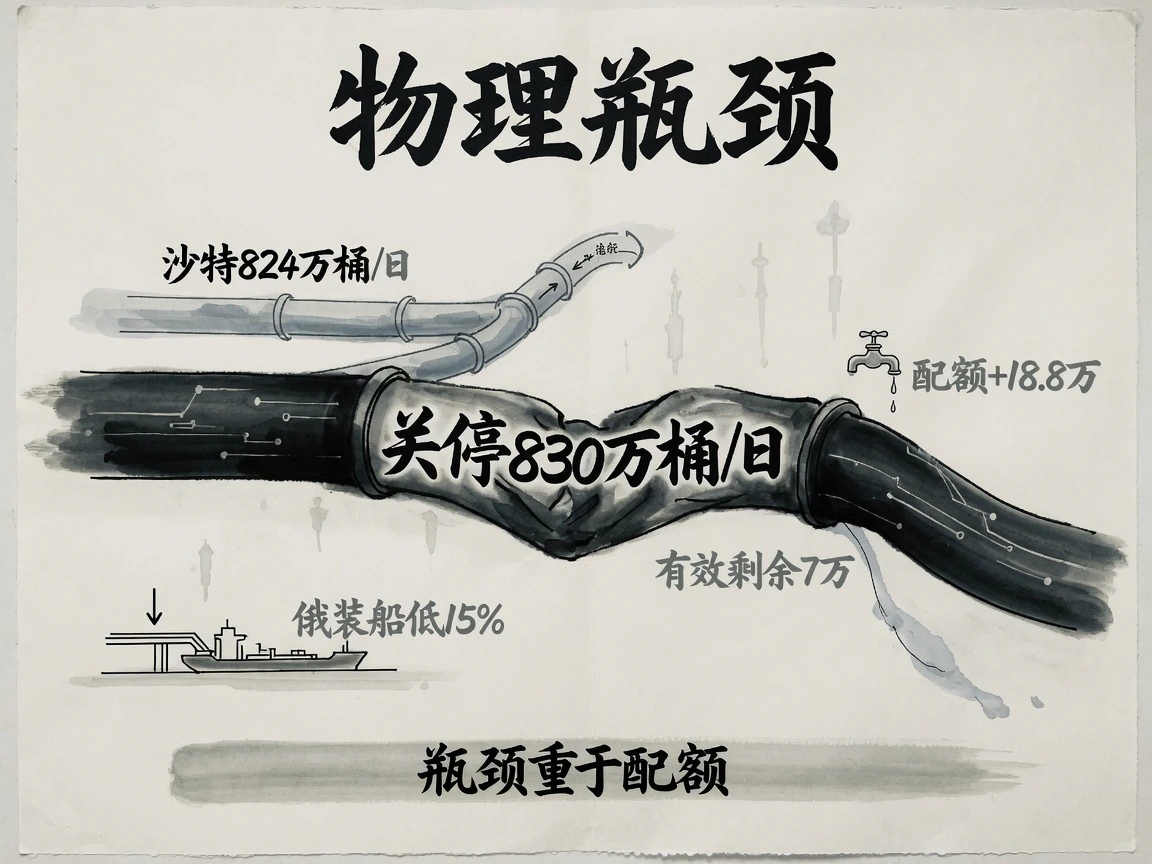
IEA August figures showed approximately 8.3 million barrels/day of Gulf capacity still involuntarily shut. Saudi July output recovered to around 8.24 million, largely relying on the east-west pipeline and Red Sea ports. OPEC+'s nominal restoration of 188,000 barrels/day from August was nearly a paper figure against the strait blockage. Excluding capacity unable to leave the Gulf, eight core OPEC countries had only about 70,000 barrels/day effective spare capacity.
Disruption also spread outside the main artery. Reuters put western Russian crude loadings around 15% below plan due to Black Sea obstacles, alongside repeated Ukrainian attacks on large refineries, extending global crude/product supply domino effects.
Freight and war insurance turn interruption into a per-barrel cost

Two geopolitical changes reached markets directly: after Monday's temporary-ceasefire expiry, Washington rejected contacts or extension while Iran insisted closure continue until demands were met; the UAE halted all Iranian financial and trade dealings, citing detected missile threats.
Shipping is the clearest gauge. Kpler, cited by Reuters, counted only 6 commercial cargo vessels Tuesday versus a ten-day average of 11. Dark ships with AIS off and resumed Aramco offshore transfers maintained some flows. Supply was not zero, but reconstructed under steep discounts, circuitous routes and extraordinary insurance.
Shipping costs are the hardest carrier of premiums. Rumored spot Persian Gulf–Asia VLCC fixtures reached roughly $500,000/day, around 20 times normal early-year levels. War insurance had risen to 7.5%–10% of hull value by late July, adding tens of millions per voyage, on Lloyd's List/S&P quotes covering late July–mid-August. Freight and insurance convert abstract disruption into buyers' actual per-barrel delivery costs.
Tailwinds and concerns: what Brent above $90 is testing
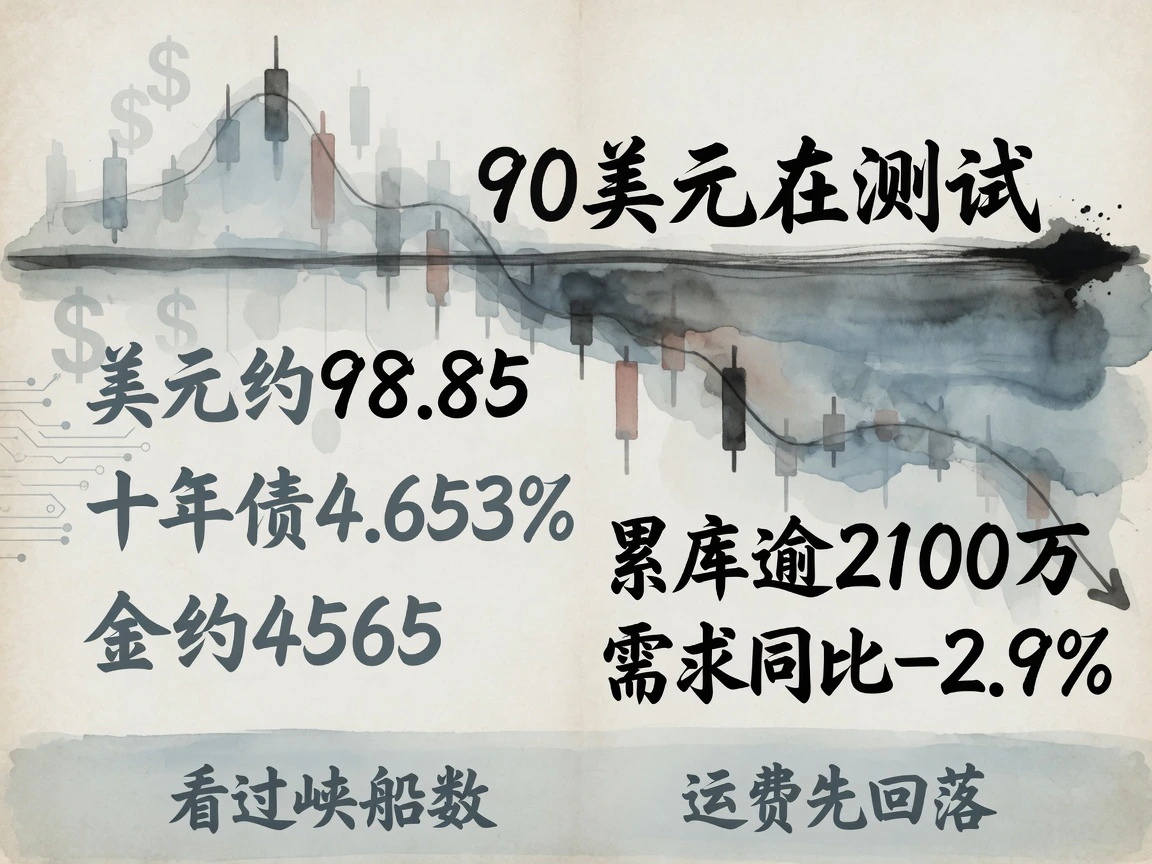
Financial conditions helped. The dollar index was about 98.85 at deadline versus 99.65 previously; the 10-year Treasury closed 4.653%, down 5.3bp. Weaker real rates and dollar lifted dollar-commodity valuation support. Stocks rose steadily, S&P 500 +0.21%, and VIX fell to 14.89, avoiding macro-risk drag. London spot gold near $4,565 was distinctly higher, indicating substantial commodity buying reflected geopolitical tail-risk hedging.
Together these show a persistent temporary disruption: nearby pricing reflects physical scarcity and logistics, while deferreds firmly bet on reopening before 2027. Deep backwardation, falling deferred prices and Brent outperforming WTI share that anchor. Two-week builds above 21 million barrels failed to suppress prices because marginal buyers still pay for cutoff tail risk. Yet Asian WTI falling over $1 from settlement warns that each Brent surge above $90 sensitively tests demand destruction's absorption limit, with demand down 2.9% annually.
Watch two high-frequency leaders: whether Kpler daily passages recover above the ten-day average, and when Gulf VLCC fixtures/war insurance retreat from extremes. In physical supply chains, easier shipping often reveals substantive risk relief before oil prices do.


