On August 21, 2026, US markets absorbed two very different macro narratives. Strong S&P Global flash August PMI suggested third-quarter annualized growth near 3.0%, lifting the two-year Treasury yield 5 basis points after four sessions at 4.19%. Meanwhile, the yield relief from Treasury's Wednesday expansion of long-end liquidity-support buybacks quickly disappeared, with the 10-year back at highs. Spot gold surged 2.4% and the dollar remained near a three-month low. Higher benchmarks, gains in all three major equity indices and sharply stronger gold coexisted: investors repriced growth while hedging dollar-asset credit risks under prolonged fiscal expansion.
Rates: two-year yield breaks its range as the Treasury curve shifts higher
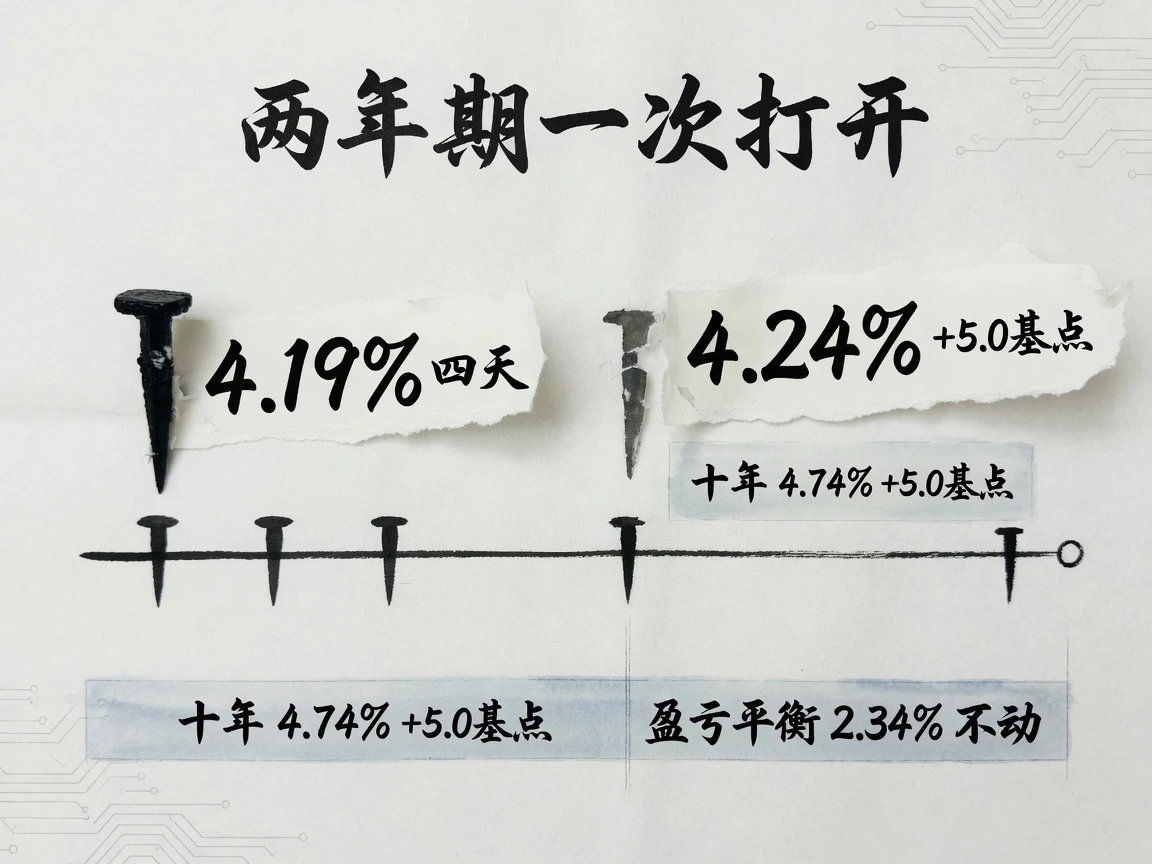
Treasury's closing par curve rose across maturities: two-year 4.24% and 10-year 4.74%, both +5.0 basis points; five-year 4.43% and 30-year 5.27%, each +4.0 basis points. The two-year had held 4.19% for all four sessions August 17–20 before Friday's concentrated selling. The curve shifted almost in parallel: 2s10s remained 50 basis points and 5s30s 84, with the short end catching up to Thursday's lagged move.
Nominal yield increases were entirely driven by real rates. The 10-year breakeven held at 2.34%, implying a roughly 5-basis-point rise in the TIPS real yield to around 2.40%. Thursday's long-end move chiefly reflected inflation-premium adjustment after the buyback announcement; Friday shifted toward real-growth expectations and term premiums. CME FedWatch put a 25-basis-point hike at the September 16 meeting near 40%, up from about 36%. A hold remained the baseline, but a hike was no longer a remote risk.
Fiscal support's immediate relief was fading. On Wednesday Treasury had said that from September 9 the per-operation cap for liquidity-support buybacks of 10–30-year debt would double from $2 billion to at least $4 billion. By Friday the 10-year yield exceeded pre-announcement highs. With Treasury debt outstanding crossing $40 trillion this week, Bessent's comment that operations could exceed $4 billion was seen more as a routine response mechanism than an absolute ceiling on supply pressure. Money-market liquidity stayed stable and four- and eight-week bill yields barely moved; yield increases reflected repriced hike expectations. Credit also diverged by duration: high-yield ETFs edged up while investment-grade corporates and long Treasury ETFs fell. Higher benchmarks chiefly hit long duration rather than indiscriminately affecting short-duration high yield.
Macro: strong services expansion alongside slower manufacturing lifts growth expectations
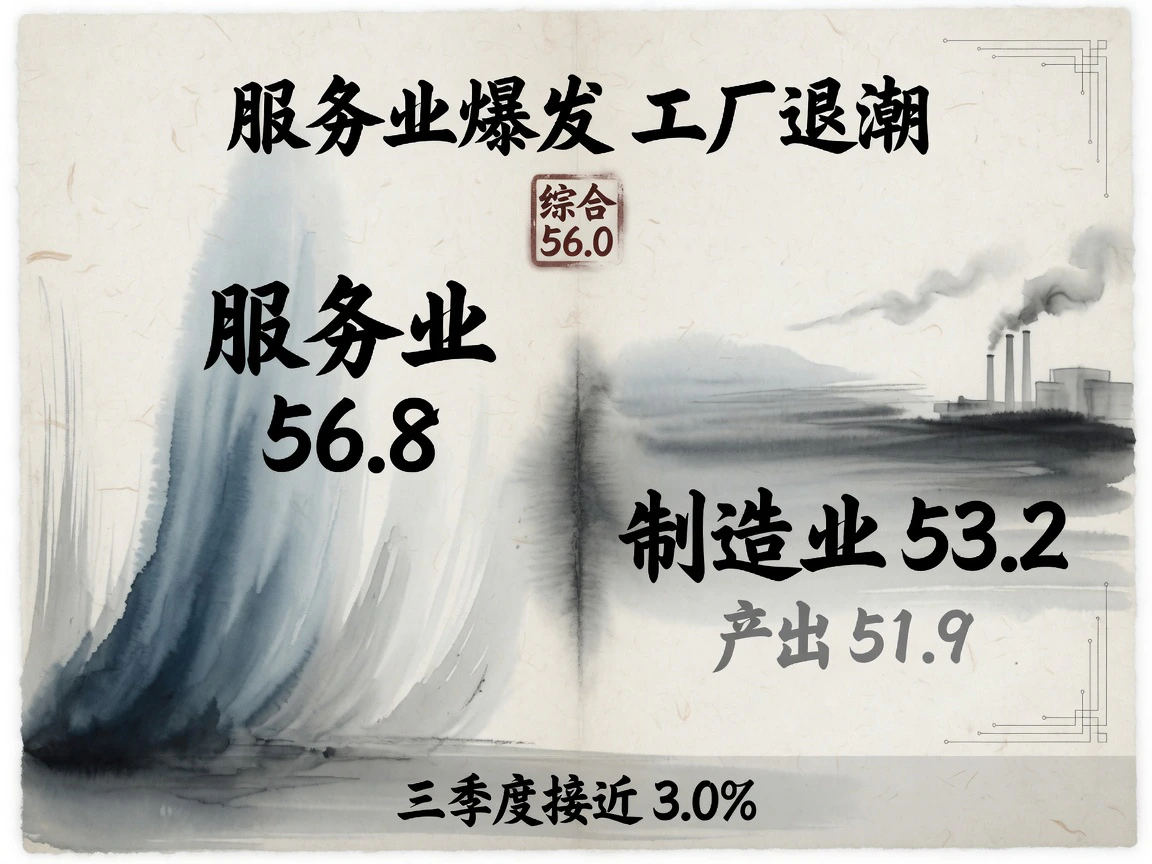
Friday's principal driver was S&P Global's flash August PMI, surveyed August 12–20. Composite output rose from 54.5 to 56.0, the highest since April 2022. Services jumped from 54.6 to 56.8, well above expectations and the strongest since December 2024. Manufacturing fell to a five-month low of 53.2, with output at a 13-month low of 51.9. Chief business economist Williamson estimated third-quarter annualized growth near 3.0%, versus a final second-quarter 1.5%, while employment growth was the strongest since January 2025. Input-cost inflation slowed to its lowest since February and selling-price growth to its lowest since the previous November. The central fixed-income judgment was renewed growth momentum: September could still bring a hold, but further tightening this year needed to remain a fully available option.
The same survey showed sharp industrial divisions. Services orders and hiring expanded at their fastest in nearly two years. Manufacturing faced fading precautionary inventories, localized materials shortages and longer deliveries, with delays still among the worst in nearly four years. If bottlenecks chiefly drove the delivery-time component, some of the composite 56.0 reflected passive inflation from longer lead times, and official inventory/import data might look weaker than the survey. Growth trackers also differed: Atlanta GDPNow at 4.0%, New York's nowcast 2.3%, and PMI-implied growth near 3.0%. The more important policy signal was overall reacceleration. Cleveland's August inflation tracking was broadly stable; the next decisive evidence was July core PCE on August 26.
Other major economies provided context. Euro-area August flash composite PMI reached a nine-month high of 52.1, manufacturing output was strongest since May 2022, and new export orders expanded for the first time in four and a half years; France alone remained in contraction under domestic pressures. UK July retail sales fell as expected, but flash composite PMI still indicated positive third-quarter growth. US fiscal policy showed tension: the White House called buybacks Treasury's professional judgment and said economic growth must address $40 trillion of debt, while allowing duty-free imports of up to 300,000 tonnes of ground meat over 90 days for sale about 25% below average market prices. Consumer-price pressure was constraining tariff policy.
Commodities: geopolitical premiums support oil; credit hedging lifts precious metals
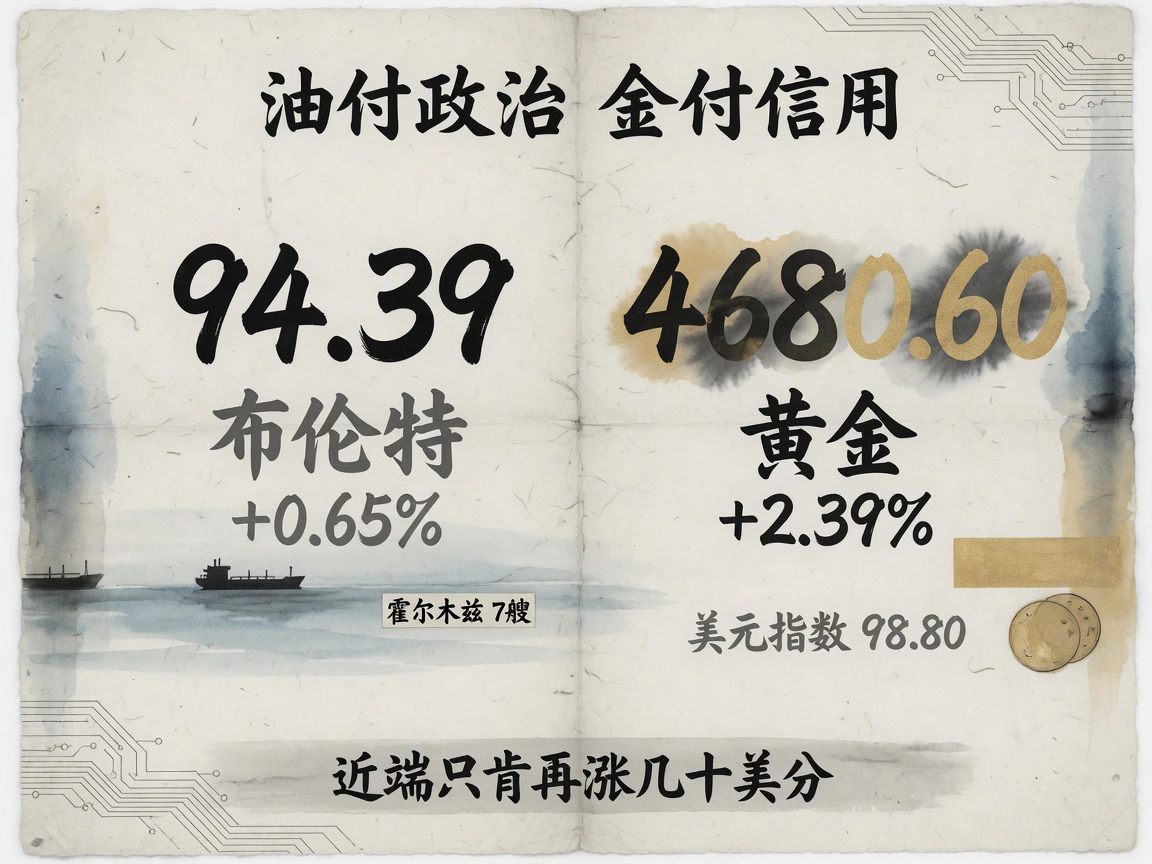
Oil retained a high geopolitical premium. October Brent settled at $94.39 a barrel, +0.65% and about +6.4% for the week. October WTI settled at $87.06, +0.26% versus the same contract the previous day. September WTI expired Thursday, so comparing the new front month with the old settlement would create a misleading roll-related decline. Brent's premium to WTI widened to about $7.33, rewarding seaborne physical risk. October retained roughly $4 of backwardation over December, showing willingness to pay for near-term deliverable barrels without treating winter supply as permanently short.
Friday's oil drivers were almost entirely Middle East developments and shipping monitoring. The US warned of sanctions on countries economically supporting Iran, with details due Monday. Only 7 visible merchant ships were observed in Hormuz Thursday, with no VLCCs or LNG carriers. Diversion and alternatives were largely priced: Saudi Aramco resumed Gulf LPG loading and Venezuela's exports held around 1.25 million barrels a day, constraining nearby upside. US supply showed no incremental support: Baker Hughes rig count fell 5 to 588, the first decline in four weeks. Products were tighter than crude; retail diesel exceeded $5.55 a gallon, highest since late May.
Precious metals followed a separate logic. COMEX December gold jumped 2.39% to $4,680.60 an ounce; spot was $4,623.94 after touching $4,631.99, the highest since May 15, gaining more than 5% for a third consecutive weekly rise. A 5-basis-point 10-year yield increase would usually pressure gold, but both strengthened. Pricing centered on dollar sovereign credit and the fiscal trajectory: buybacks potentially exceeding $4 billion were viewed as a possible longer-run monetization signal. The dollar index near 98.80, a three-month low, and unchanged inflation expectations alongside surging gold suggested a dollar-credit hedge rather than near-term inflation fears. Silver and platinum also rose; markets awaited Monday's Treasury wording.
Equities: stocks resist the rate shock, with a rebound and structural divergence
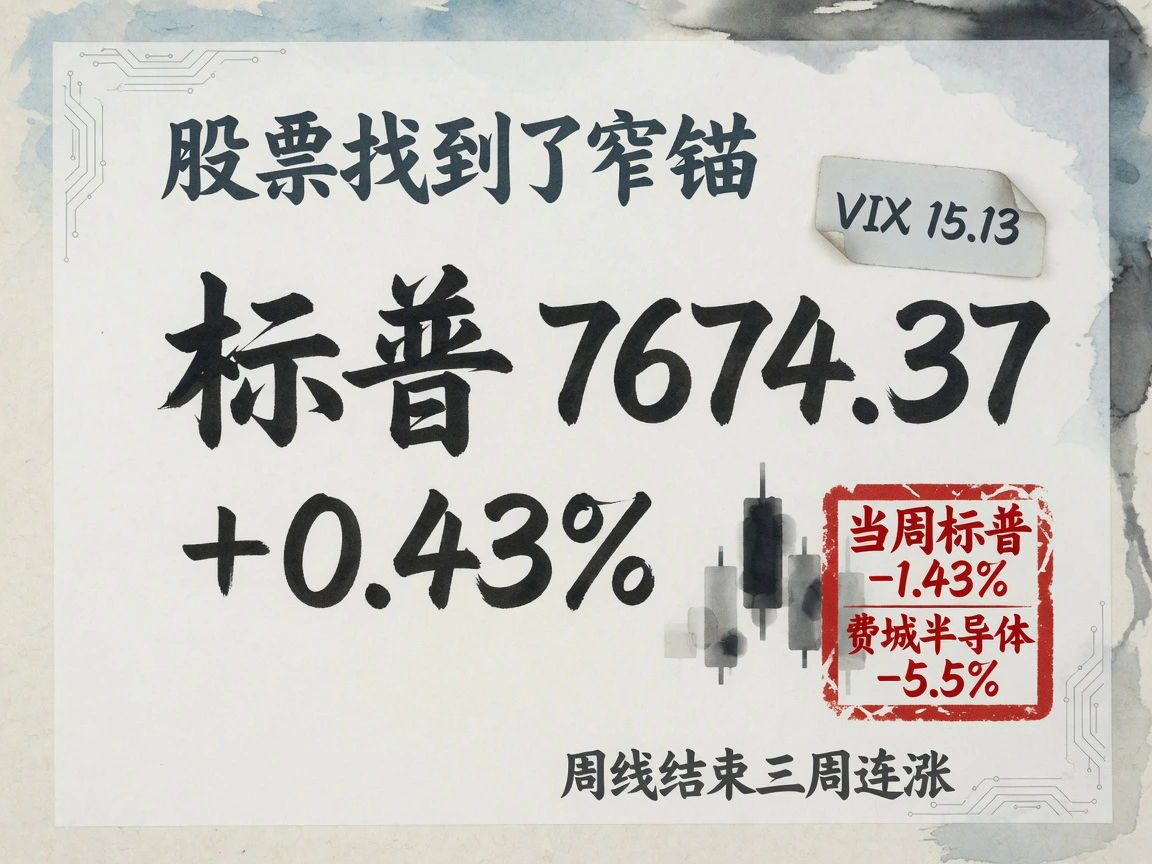
Friday tested whether equities could find support independent of higher benchmarks. They did, but in narrow areas. S&P 500 closed at 7,674.37, +0.43%; Nasdaq Composite 26,180.46, +0.43%; Dow +0.98%; Russell 2000 +0.85%; VIX fell 5.5% to 15.13. About 14.9 billion shares traded, below the 20-day average, suggesting sector rotation and recovery after the previous day's fear.
Three divisions stood out. First, technology giants moved differently: Nasdaq 100 rose just 0.33%, Nvidia slipped about 1% ahead of August 26 after-hours earnings, and Tesla gained 5.14% after Nevada approved commercial Las Vegas Robotaxi licensing. Second, consumer shares diverged: Ross Stores' fiscal-second-quarter revenue was $6.26 billion, comparable sales rose about 10%, and full-year EPS guidance increased by more than $1, lifting shares 4.39%. Walmart was roughly flat after Thursday's decline above 9%. Investors favored high-traffic, strong-value channels amid tariffs and weak consumption. Third, cyclicals and resources led while high-dividend defensives fell: materials +2.2%, Freeport-McMoRan +7.6%, utilities −2.3%, the weakest sector as high yields prompted selling of bond-like stocks. Bitcoin rebounded about 6.4%, lifting related shares. Weekly performance remained weak: S&P 500 −1.43%, Nasdaq −2.05%, both ending three-week winning streaks; Philadelphia semiconductors about −5.5%, keeping AI hardware valuations under pressure.
Friday's Asia-Pacific closes preceded European and US PMI and did not reflect US-session reflation pricing. Nikkei 225 fell 0.30%, almost 4% for the week, its worst since mid-July. KOSPI gained 0.88%, supported by SK Hynix's KRW 40 trillion repurchase-and-cancellation plan and Samsung's 3.87% rise, while growth-heavy KOSDAQ fell 4.63%. Hang Seng rose 1.21%, gaining 3.55% for the week and ending two weekly declines. Alibaba's Hong Kong shares fell 2.54% and its US ADR then 8.57%, showing different regional assessments of AI research spending's pressure on near-term free cash flow.
Geopolitics: sanctions threats remain verbal; substantive contest awaits next week

Friday's geopolitics mainly involved rhetoric and psychological deterrence rather than immediate supply shocks. Bessent had promised severe Iran sanctions Monday; China opposed unilateral sanctions, and Iranian leaders portrayed them as economic warfare after US military setbacks. Visible effects included single-digit daily Hormuz merchant counts and Iranian spot crude offers to China moving from discount to premium, indicating shipping friction. Rates, equities and volatility were not pricing an immediate total Gulf-export cutoff from secondary sanctions as a certain baseline.
Three policy developments followed the close. Treasury formally scheduled Bessent's Monday press conference for 14:00 US Eastern, covering Iran designations and long-end liquidity buybacks. The Energy Department and Central Command jointly released escorted-barrel and diverted-vessel figures to counter fears of total closure, but those differed from real-time merchant monitoring. Finally, a 50% US tariff on about $20 billion of Canadian goods took effect at midnight Saturday US Eastern. Canada suspended talks and began reciprocal measures, stalling North American free-trade negotiations and removing hopes of a weekend compromise.
Next week's pricing anchors were clear: Treasury auctions of two-, five- and seven-year nominal notes on August 25–27 would test whether 4.25%–4.30% was a temporary equilibrium for the two-year yield; July core PCE was due August 26; Jackson Hole opened August 27, with Warsh's keynote at 10:00 US Eastern on the 28th. With expanded fiscal buybacks and higher long yields, central-bank guidance on inflation and terminal rates would determine whether gold strength and Treasury weakness diverged further.


