Understanding the Fed, article 19/20
For consumers across most of the US, higher oil raises living costs and erodes purchasing power. For Texas oil, gas and extraction businesses, it brings cash flow, investment and tax revenue. Tariffs and trade friction similarly raise some imported input prices while restructuring offshore manufacturing and cross-border logistics. In the Eleventh District, the same shock often raises both costs and incomes, revealing opposing sides.
This complexity echoes Dallas's distinctive statistical contribution: trimmed-mean PCE. Rather than preselecting excluded industries, it dynamically trims the most extreme monthly price increases and falls to extract underlying inflation. Combining Texas's economy with this statistical measure helps distinguish local redistribution and temporary relative-price shocks from broad persistent inflation.
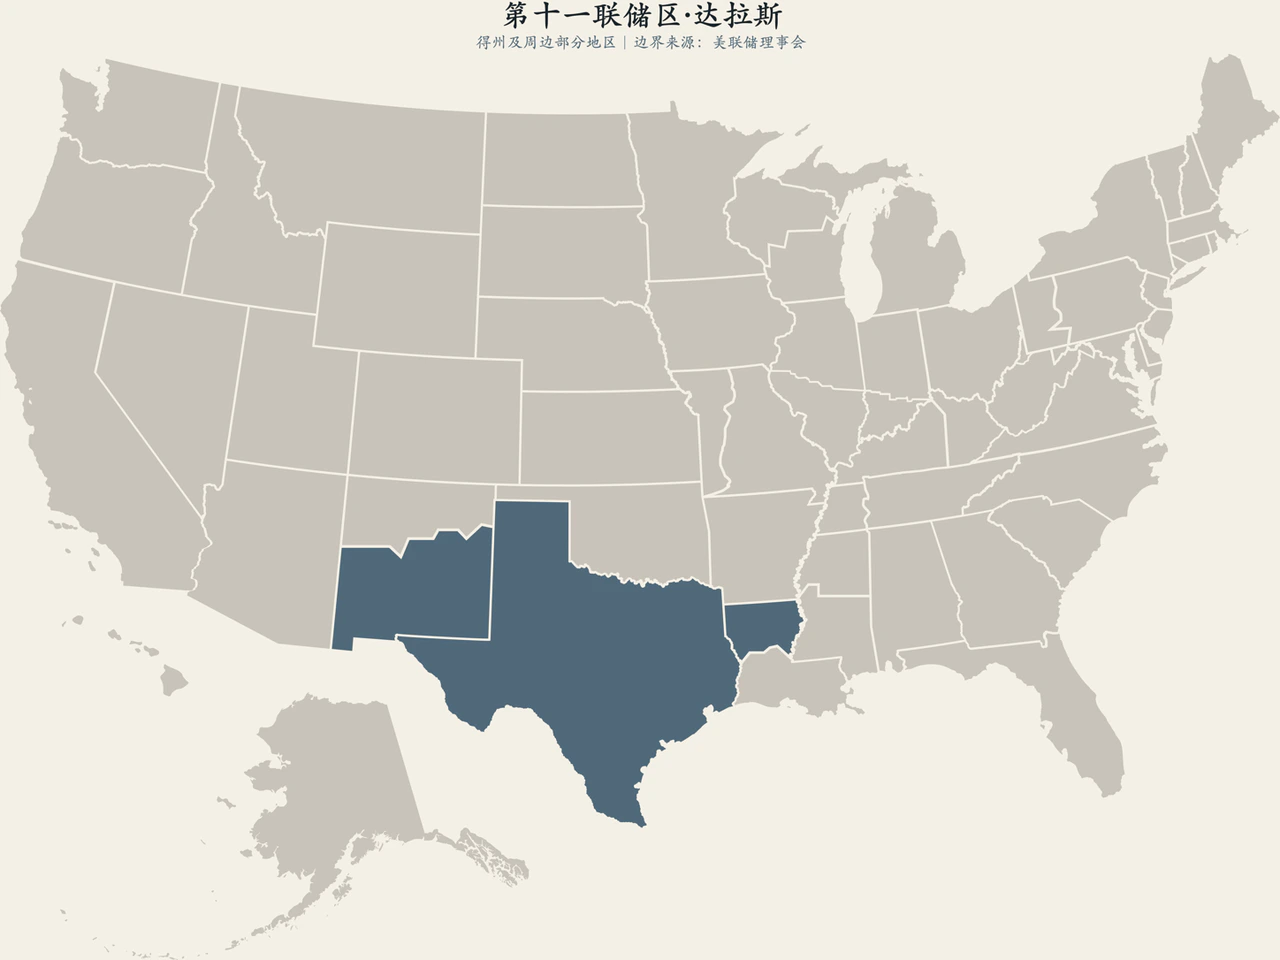
The district covers all Texas, 26 northern Louisiana parishes and 18 southern New Mexico counties, with branches in El Paso, Houston and San Antonio. It is among the country's most dynamic and industrially diverse regions.
1. Texas exposes both sides of supply shocks
The same oil rise boosts some incomes and increases others' bills
Higher oil and gas first improve Permian drilling and oil-service cash flow, then mining-region wages, local finances and investment in pipelines, equipment and engineering. Transport, downstream petrochemicals and household bills face pressure. Today's upstream shale producers have moved beyond indiscriminate expansion: capital discipline, shareholder distributions, quality drilling inventories and forward hedges prevent one-for-one output responses to spot jumps.
Nationally, energy shocks act as a supply-side tax, raising nominal inflation and squeezing real consumption. In Texas they can support local income and investment. The FOMC must separate one-off relative-price jumps from persistent broad inflation. An oil jump alone is insufficient for mechanical tightening; sustained transmission into wages, logistics, services and entrenched expectations changes the policy logic.
US-Mexico supply chains and migration add two more variables
Nearshoring corridors through El Paso and Laredo connect dense US-Mexico auto-parts, electronics, machinery and consumer-goods chains. Tariffs, customs efficiency, FX and Mexico's manufacturing cycle affect orders, delivery times and input prices together. Relocation has long lags: factories and upfront investment quickly raise capital and labor demand, but effective capacity that lowers prices can take years.
Over a decade of people and firms moving to Texas adds long-term momentum. Inflows expand labor supply and consumption but pressure housing, transport and public services. Houston energy, Dallas finance and headquarters, Austin technology, and San Antonio and border logistics have very different cycles and resilience, beyond one state GDP number. Branches and business surveys help Dallas see through aggregates to those distinct rhythms.
2. Four business surveys and a changing inflation ruler
Manufacturing, services, retail and energy capture Texas today
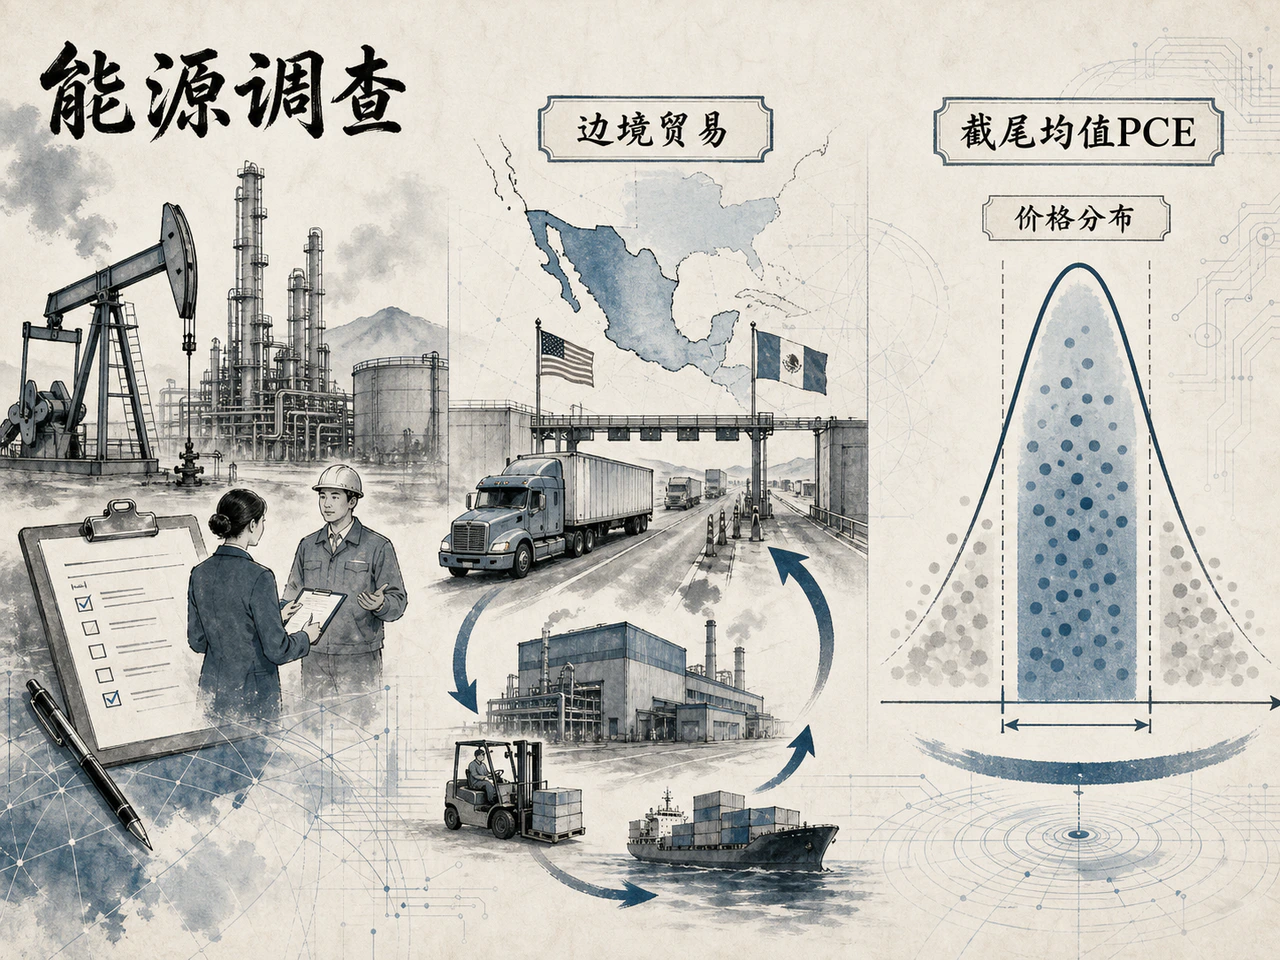
Dallas publishes monthly Texas manufacturing (TMOS), services (TSSOS) and retail (TRS) surveys and its quarterly Energy Survey. Diffusion indices show the breadth of improving or deteriorating business conditions; special questions explore wages, input prices, labor shortages and capex. Energy focuses on oil and gas, while manufacturing and services cover wider business activity.
The value lies in divergences and common signals across surveys rather than one headline. Strong energy activity, weaker manufacturing orders and high service input prices suggest sharply differing costs and incomes. Simultaneous expansion across all four often indicates overheating demand and broad pressure. Active production with weaker hiring may reflect productivity or defensive staffing under high rates. This multidimensional micro picture can reveal more than lagged aggregates.
Trimmed-mean PCE decides afresh each month what to remove
Dallas's trimmed-mean PCE is a prominent underlying-inflation tool. It orders detailed PCE components by monthly price change, removes extreme spending weights at both tails—typically about 24% at the lower and 31% at the upper end—and averages the middle using weights.
Its distinctive feature is dynamic selection: excluded components change each month, unlike core PCE's permanent food-and-energy exclusion. It does not assume particular industries are noise, instead filtering outliers driven by unusual events. Used-car spikes or airfare swings are less likely to dominate, producing smoother trends and more robust guidance for medium- and long-term inflation.
It is not universal. Persistent skew can be problematic: if tariffs or supply shocks push many essential goods into the upper tail, mechanical trimming may erase emerging broad inflation as noise. Long commodity deflation concentrated at the bottom may similarly understate downside pressure. Policymakers therefore compare trimmed mean, headline, core and median measures to cross-check underlying inflation.
3. Test energy and indicators before reading policy positions

Lorie Logan has a formal vote in 2026
Lorie K. Logan became Dallas president in August 2022 after years overseeing SOMA at the New York Fed's Open Market Desk. Her market-operations background provides deep expertise in interbank liquidity, repo, QT and changing financial conditions. With the Eleventh District's rotating FOMC vote in 2026, her comments directly bear on decisions.
Recent remarks emphasize risks that inflation has not sustainably returned to 2%, labor-market balance and the restrictiveness of rates. Her experience should not produce a fixed label. The focus should be how she combines trimmed price distributions, regional supply and demand, and financial-market liquidity into a decision framework.
Two stress tests can prevent most misreadings
The first asks whether oil is an isolated relative-price move or has penetrated logistics, housing and wages and become self-reinforcing expectations. The second asks why trimmed trends differ from headline, core and price breadth. Without explaining the distribution behind divergence, investors should not simply choose the curve matching their position.
Texas and its surveys form a laboratory for shocks. Energy income's spillover into services and rent, trade policy's effect on border orders and freight, and migration's ability to ease service wages can be tested locally before assessing whether they represent redistribution or aggregate inflation nationally.
Dallas's lesson is to examine economic and statistical structure together. Producing-region prosperity reveals income spillovers from supply shocks, while trimmed means illuminate the distribution of price moves. Rapid growth can hide structural tensions: migration and capital make jobs, spending and construction look strong while per-capita output, housing affordability and infrastructure capacity differ. Surging border freight may reflect demand or temporary stockpiling and transshipment. Separating quantities, prices and per-capita measures, and short shocks from long trends, explains what actually moves policy.