Macroeconomic Research | Information as of August 24, 2026, 08:29 Beijing time
Treasury daily changes: U.S. Treasury cash-market close to close
From February to July 2026, the World Bank's monthly average gold price fell from $5,020 to $4,073 an ounce, a decline of 18.9%. Over the same period, the monthly average ten-year TIPS real yield rose 53 basis points and the broad dollar index gained 2.3%. Gold's real opportunity cost increased as its pricing currency strengthened, combining two downward forces. First-half gold prices thus remained firmly constrained by the traditional interest-rate framework.
In August, however, long nominal Treasury yields broke higher and ten-year TIPS real yields remained elevated, yet gold rebounded sharply. Why did high rates no longer produce a stronger dollar, and how could gold rise against high real yields? The answer lies inside the yield curve: recent incremental long-yield gains had shifted from real-rate increases to greater inflation compensation and term premiums. Correspondingly, both the dollar and September Fed hike odds turned lower.
1. The internal composition of rising Treasury yields
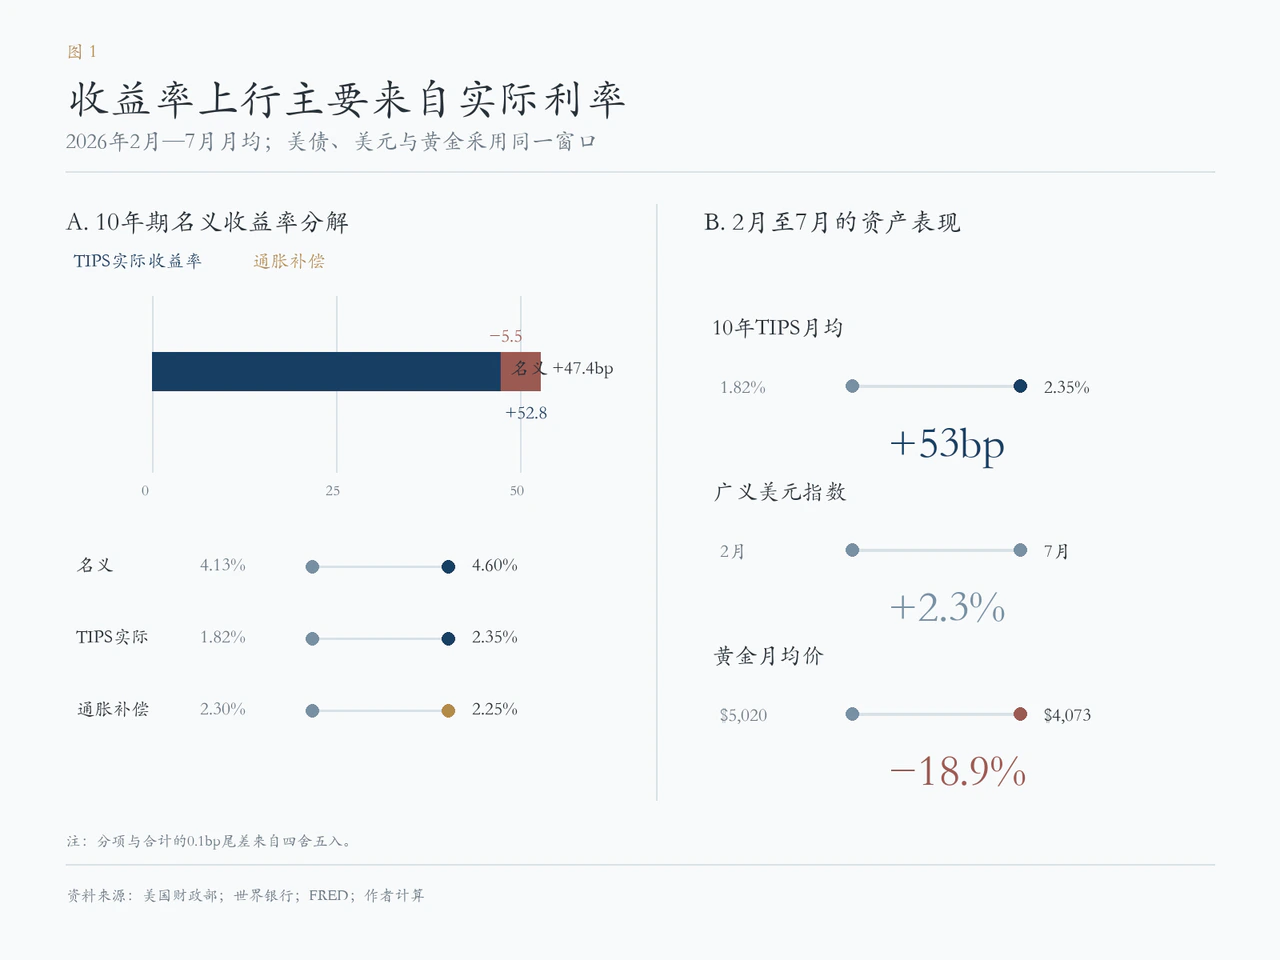
February–July monthly averages show the nominal ten-year Treasury yield rising from 4.13% to 4.60%, or 47.4 basis points. The matched TIPS real yield increased from 1.82% to 2.35%, or 52.8 basis points, while inflation compensation fell from 2.30% to 2.25%, or 5.5 basis points. Under the standard Fisher decomposition, nominal yields approximately equal TIPS real yields plus breakeven inflation. Nearly all the first-half long-yield increase came from real rates; inflation compensation slightly offset it. U.S. Treasury nominal yield curve; U.S. Treasury real yield curve.
Over the same period, monthly average gold fell 18.9%, from $5,020 to $4,073 an ounce, while the broad dollar gained 2.3%. Through July, pricing remained consistent with the conventional macro framework: rising real holding costs were the main pressure, and dollar appreciation amplified the decline.
Extending the window from February 27 to August 21, five-, ten- and 30-year nominal yields rose 92, 77 and 63 basis points, respectively. Their TIPS real yields rose 98, 68 and 57 basis points, while inflation compensation changed -6, +9 and +6. Real-rate restraint therefore persisted into late August. This longer period includes trading windows outside the monthly gold comparison above, so the two sets of changes should not be mechanically treated as contemporaneous.
The short end requires a different interpretation. Because there is no standard two-year TIPS for routine high-frequency tracking, the nominal two-year Treasury yield mainly reflects average expectations for overnight policy rates over the next two years, plus some term premium. Subtracting matched expected inflation conceptually approximates the ex-ante real return over two years, but remains a proxy. It is neither a seamlessly tradable pure two-year real rate nor simply “the current policy rate plus one-year expected inflation.”
The New York Fed's ACM (Adrian–Crump–Moench) model offers a different decomposition: long nominal yields consist of an average expected path of future nominal short rates and a term premium. From February 27 to August 20, fitted two-year yields rose 74.6 basis points, including 57.4 from higher expected short rates and 17.2 from term premiums. Fitted ten-year yields rose 72.5 basis points, with contributions of 50.8 and 21.7. New York Fed ACM term-premium model. The TIPS identity separates real rates from inflation compensation; ACM separates pure rate expectations from maturity-risk compensation. They examine different dimensions and their independent components cannot be mixed and added across frameworks.
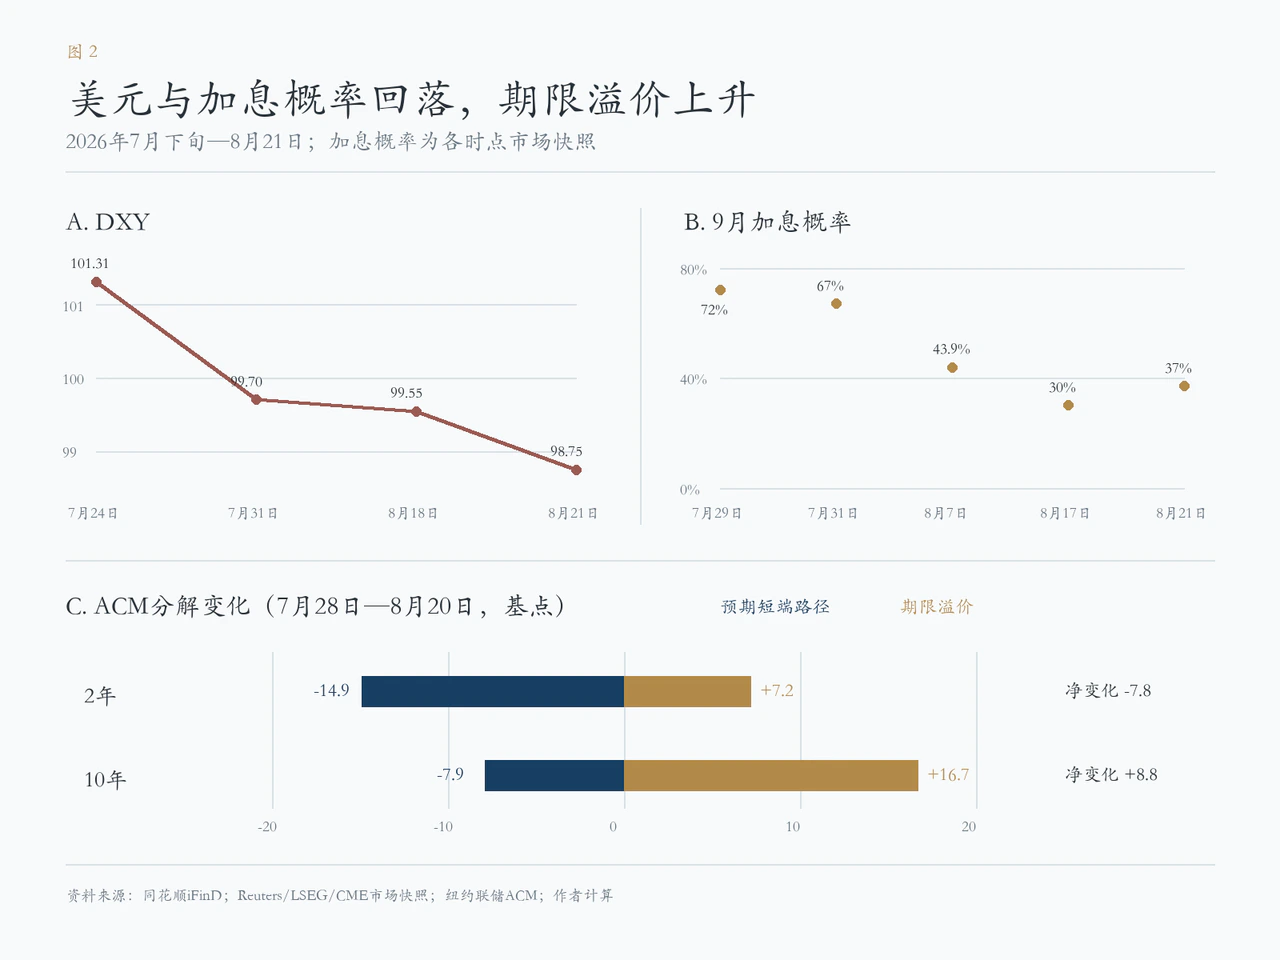
The key marginal turn came in late July. From July 28 to August 21, the two-year yield edged down from 4.26% to 4.24%, while the ten-year rose from 4.61% to 4.74%. The ten-year TIPS yield slipped from 2.41% to 2.40%. Applying nominal yield = TIPS real yield + inflation compensation, almost all the 13-basis-point nominal increase corresponded to higher inflation compensation. Meanwhile, ACM expected-short-rate paths for two and ten years fell 14.9 and 7.9 basis points through August 20, while the ten-year term premium rose 16.7. Recent long-end highs thus mainly reflected repricing of inflation compensation and term premiums, without a further increase in the expected short-policy-rate endpoint. Gold's strong August rebound occurred precisely during this structural shift.
2. Gold's August rebound: the dollar, fiscal policy and timing
To exclude contract rolls and fading prompt-delivery liquidity, daily tracking consistently uses December 2026 COMEX gold settlements. That contract rebounded from $4,107.0 on July 31 to $4,680.6 on August 21, up 14.0%. It had already reached $4,399.7 by August 7, a first-stage gain of 7.1%. CME daily settlement basis; Reuters August 21 gold review. When Treasury announced expanded long-bond buybacks on August 19, gold had already risen for two weeks. The announcement amplified that day's intraday move but could not explain the preceding sustained gains. The real shift began in late July, when the dollar and September hike odds peaked and turned down, while long Treasury term premiums widened faster under fiscal-supply pressure.
1. The dollar: relative rate expectations weaken before long yields
iFinD data show two dollar declines. From July 24–31, DXY fell from 101.310 to 99.705, or 1.58%. It then fluctuated at low levels through August 18, slipping 0.16%, before falling another 0.80% through August 21 to 98.750. The full July 24–August 21 decline was 2.53%. The Fed's trade-weighted broad dollar index also fell from 120.6247 on July 28 to 118.9028 on August 14, down 1.43%. Their simultaneous declines showed broad dollar weakness, rather than a coincidence caused by one currency's weight. Federal Reserve broad dollar index.
The first late-July adjustment mainly reflected rebalancing expectations of relative policy paths among major economies. Further Fed tightening had been heavily priced before July's FOMC. After the July 29 vote of nine to three to hold the target at 3.50%–3.75%, short-rate markets partly unwound aggressive September hike bets. July Fed statement; July Fed minutes. Japanese FX intervention and expectations of further Bank of Japan normalization also compressed relative U.S.–Japan rate advantages. Reuters FX review. For currencies, expected U.S. short returns relative to other major economies matter much more than the absolute peak of the U.S. nominal ten-year yield.
ACM corroborates the transmission. From July 28 to August 20, expected-short-rate paths for two and ten years fell 14.9 and 7.9 basis points, while term premiums rose 7.2 and 16.7. The former weakened dollar assets' relative-rate support; the latter showed investors requiring more compensation for U.S. duration risk. Lower rate expectations and higher term premiums can coexist, explaining why higher nominal ten-year yields failed to lift the dollar automatically.
The dollar's second weakening began around August 19. Treasury raised the operational caps for liquidity-support buybacks of long-duration securities, and DXY fell 0.86% that day. Although the program was limited in size and was no form of QE, it signaled Treasury's unwillingness to ignore deteriorating long-end liquidity. Over the next two sessions, ten- and 30-year yields largely recovered their announcement-day declines, but the dollar did not rebound with them. Reuters August 21 FX review. The dollar discount that persisted after yields returned higher reflected deeper concern over fiscal expansion and uncertainty in public-debt management.
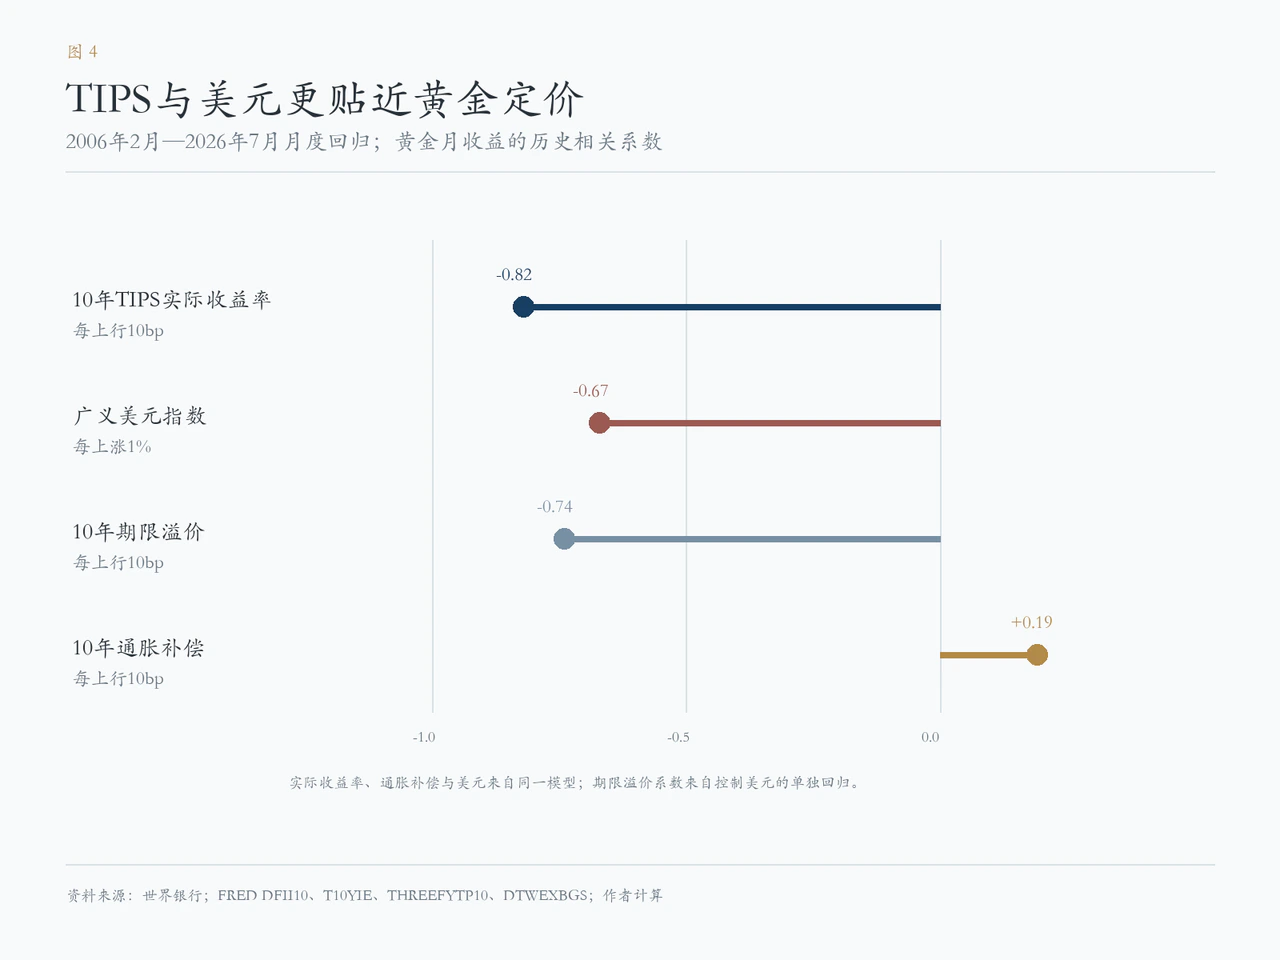
Monthly regressions from February 2006 to July 2026 show that, controlling for ten-year TIPS real yields and ten-year inflation compensation, a 1% broad-dollar increase was associated with about a 0.67-percentage-point reduction in gold's monthly return. Across 42 months with rising real rates but a weaker dollar, gold still delivered a positive average return. Dollar declines reduced non-U.S. purchasing costs and cushioned some pressure from high real rates. Real rates still constrained gold; the dollar had simply stopped reinforcing that downward pressure.
2. Fiscal policy: how duration supply reaches gold
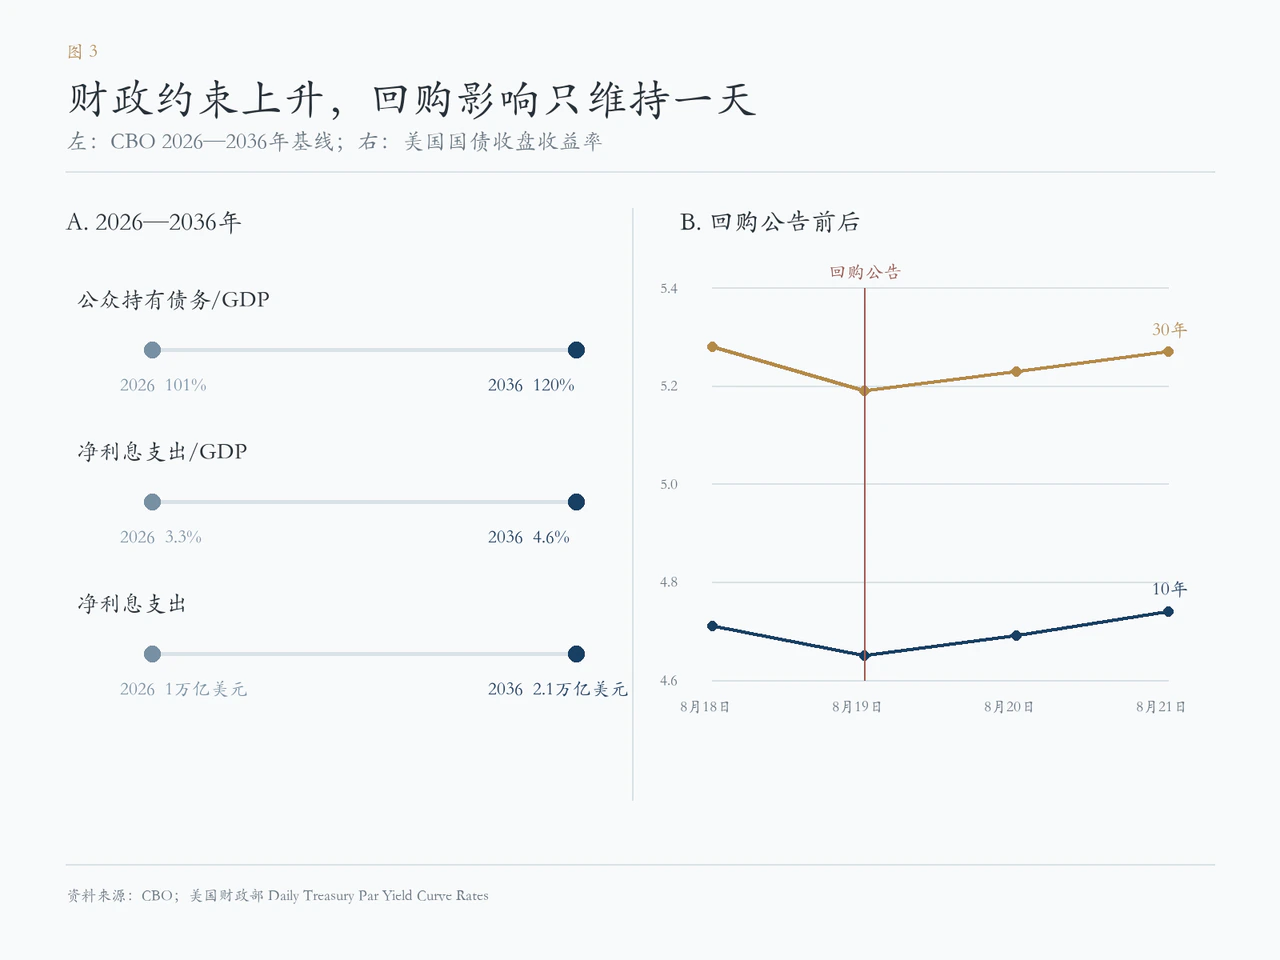
The CBO's February baseline projected a fiscal 2026 deficit of $1.9 trillion, or 5.8% of GDP, with publicly held federal debt at 101% of GDP. By 2036, the deficit would reach $3.1 trillion, debt 120% of GDP and net interest $2.1 trillion versus $1.0 trillion. Its latest August monthly tracking raised the fiscal 2026 deficit estimate to $2.1 trillion. Through July, the first ten fiscal months' deficit was $1.798 trillion and net interest $963 billion, up $117 billion or 14% year on year. CBO Budget and Economic Outlook; CBO latest Monthly Budget Review.
Rolling debt raises interest bills, which widen deficits and require more refinancing and net issuance, increasing the Treasury supply private investors must absorb. Some net funding is in short bills without significant duration, so it is not all a duration shock, but intermediate and long supply has also expanded. Treasury's August refunding plan envisaged about $1.04 trillion of coupon notes, bonds and FRNs for August–October, including roughly $231 billion of ten-, 20- and 30-year benchmarks. Gross federal debt crossed $40 trillion on August 18, including $32.27 trillion publicly held. Treasury Debt to the Penny. Treasury raised July–September net marketable borrowing from private investors to $739 billion, $68 billion above May's estimate, and expected another $628 billion in October–December. Treasury quarterly borrowing estimates; Treasury August refunding statement.
Auctions were still clearing normally. The August 12 ten-year auction stopped at 4.683%, with a 2.53 bid-to-cover ratio and 76.7% allocated to indirect bidders, including foreign institutions. The next day's 30-year auction yielded 5.216%, covered 2.39 times. The August 20 30-year TIPS auction cleared at a 2.973% real yield with 2.82 coverage. Treasury auction database. Buyers had not disappeared; longer duration required higher yields to match supply. Fiscal pressure first appeared through rising marginal financing costs.
ACM term premiums recorded the transition. Over the full late-February to mid-August period, about 70% of the ten-year yield rise came from higher expected policy short rates, so the whole year's surge cannot simply be attributed to fiscal factors. From June 30 to July 31 alone, however, the fitted ten-year yield rose 34.6 basis points, of which 32.5 came from term premium and just 2.1 from expected short rates. Incremental long-yield momentum had shifted fully toward duration-risk compensation, incorporating not only fiscal supply but long-term inflation uncertainty, rate volatility and foreign institutions' duration preferences.
Treasury's August 19 liquidity-buyback announcement revealed the long end's sensitivity to policy signals. It raised the per-operation cap for ten-to-20-year and 20-to-30-year nominal securities from $2 billion to at least $4 billion. Ten- and 30-year yields fell six and nine basis points that day. By August 21, however, the ten-year had rebounded from its pre-announcement 4.71% to 4.74%, while the 30-year was back at 5.27% versus 5.28% beforehand. Treasury long-bond buyback announcement. Official compression of term premiums was fleeting and, chronologically, could not explain gold's rise since early August.
Fiscal risk can reach gold through two opposing mechanisms. Duration supply may raise real term premiums, including TIPS yields, directly increasing the opportunity cost of a non-interest-bearing asset. Alternatively, higher long yields may express greater compensation for sovereign duration and fiscal credibility risk. With a simultaneous weaker dollar, diversification and sovereign-credit hedging demand can substantially offset rate pressure. The latter mechanism operated in this episode: wider term premiums and dollar weakness transmitted fiscal risk, leaving long nominal yields high but creating valuation room for gold's rebound.
3. September timing: lower probabilities, persistent inflation constraints
From late July to mid-August, September hike pricing fell markedly. Reuters, LSEG and CME intraday snapshots differ in sampling and should not be joined into a strict continuous series, but their direction agreed: odds were around 70% near July 29, roughly 67% on July 31, 43.9% after August 7 payrolls, 38%–40% after August 12 CPI and briefly near 30% on August 17. Reuters August 7 rate pricing; Reuters August 17 rate pricing. A September hike moved from the main baseline to a less-than-even event. Futures sharply reduced the tightening premium without turning to rate-cut trading.
Corroborating fundamentals drove the turn. July payrolls fell 23,000, versus an expected 80,000 gain, and May–June additions were revised down by a combined 103,000. ADP private employment rose 44,000. July CPI increased 0.1% monthly and core CPI 0.2%, neither above consensus, although both rebounded from June's -0.4% and 0.0%. Headline annual CPI remained 3.4% and core 2.5%. July PPI was flat, below the expected 0.2%, but still up 4.7% annually. Core PPI excluding food, energy and trade services rose 0.4% monthly and 4.7% annually. Retail sales fell 0.6%, versus a forecast 0.1% rise. BLS July employment report; BLS July CPI; BLS PPI; Census retail sales. Cooler employment and domestic demand, without above-expected monthly inflation acceleration, reduced the need for an immediate September hike. Sticky annual inflation and rigid upstream costs nevertheless prevented a conclusion of comprehensive disinflation.
S&P Global's August 21 flash PMI partly restored hawkish expectations. The U.S. composite rose from 54.5 to 56.0, highest since April 2022. Services jumped from 54.6 to 56.8, above the 54.0 consensus and highest since December 2024. The employment index grew fastest since January 2025, the second-fastest pace in nearly four years. S&P estimated third-quarter annualized GDP growth near 3%, versus 1.5% in the second quarter. S&P Global U.S. August flash PMI.
PMI employment measures the diffusion of staffing intentions and cannot be equated with official job additions. Latest weekly initial claims fell from 212,000 to 206,000, showing low layoffs, but continuing claims rose to 1.799 million, suggesting reemployment had not improved alongside them. Weak official hiring and stronger business surveys and layoff indicators left mixed labor signals.
After PMI, the August 21 09:55 Eastern futures snapshot showed September hike odds rising from 35.3% the previous day to 37.0%, against the previous week's low of 29.3%. Federal funds futures probabilities. Price components were also mixed: input-cost growth slowed to its weakest since February but levels remained historically high, largely because of energy, while selling-price growth eased. This gave the Fed room to wait for more data. Futures lowered the probability of immediate September action without excluding further tightening afterward.
Oil was another real constraint. Brent closed August 21 at $94.39 a barrel, up 6.39% that week for a second consecutive weekly gain. EIA weekly average spot prices rose from $87.86 on August 7 to $92.51 on August 14, about 30% above $71.36 on February 27 before the Middle Eastern escalation. EIA weekly Brent spot data; Reuters August 21 oil review. Conflict, Hormuz risks and sanctions premiums could transmit through energy into inflation at any time. Firm services and rising oil partly revived September hike odds after PMI, but probabilities remained far below late July, reflecting easing selling-price growth, weak July official hiring and the FOMC's preference to preserve an observation window before August payrolls and CPI.
For gold, short-end repricing slowed the further increase in holding costs and opened room for an August rebound. Ten-year TIPS real yields remained high, however, so medium-term real-rate pressure had not disappeared.
3. Looking through nominal yields to gold pricing
Watching only nominal ten-year yields can mislead gold analysis. Long nominal yields aggregate several forces and are ill-suited as a sole pricing indicator. Medium-term opportunity costs are more directly represented by five- or ten-year TIPS yields. Policy timing is assessed through fed funds futures, OIS and two-year Treasury yields; global currency effects through the Fed's broad dollar index, supplemented by DXY for short-term sentiment. Inflation hedging corresponds to matched breakevens or inflation swaps. Long-end supply pressure requires ACM or Kim–Wright term-premium models, auction coverage and Treasury financing plans together.
These effects are asymmetric. Higher real yields historically exert the most consistent negative pressure on gold. Higher inflation compensation should theoretically strengthen inflation-hedging demand, but breakevens mix expected inflation, risk compensation and TIPS liquidity discounts relative to nominal bonds, leaving a weaker empirical relationship. Term-premium direction depends on the cause: higher TIPS real yields increase opportunity costs, while compensation for sovereign duration and fiscal credibility risks accompanied by dollar weakness can generate hedging demand that effectively offsets part of the rate pressure. As the global pricing currency, the dollar directly affects non-U.S. purchasing power and has generally correlated negatively with gold.
Monthly multivariate regressions for February 2006–July 2026 support this ordering. In the baseline controlling for ten-year inflation compensation and the broad dollar, each ten-basis-point rise in ten-year TIPS yields is associated with about a 0.82-percentage-point decline in monthly gold returns. Each 1% dollar rise corresponds to about -0.67 percentage point. Inflation compensation has a positive but statistically insignificant coefficient. In a separate model with the ten-year ACM premium and broad dollar, each ten-basis-point premium increase, controlling for the dollar, is associated with a 0.74-percentage-point drag. These coefficients describe historical averages; causal transmission strengths can change across regimes.
Practical daily gold monitoring should begin with TIPS real yields and the dollar: real opportunity cost and currency pressure. Further analysis can split TIPS changes into expected future real short rates and real term premiums, and trace the dollar to relative short-policy differences or fiscal and liquidity discounts. Each nominal long-end move can be examined through real rates, inflation compensation and term premium. A single nominal ten-year reading compresses opposing forces into an ambiguous number.
4. Real rates and the dollar across historical windows
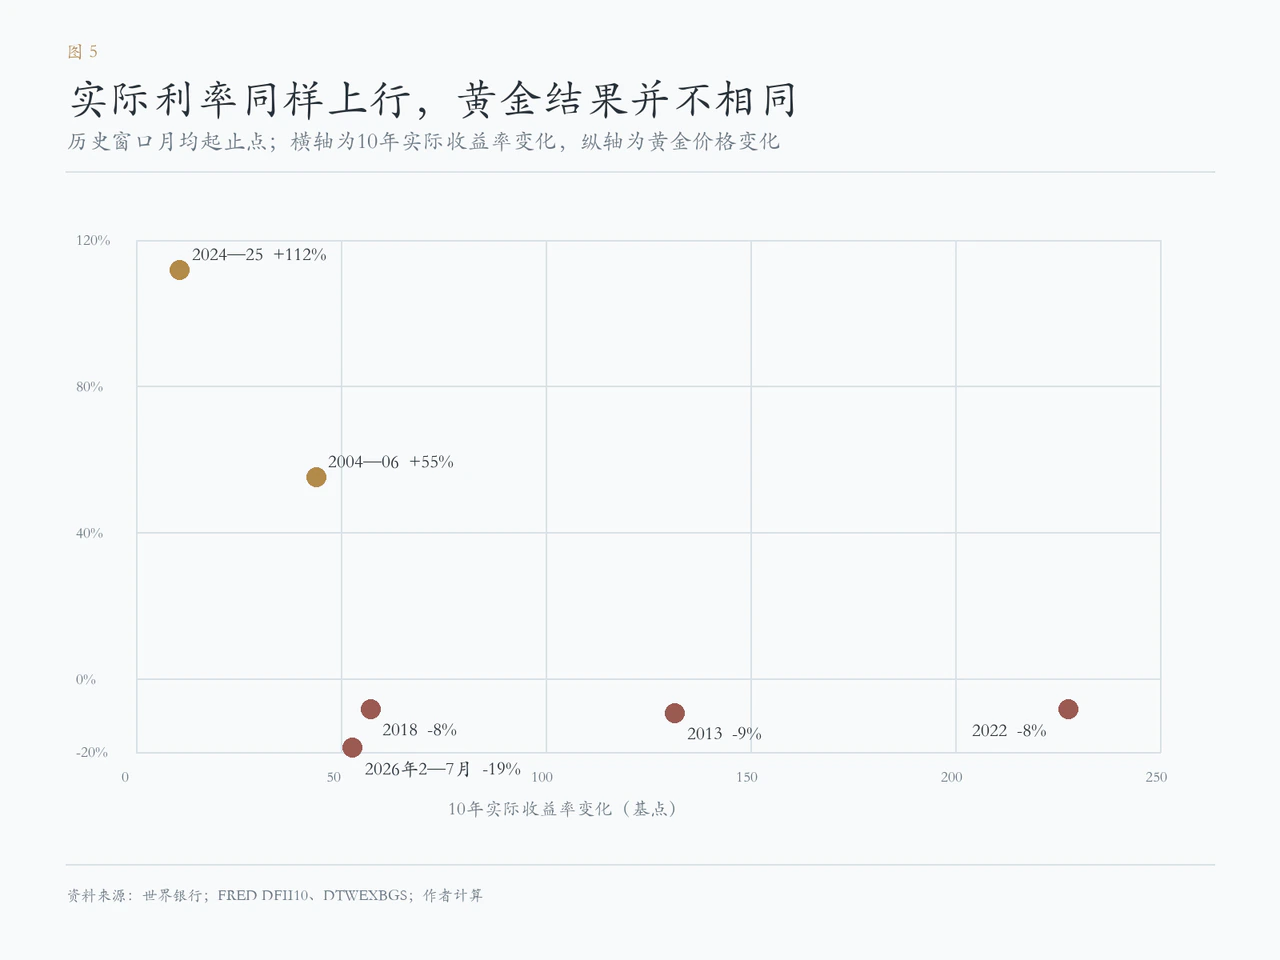
When real rates and the dollar strengthen together, gold generally faces more persistent downside. In the April–September 2013 taper tantrum, ten-year real yields rose about 132 basis points and gold fell roughly 9%. During January–November 2018 tightening, real yields rose 57 basis points, the broad dollar gained 7.2% and gold fell 8%. During January–October 2022's exceptional hikes, real yields climbed 228 basis points, the dollar rose 10.8% and gold again fell 8%. February–July 2026 showed the same double headwind, with gold down 18.9%.
May 2004–June 2006 offers a contrasting case. Ten-year real yields rose 44 basis points during that hiking cycle, yet gold gained 55%. Treasury term premiums fell about 61 basis points, the dollar did not sustain appreciation comparable to 2018 or 2022, and commodity and inflation cycles strengthened hedging demand. Another exception was 2024–2025: monthly average gold rose 112%, while ten-year real yields increased only about 11 basis points and the broad dollar was broadly flat. Stronger official reserves and Asian physical demand reshaped fundamentals.
These examples do not imply that high rates benefit gold. They show that real-rate pressure depends on whether the dollar, policy expectations and demand reinforce it. August 2026 resembles 2004–2006 only in the marginal factor combination: a weaker dollar, incremental long-yield gains absorbed more by inflation compensation and term premiums, and no further upward revision of nominal short-rate expectations. Growth, deficits and geopolitics differ greatly between the periods. History helps identify mechanisms, rather than directly benchmark price changes.
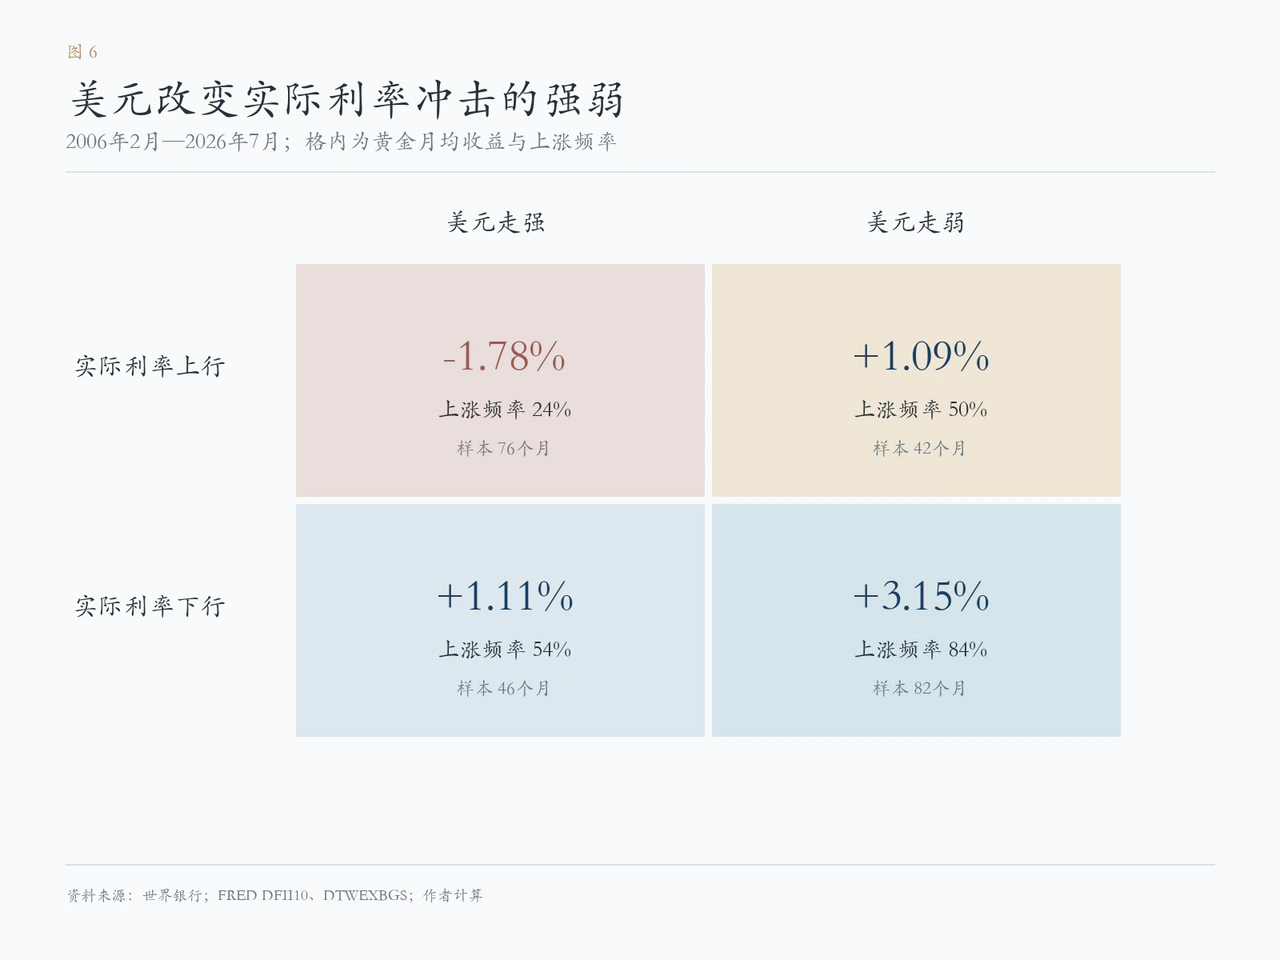
The long monthly sample quantifies the differences. Across 76 months when real rates and the dollar both rose, gold's average monthly return was -1.78%, with gains in only 24%. Across 42 months with higher real rates but a weaker dollar, the average became +1.09%, with gains in 50%. When both fell, gold averaged +3.15%, with gains in 84%. The dollar did not replace real rates as the dominant variable, but its direction often materially amplified or cushioned their marginal valuation impact.
5. Real rates remain elevated
Through July, higher real rates drove most long-yield gains, while the short end mainly reflected a higher expected tightening path. Real rates and the dollar rose together and gold remained pressured. The resulting medium-term high-rate constraint had not fundamentally disappeared in August.
Gold rebounded from its lows in August because three marginal factors changed: First, lower relative U.S. short-policy expectations weakened the dollar, followed by an additional currency discount from deficits and debt-management uncertainty. Second, enormous duration supply required private investors to absorb bonds at higher yields. Higher term premiums lifted long nominal yields without equivalent dollar support. Third, weak payrolls and retail sales reduced immediate September hike odds from around 70% to 30%–40%, stopping short-end holding costs from deteriorating faster. Strong services PMI and renewed oil gains later partly restored hawkish pricing, but cooler hike expectations mainly changed timing. The longer-term contest among growth, employment and inflation remained.
This combination defines the current market: inflation compensation and term premiums keep nominal ten-year yields rising while two-year policy expectations and the dollar weaken. Gold still carries high-real-rate pressure, but the dollar's reinforcing drag has clearly faded. Recent gains reflect a changed marginal factor mix; until macro fundamentals genuinely enter a rate-cutting phase, the longer-term high-rate constraint remains.
Data definitions: Monthly spot gold uses the World Bank Commodity Markets “Pink Sheet” Gold series in dollars per troy ounce. August daily gold uses iFinD December 2026 COMEX settlements; DXY uses daily dollar-index data. Nominal Treasury and TIPS yields, and their difference as breakeven inflation, use same-day Treasury cash-market closing curves. Expected short-rate paths and term premiums use the New York Fed ACM zero-coupon model; fitted yields are compared only within ACM, without mixing Treasury coupon yields. Long-run empirical Treasury and broad-dollar daily series from FRED are averaged monthly and aligned with Pink Sheet monthly gold.


