International crude futures suffered a second consecutive sharp decline on August 25, taking both benchmarks to near two-week lows. Official settlements put the main October WTI contract at $82.36 a barrel, down $2.65, or approximately 3.1%, and October Brent at $88.58, down $3.59, or approximately 3.9%. Including the roughly 2.35% declines on August 24, the benchmarks lost about 5.4% and 6.2% in just two sessions.
The decline continued in overnight and early electronic trading. In the snapshot around 08:18 Beijing time on August 26, WTI fell further to $80.87 and Brent to $85.77. These are unsettled electronic quotations at a specific time, reflecting marginal market liquidity rather than daily settlements.
The catalysts had nothing to do with additional physical supply. They came entirely from a dense series of diplomatic signals: traders interpreted US sanctions as economic pressure replacing military escalation; Iran and Oman discussed a temporary Hormuz corridor; and Washington announced completed mine clearance in international waters. Financial derivatives were racing to price a peace dividend. Yet daily commercial tanker passages remained in single digits, and extremely high freight and war-risk insurance costs had not fallen at all. Futures were removing only an expectations-based war premium; the physical reality of Gulf crude exports remained frozen.
In Two Days, the Market Changed Its Hand
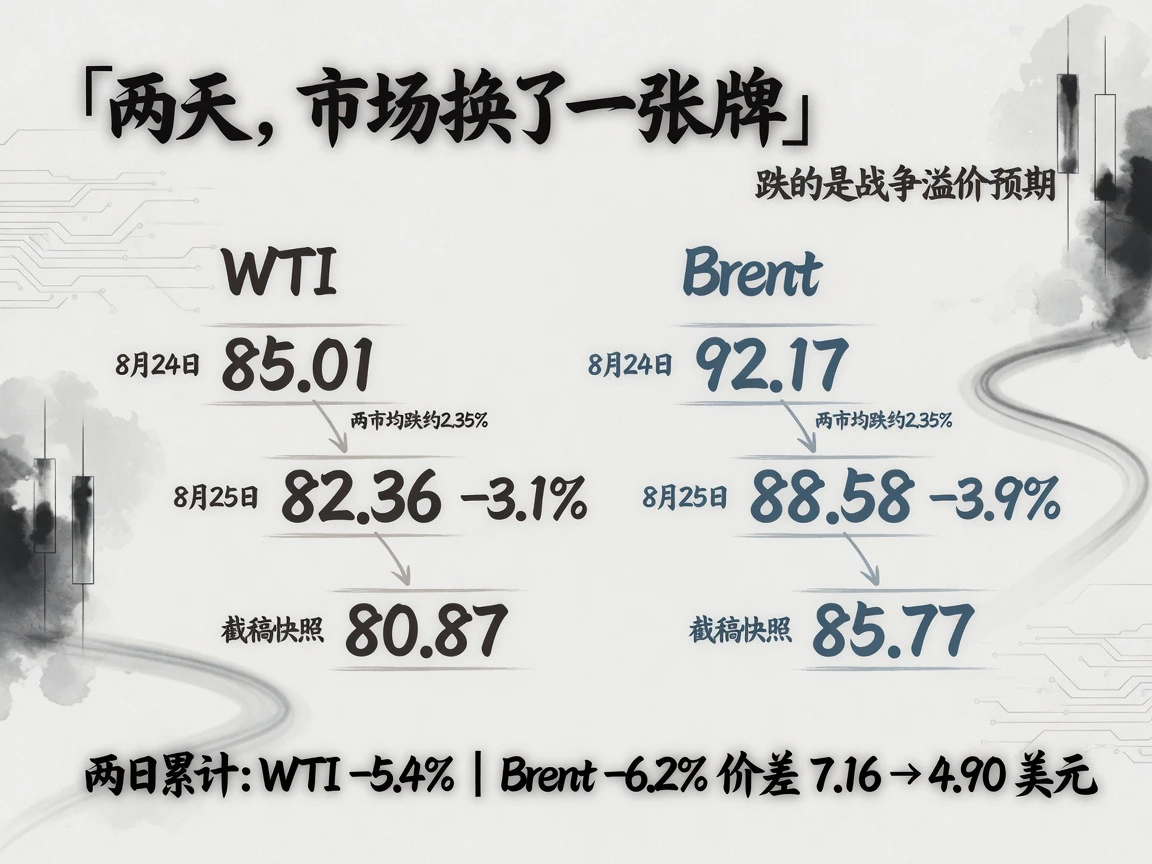
On August 24, WTI settled at $85.01 and Brent at $92.17, each down approximately 2.35%. Selling intensified on August 25, with another 3.1% and 3.9% decline to their lowest since August 13 and August 14, respectively. Relative to August 21 closes, the two-day losses were approximately 5.4% for WTI and 6.2% for Brent. Using August 26 electronic lows of $80.87 and $85.77 expands the declines from August 21 highs to around 7.1% and 9.1%.
The asymmetry matters: Brent fell much more than WTI. The Brent–WTI spread narrowed rapidly from $7.16 at the August 24 settlement to $6.22 on August 25 and roughly $4.90 in the electronic snapshot. Brent, the global seaborne crude benchmark, is far more exposed to Gulf shipping disruption than inland-oriented WTI. When expectations of maritime disruption ease, Brent bears the brunt of short selling, stripping out the premium for a blocked shipping chokepoint first.
The term structure was not fundamentally broken; the curve largely shifted downward. In the snapshot, clear backwardation remained: WTI traded near $81 at the front and declined toward $77 for January 2027, while Brent's calendar slope was approximately -$2 per month. The intact tight-nearby, looser-deferred structure shows physical buyers still feared short-term shortages. What moved lower was the starting price for the assumed gradual return of seaborne crude flows.
An Unexpected Inventory Build Meets Easing Geopolitical Tension
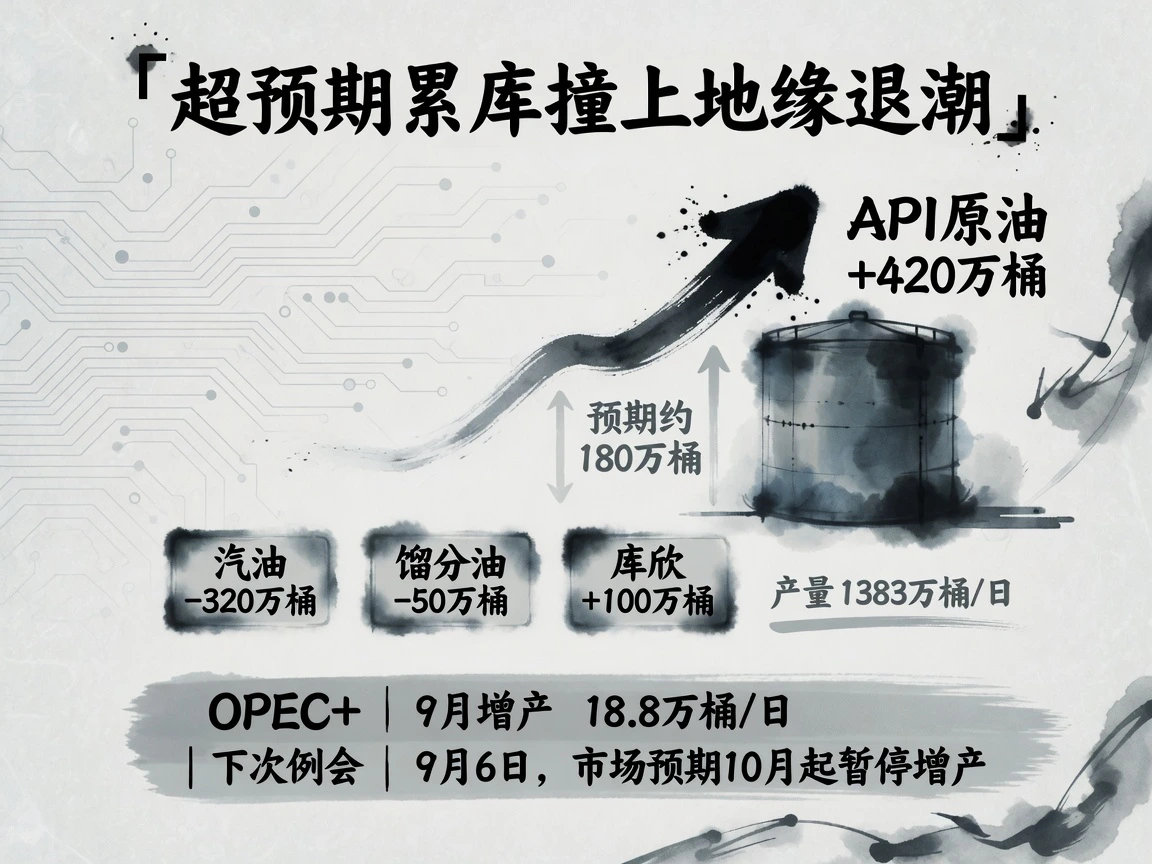
After the August 25 US equity close, around 04:30 Beijing time on August 26, API released industry inventory figures for the week ended August 21. Commercial crude stocks rose 4.2 million barrels, far above the expected 1.8 million–1.9 million build and reversing the prior week's 328,000-barrel draw. Gasoline fell 3.2 million barrels, distillates 500,000, and Cushing crude rose 1 million. US production remained high at 13.83 million bpd.
The larger-than-expected build interacting with easing geopolitical tension directly drove further overnight selling. The official EIA weekly report for the same period was scheduled for 10:30 US Eastern time on August 26, or 22:30 Beijing time, after this article's cutoff. Whether official figures confirmed API's surprise build was a key intraday anchor.
Published fundamentals had not structurally reversed. The previous EIA report, for the week ended August 14, showed commercial crude stocks up 4.4 million barrels to 428.8 million, broadly at the five-year seasonal average; SPR stocks fell further to 293.4 million; and distillates drew 1.53 million. The combination of broadly neutral aggregate crude inventories and tight downstream products remained valid.
There was also no new supply-side increment in this window. OPEC+ continued its planned September increase of 188,000 bpd, a sixth consecutive monthly restoration. According to Reuters, this fully unwound the 1.65 million bpd of voluntary cuts announced in April 2023 and originally intended through end-2026. The next ministerial meeting was September 6, with markets broadly expecting further increases to pause from October. Gulf capacity shut by war and shipping paralysis showed no sign of returning. While effective supply remains trapped there, backwardation retains a firm foundation.
Macroeconomics Added No Pressure to Oil
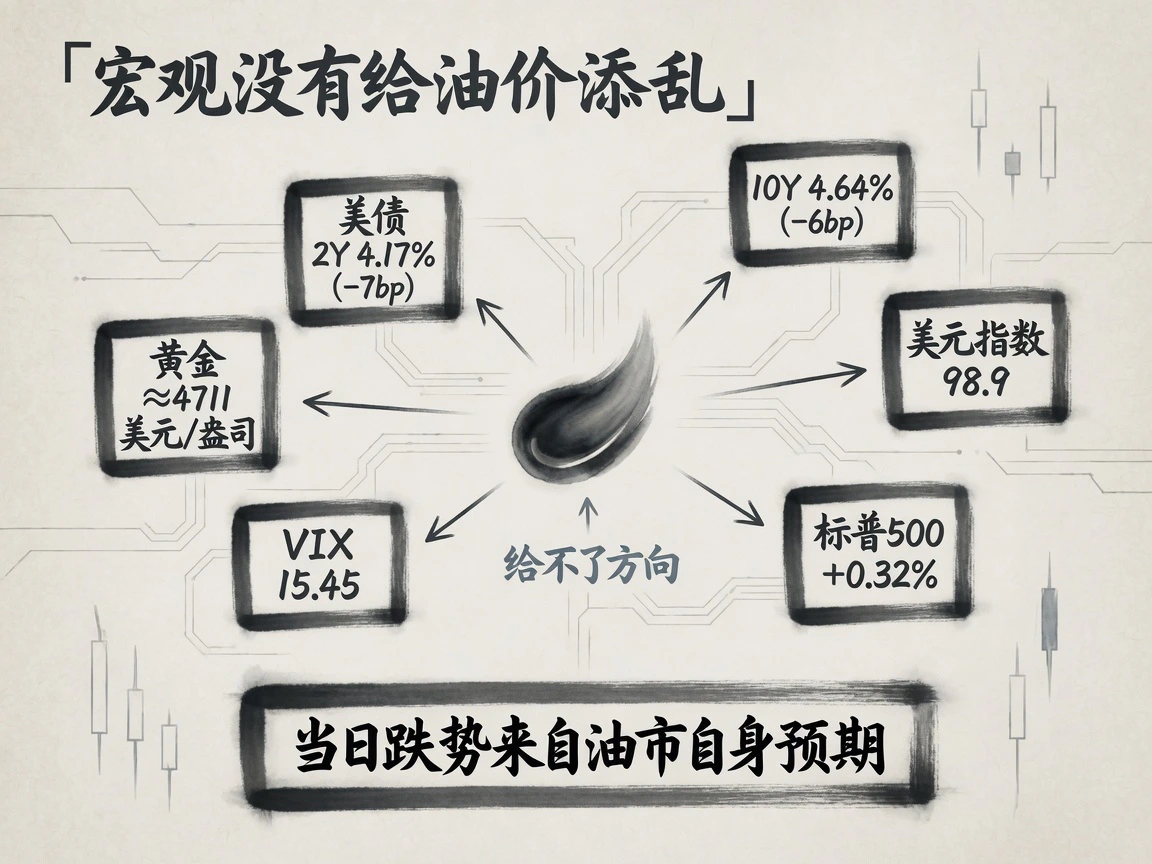
Cross-asset conditions generally favored recovering risk appetite rather than systematic downward pressure on oil. Treasury yields fell sharply: two-year 4.17%, down seven basis points, and 10-year 4.64%, down six. The dollar index edged from 99.0 to 98.9. Equities recovered modestly, with the S&P 500 up 0.32%, and VIX closed at 15.45, relatively low for the year. Safe-haven precious metals also held firm, with spot gold near $4,711 an ounce in the snapshot.
Lower risk-free rates and a softer dollar should have provided liquidity support to dollar-priced commodities, yet oil plunged independently. Yields and FX neither intensified the decline nor arrested it. This shows an oil-specific unwinding of geopolitical narratives and expectations, rather than spillover from tighter macro liquidity or indiscriminate cross-market risk-off selling.
Peace on Paper and the Reality of Logistics

Diplomatic signals bombarded markets over two days. On August 24, Washington expanded sanctions, but traders quickly read this as restraint through financial penalties rather than military conflict. Saxo Bank's head of commodity strategy said the measures were much weaker than the worst case previously priced. On August 25, Iranian and Omani foreign ministers met in Tehran to discuss a temporary joint Hormuz passage and coordinated mine clearance, after which Iran claimed major progress. Pakistan's army chief also arrived to mediate, and foreign media reported preparations for US diplomats to return to Middle Eastern posts. Trump announced that the US Navy had cleared all mines from the strait's international waters and warned Tehran against relaying them.
Actual logistics looked far colder than the diplomatic statements. UKMTO reported that a tanker was hit by an unidentified projectile approximately nine nautical miles northeast of Oman and lost propulsion. Industry tracking showed only two merchant ships crossed on Monday, the lowest daily count since early May. Both were inbound; laden outbound tanker traffic was virtually zero.
Spot freight and war-risk insurance remained pinned high, representing shipping capital's actual cash pricing of physical blockade risk. A VLCC round trip through Hormuz from the Gulf still cost approximately $20 million all-in, around $10 per barrel. EIA says the strait normally carries nearly one-fifth of global seaborne crude. This natural strategic chokepoint cannot be fully bypassed and remained the world's most expensive and dangerous shipping route.
Sanctions also faced substantial enforcement constraints. China, Iran's biggest overseas crude buyer, reiterated that bilateral trade complied with international law and should face no unilateral outside interference. The shadow fleet and gray trading networks cannot be instantly cut off by a few Treasury orders, and trading algorithms rapidly discounted expected physical supply losses from sanctions. Iranian senior officials meanwhile continued promising retaliation.
A Residual Premium of $13–$15 Remains
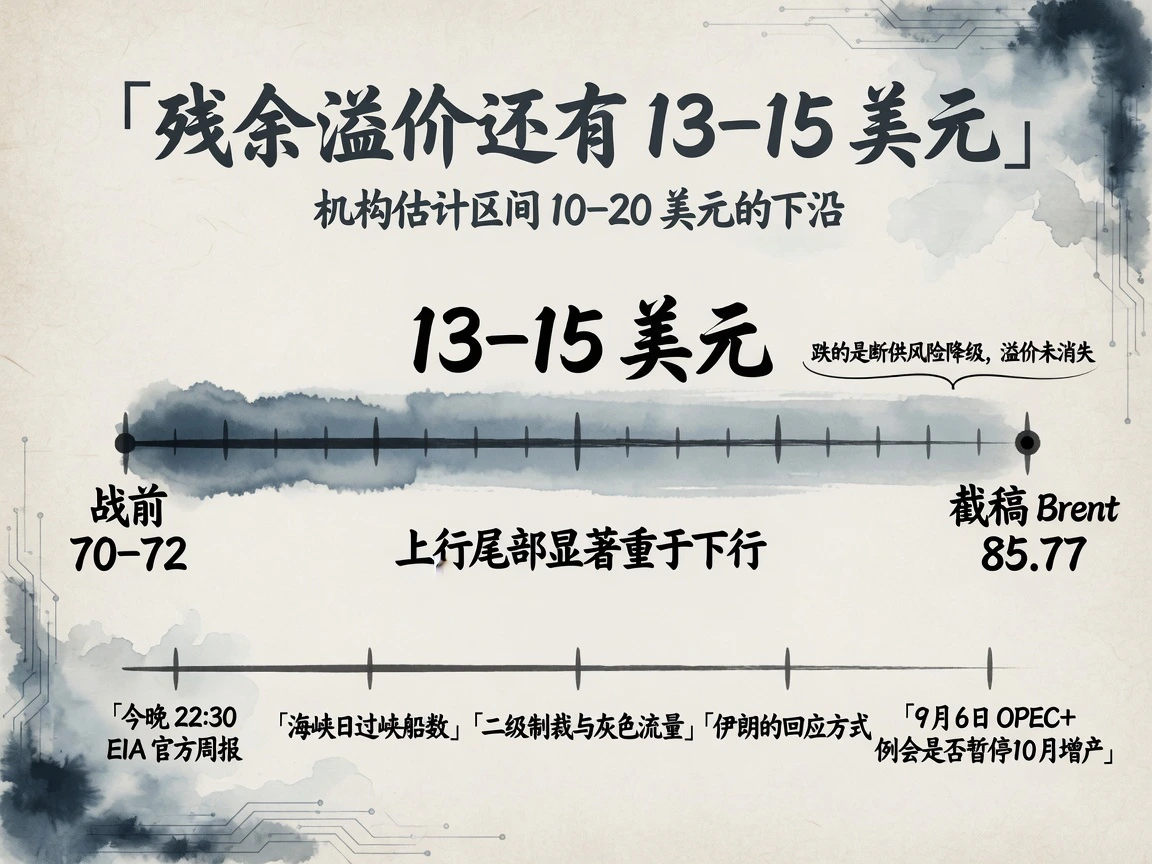
The two-day selloff was essentially financial markets buying a put on a downgrade in disruption risk. As traders forcefully recast confrontation from hot war to economic blockade and diplomacy, and US measures proved weaker than expected at the margin, technical shorts pressed their advantage.
The geopolitical premium was far from exhausted. Brent at the $85.77 snapshot still contained approximately $13–$15 over a prewar risk-free benchmark of $70–$72, only reaching the lower part of the $10–$20 premium range commonly estimated on Wall Street. As long as physical passage remains disrupted, upside tail risk persists. Analysts including KCM stressed Iran's highly asymmetric ability to disrupt the strait and surrounding waters. Ritterbusch & Associates warned that the rapid decline may have outrun the facts: actual Iranian retaliation against Gulf US bases or commercial tankers could cause a violent asymmetric rebound, with a much heavier upside tail than the room for a slow decline. Morgan Stanley had only on August 24 raised its third-quarter Brent target to $90 and fourth-quarter target to $100. The two-day fall tested that view, but its core premise of constrained Gulf physical shipping capacity had not been overturned.
Whether the residual premium is squeezed further or triggers a retaliatory repricing and short squeeze depends on several high-frequency tests. First, can the official EIA report released on the evening of August 26 US Eastern time confirm API's surprise 4.2 million-barrel build? Second, can actual daily Hormuz passages and direction, especially laden outbound tankers, escape their frozen two-to-three-vessel daily state? Third, how forcefully will US secondary sanctions be enforced, and will gray Chinese purchases materially shrink? Fourth, what retaliation will Tehran choose? Finally, will the September 6 OPEC+ meeting pause October increases as expected? Any deviation from the optimistic script could bring an abrupt, sharp mean reversion in this fragile advance peace trade.


