On August 26, oil closed lower for a third consecutive session, but the decline slowed markedly. October WTI settled at $82.23 a barrel, down $0.13, approximately 0.16%; October Brent at $87.84, down $0.74, about 0.84%. Modest settlement changes concealed substantial intraday volatility.
Against August 24 settlements of $85.01 and $92.17, the two benchmarks had fallen about 3.3% and 4.7% over two sessions. This was clearly slower than August 25's one-day losses of 3.1% and 3.9%, and final settlements rebounded substantially from intraday lows.
Diplomatic progress, rather than fresh battlefield conflict, drove the volatility. Iran–Oman discussions of a temporary Hormuz corridor quickly shifted pricing from a military-conflict premium toward a mediation premium. Yet paper agreements had not changed actual freight routes: daily merchant transits remained in single digits and Gulf VLCC freight and war insurance stayed at historical extremes. Talks removed froth in sentiment and expectations, while the physical reality reflected in logistics and insurance costs showed no easing.
Three Lower Settlements, Deep Intraday Lows and a Late Recovery
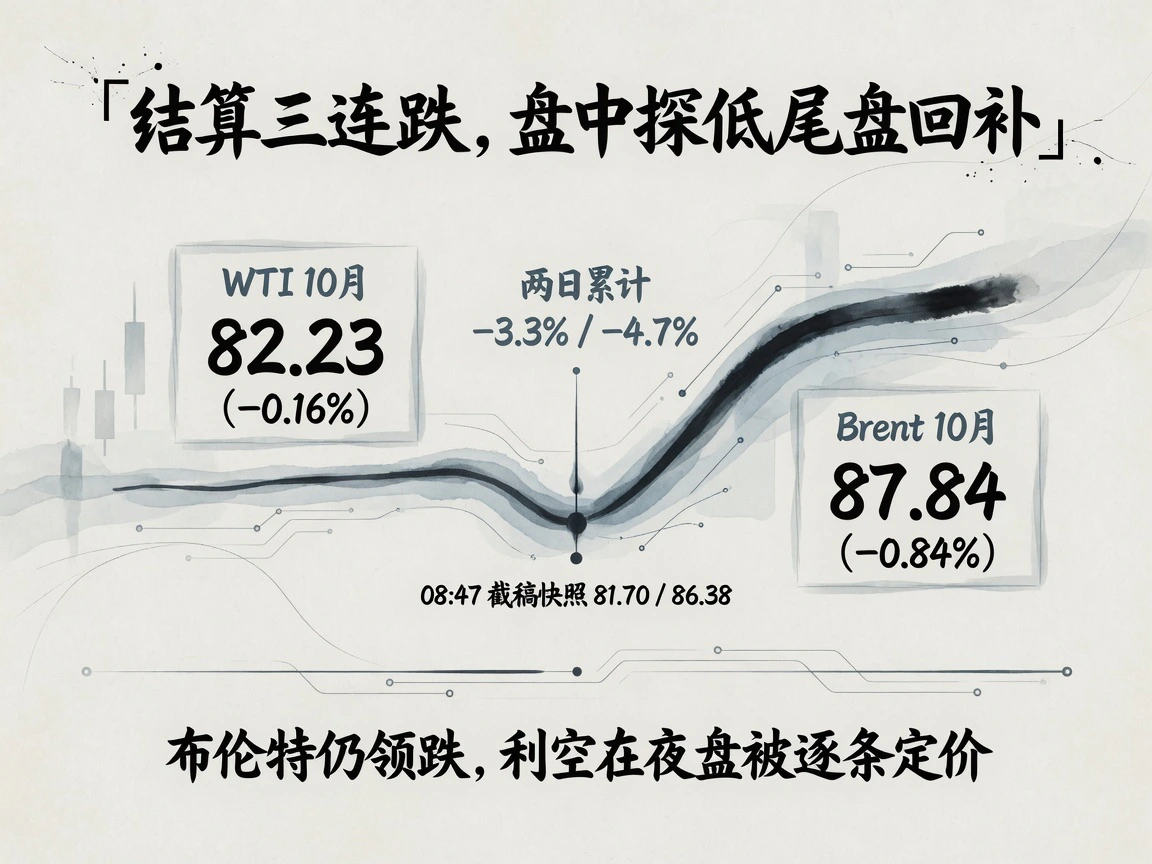
August 26 trading was turbulent. Both benchmarks reached intraday lows not seen since August 10. Brent was down 2%–3% at one point before losses narrowed steadily, leaving only a modest closing decline and evident buying support at low levels.
Asian trading continued digesting diplomacy. Pre-cutoff snapshots at 08:48 and 08:47 Beijing time August 27 showed continuous WTI at $81.70 and Brent $86.38, about $0.5 and $1.5 below prior settlements. These were timestamped electronic live quotes, not official daily settlements. Brent still led declines as overseas trading continued incorporating the incremental bearish effect of talks.
The Whole Forward Curve Shifts Lower, With Brent Falling Further
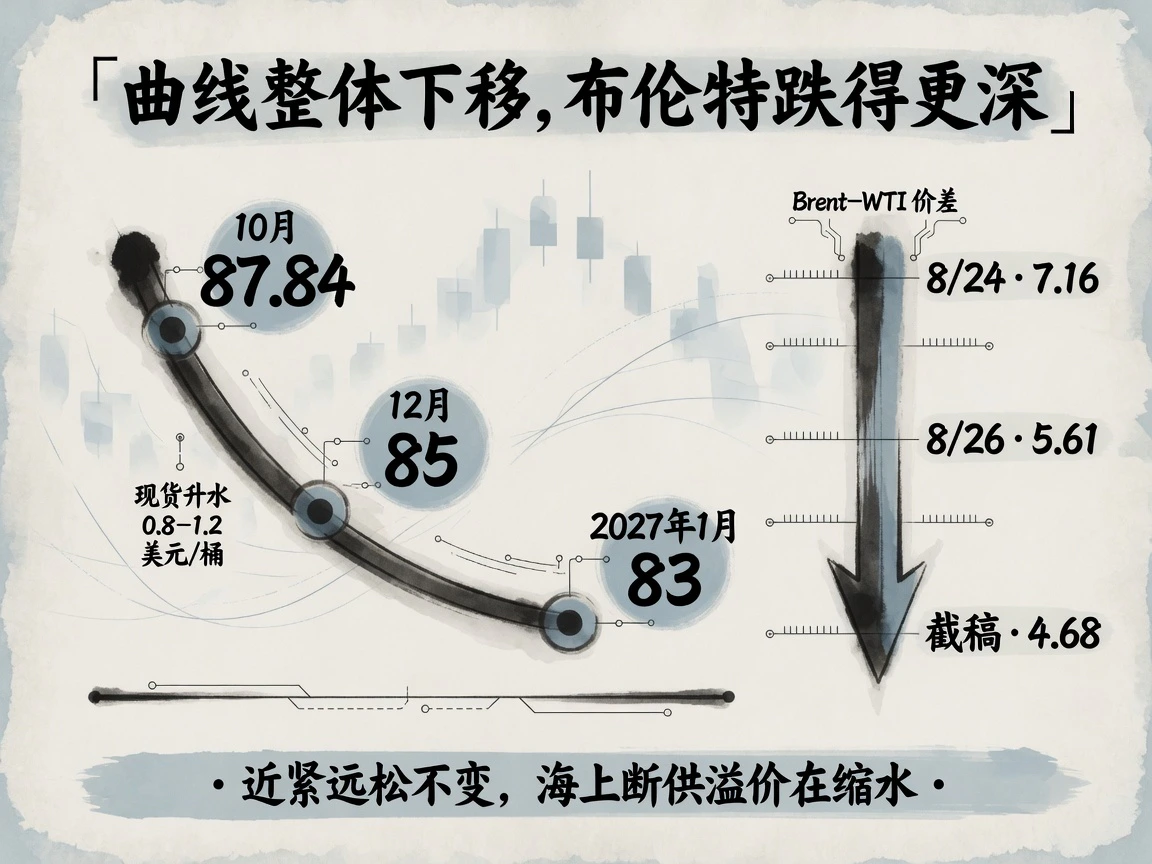
The futures curve remained backwardated but shifted clearly lower. Brent's October–November spread stayed around $0.8–$1.2 a barrel; later contracts declined month by month, with December near $85 and January 2027 around $83 in the snapshot range. Tight prompt supply and looser forward expectations remained intact. The adjustment reset the overall price level on hopes of marginal shipping recovery rather than disproving current shortages.
The decline was asymmetric. Brent–WTI narrowed from $7.16 at the August 24 settlement to $5.61, and about $4.68 by the cutoff. Brent is more sensitive to obstructed Gulf maritime logistics than inland-led WTI and fell harder as expectations eased. Rapid convergence was physical-market pricing squeezing out an excessive maritime-disruption premium.
A Small EIA Build Cannot Displace Geopolitics as the Main Driver
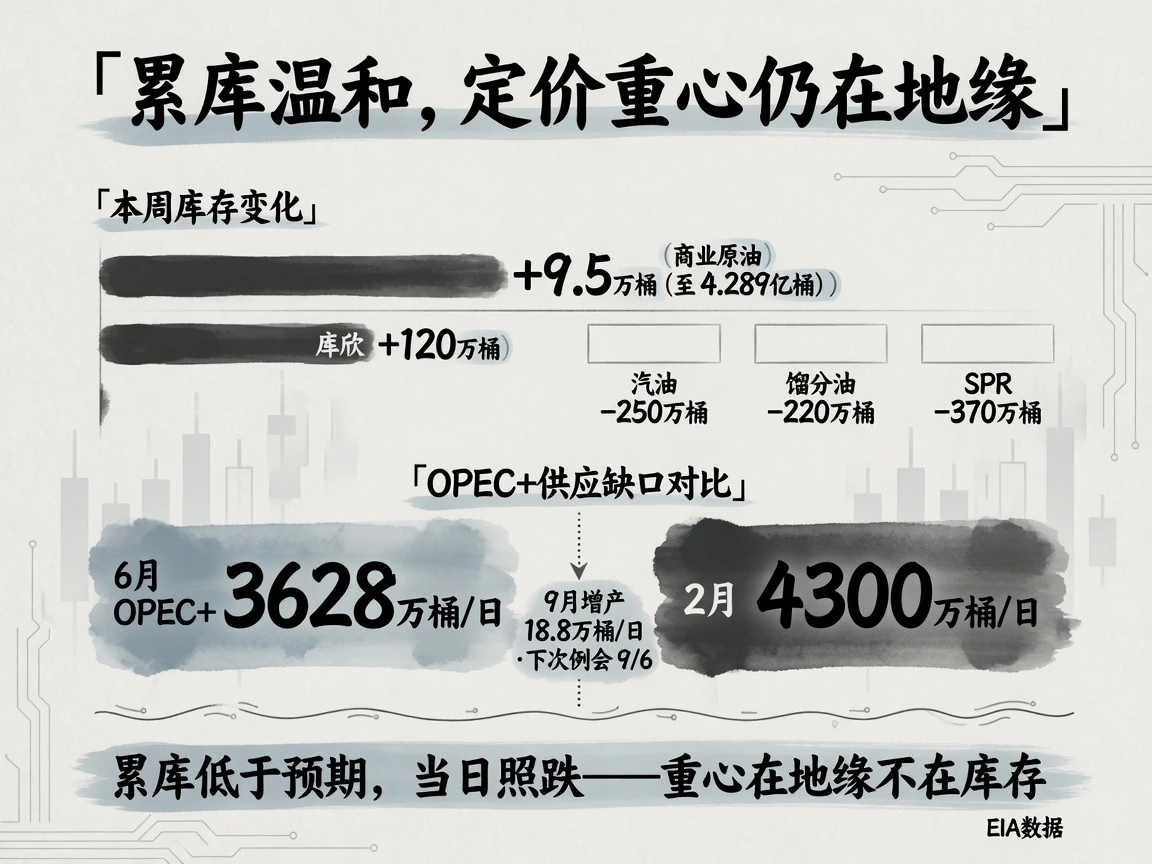
The EIA report released August 26 Eastern time for the week ended August 21 showed commercial crude up only 95,000 barrels to 428.9 million. This fourth consecutive build left stocks about 1% above the five-year seasonal average, but was far below Reuters' expected 600,000-barrel increase. Cushing rose 1.2 million barrels to 22.4 million; the SPR fell 3.7 million to 289.7 million. Gasoline drew 2.5 million and distillates 2.2 million, while domestic crude output stayed near 13.8 million barrels a day.
Normally, a much smaller crude build and faster product drawdowns would support prices. In this geopolitically dominated phase, inventory fundamentals were almost ignored. Weak prices did not invalidate the underlying pattern of a broadly stable crude balance and marginally tight products.
There were no additional supply changes in this window. OPEC+'s 188,000-barrel-a-day September increase was agreed August 2, its sixth consecutive monthly increase and the full release of the original voluntary cut of 1.65 million barrels a day. Markets generally expected increases to pause from October; the next ministerial meeting was September 6. Effective capacity remained the binding issue. Industry estimates put June OPEC+ output at 36.28 million barrels a day against nearly 43 million in February before the conflict. Large Gulf capacity still could not reach international markets smoothly, and that unfilled physical gap sustained high prompt premiums.
A Mild Macro Backdrop Cannot Explain the Oil Slump
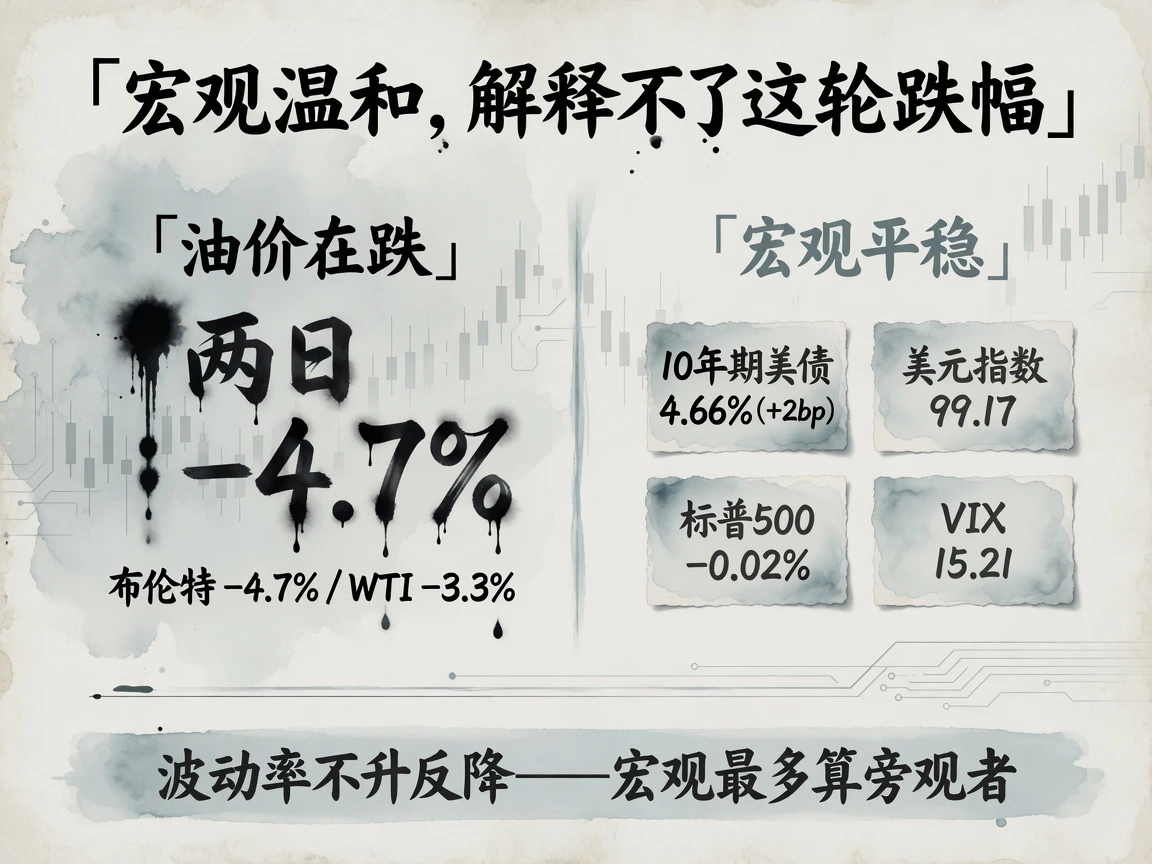
Across assets, Treasury yields rose mildly: 10-year 4.66%, 2-year 4.19%, both up 2.0 basis points. The dollar index was 99.17, up 0.25%; S&P 500 nearly flat at -0.02%; VIX fell further to 15.21. Spot London gold held near $4,662 an ounce during the snapshot window without profit-taking pressure.
Slightly stronger rates and the dollar created marginal commodity headwinds, but could not match Brent's two-day 4.7% loss. Major risk assets were broadly flat and volatility fell rather than rose, showing the decline was oil-specific geopolitical-premium removal rather than systemic macro risk-off. Macro liquidity and cross-market sentiment were, at most, bystanders.
Negotiations Advance Without Easing Logistics Bottlenecks
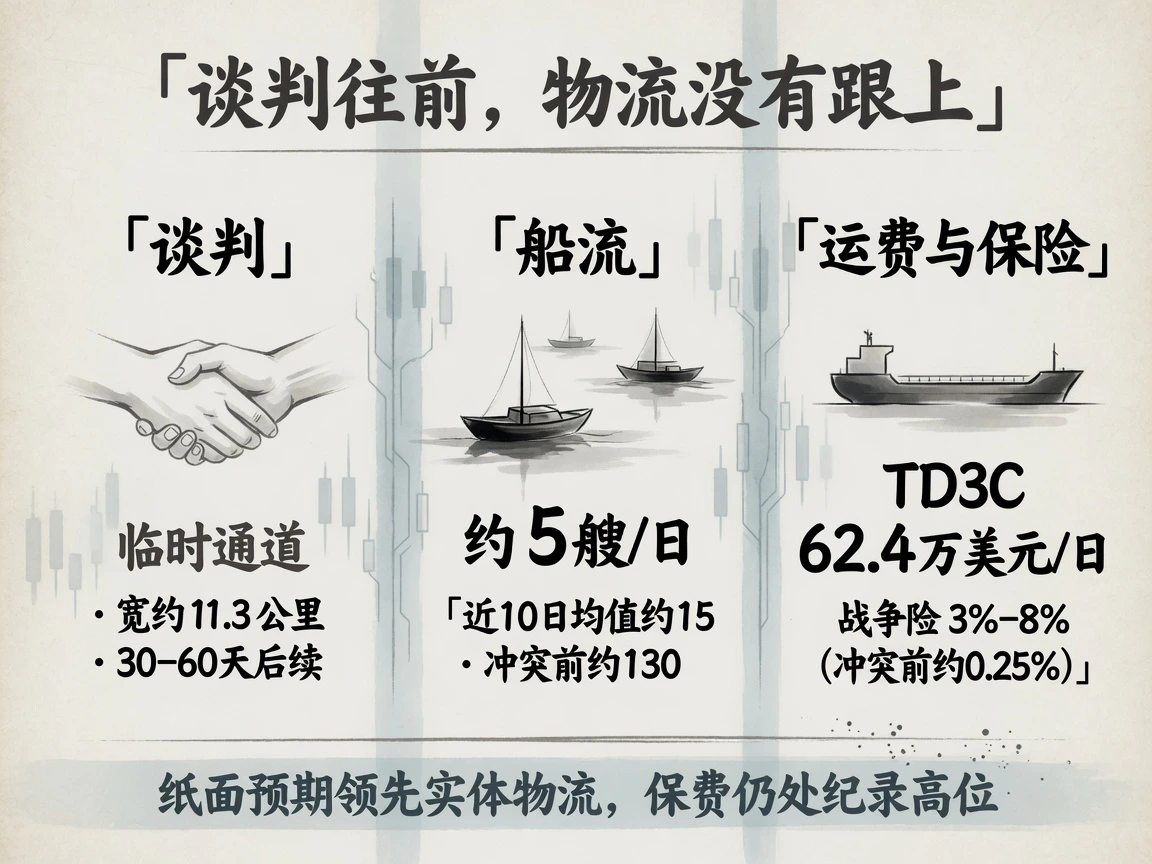
With no substantive new battlefield developments, a diplomatic statement moved prices. Iran's and Oman's foreign ministers met in Tehran August 25 and issued a phased-framework statement focused on a temporary shipping corridor and joint mine clearance. Iran's deputy foreign minister later described preliminary agreement: inbound vessels would use Iranian waters and outbound vessels mixed Iranian–Omani waters, in a corridor about 11.3 kilometers wide. Permanent arrangements would be discussed over the next 30–60 days.
Differences remained sharp. Iran said this was not a full reopening and implementation required complete US removal of the blockade and relevant sanctions; Washington had not formally responded. The Revolutionary Guards claimed agreement on channel control and transit-revenue allocation, but senior Iranian sources immediately denied any final deal. Opposing accounts of the same negotiation directly triggered 2%–3% intraday swings.
US sanctions did not directly close the negotiating window. On August 24, Treasury launched Operation Economic Outcast, listing around 60 Iran-linked entities and vessels across shipping intermediaries, the shadow fleet and Iranian crude logistics to China, including QUANTUM HOPE and VOYAGE ELITE. It introduced secondary-sanctions determinations for shipping services without directly targeting Chinese buyers. Traders generally read this as restraint: economic and financial constraints rather than military escalation.
Actual shipping remained deeply frozen. Only about 5 merchant ships crossed on August 25, versus roughly 15 daily over the latest 10 days and about 130 before the war. In ordinary years, Hormuz handles nearly one-fifth of global seaborne crude trade on the EIA definition. With no way around the chokepoint, commercial freight could only wait.
Freight and war insurance were severe. On August 24, Gulf–China TD3C VLCC time-charter-equivalent earnings hit a record $624,000 a day, with Baltic Worldscale at 606; some reported voyage fixtures approached $800,000 daily. War insurance across vessel classes rose to 3%–8% of asset value versus about 0.25% prewar, costing millions or even more than ten million dollars for one transit. These prices showed shipping and insurance capital committing real money was not betting risk had passed.
Markets Price Optimism, but a Geopolitical Premium Still Supports Oil
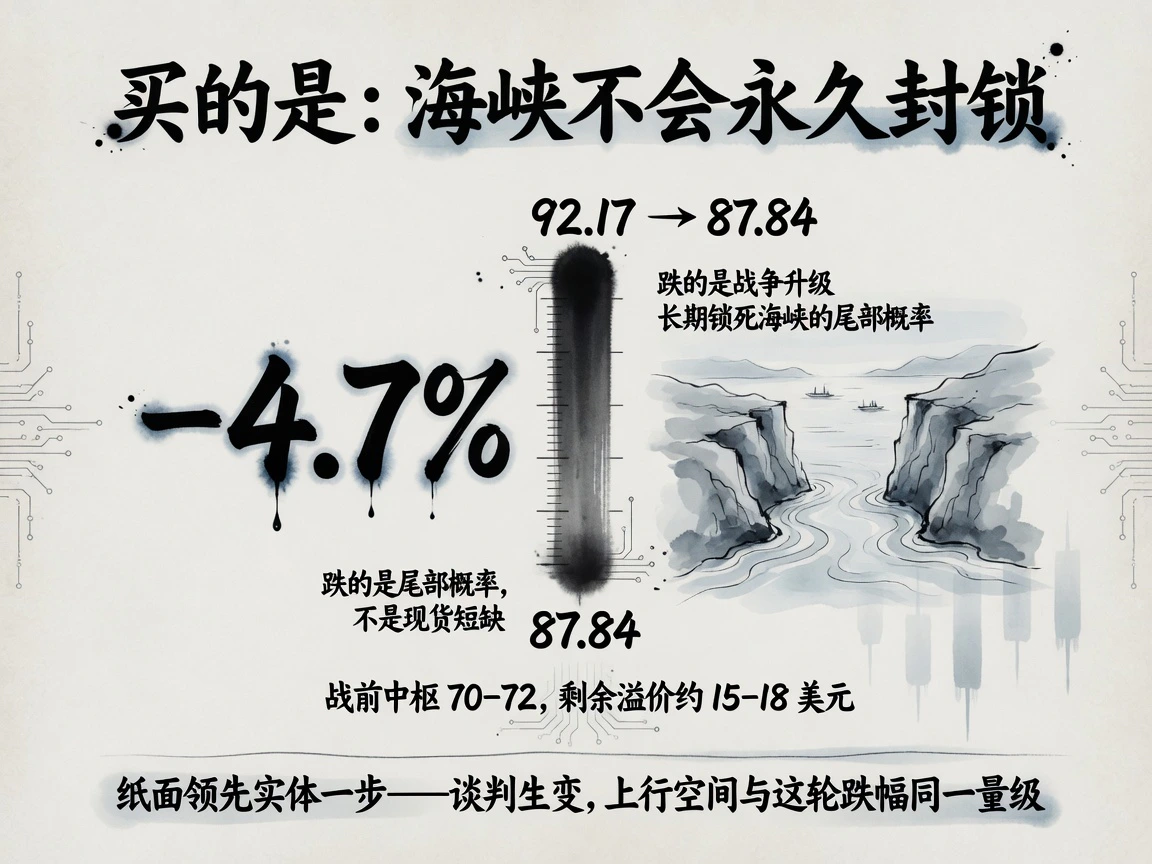
Trading was shifting from prolonged complete maritime closure toward a possible limited reopening, making ceasefire and negotiation signals highly sensitive. In one session Brent could fall near $85.85 and rebound to close at $87.84. The roughly 4.7% correction from August 24's $92.17 peak removed the extreme tail probability of full military escalation permanently closing the chokepoint, rather than fundamentally reversing physical shortage.
The geopolitical premium remained substantial. Comparing Brent's $87.84 settlement with the prewar $70–$72 range, using the August 25 article's baseline, leaves approximately $15–$18 a barrel in risk premium.
When paper expectations lead logistics, declines and rebounds can be equally violent. Stalled mediation or strict US secondary-sanctions enforcement could produce upside comparable in scale to this selloff. Key operational questions remain: a timetable for joint mine clearance and actual corridor passage; whether daily transits can escape single digits; and whether the first secondary-sanctions cases materially block shadow-fleet transfers. Until these are clear, prices are merely running ahead on the most optimistic script.


