On Monday, August 31, oil opened September trading with a nearly 3% jump. Front-month October WTI settled at $85.76 a barrel, up $2.36 (+2.83%) from August 28. November Brent settled at $90.49, up $2.39 (+2.71%), after touching $91.52 intraday.
The catalyst was entirely geopolitical, without additional fundamental support. Direct U.S.–Iran confrontation resumed after nearly a month, quickly restoring a prompt premium for Hormuz disruption. Fundamental resistance remained substantial: Gulf crude continued struggling through alternative routes and Chinese demand was weak. Brent exceeded $90 and WTI approached $86, but neither broke its recent range. More important than the gain was the unchanged mismatch: physical crude remained ample while shipping capacity and downstream products were genuinely tight.
Monday settlement: both benchmarks rebound nearly 3%
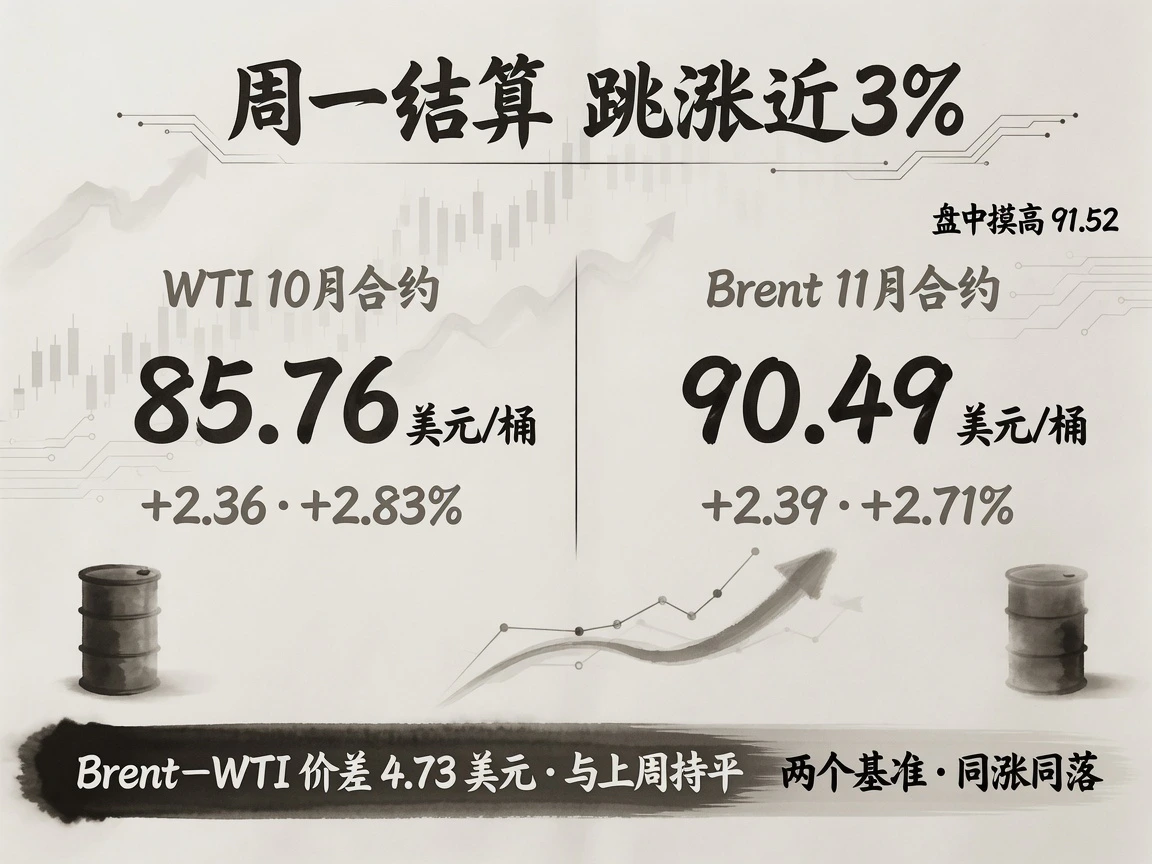
Contract-roll note: October Brent expired August 28 at $89.31; November became the nearby benchmark from August 31. Comparing the same contract, November rose from $88.10 to $90.49, a $2.39 gain consistent with WTI's settlement increase.
Almost all Monday's gain came from a geopolitical risk gap. Asian early trading first priced renewed fighting; approximately another $0.2 was added before settlement during U.S. trading. Brent–WTI was around $4.73 a barrel, essentially unchanged from Friday's $4.7. The benchmarks moved together without further widening the seaborne premium.
WTI's $85.76 close remained below August 21's $87.06 settlement, and Brent had not regained $94.39 from that date. Only a small part of the previous week's 4%–5% losses was recovered, and both monthly performances remained slightly negative. The curve retained steep backwardation, most pronounced around the Brent front-month roll.
Electronic snapshot at 08:10 Beijing time on September 1: WTI was $86.62, about $0.9 above Monday's settlement. Brent's $88.84 reference was well below the $90.49 settlement and was inferred to reflect a delayed data update, so it was not treated as a valid overnight trend reference.
Supply, demand and inventories: Chinese PMI stabilizes while U.S. crude builds and products tighten
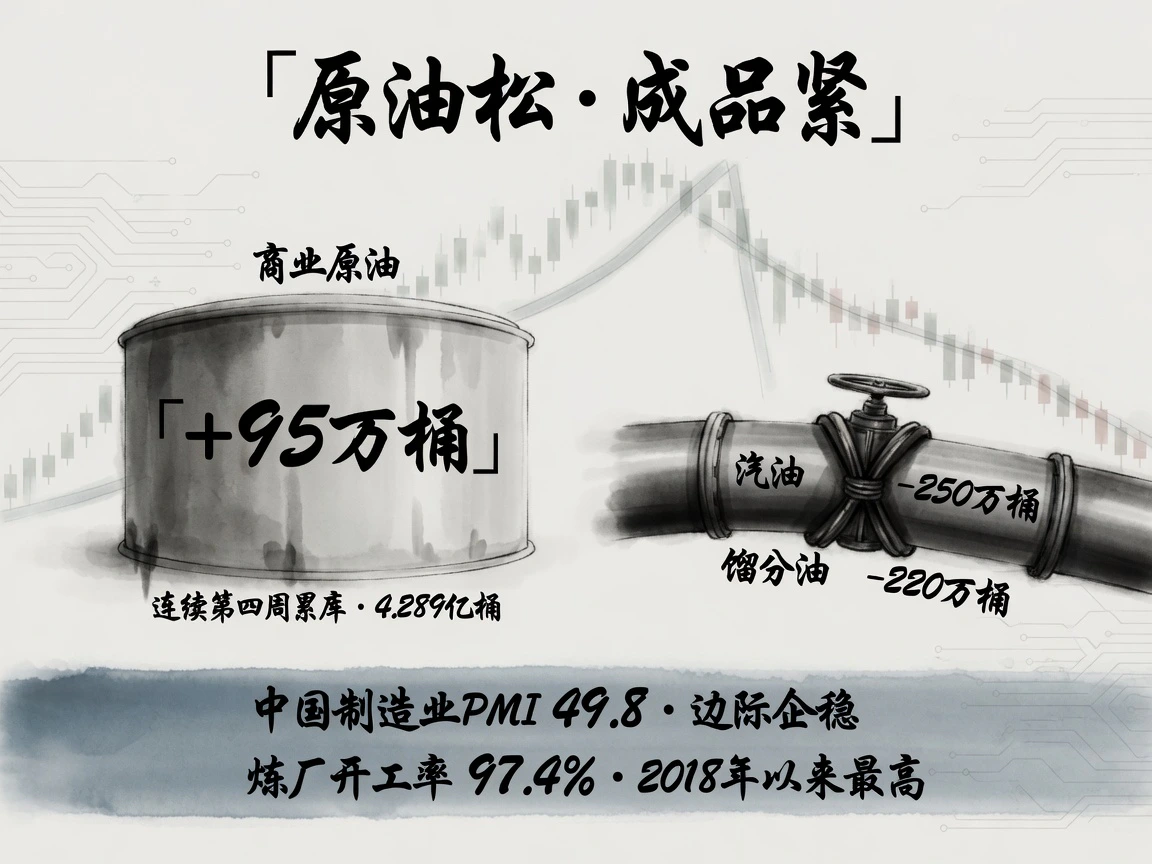
No new official U.S. inventories appeared in the latest window. The August 26 EIA report for the week ending August 21 retained the crude-build/product-tightness split: commercial crude rose 950,000 barrels to 428.9 million, a fourth consecutive build; Cushing rose 1.2 million; SPR releases were 3.7 million, reducing reserves to 289.7 million. Gasoline fell 2.5 million and distillates 2.2 million. Refinery utilization reached 97.4%, the highest since 2018. The next report was due September 2.
China supplied the demand clue. Official August manufacturing PMI, released August 31, was 49.8 versus July's 49.2. It remained below the expansion threshold for a second month but beat expectations. Production and new orders returned to expansion, and major raw-material purchase prices rose to 56.6. Demand was stabilizing at the margin without sufficient incremental momentum for a one-way rally, limiting Monday's upside.
Iranian crude supplied no new marginal development that week. August Kharg Island loadings were approximately 135,000–251,000 barrels a day versus 1.5 million to 1.8 million before war, mainly bound for China. The collapse reflected blocked export routes rather than terminal damage. Gulf of Mexico disturbance Invest 97L primarily brought rain without materially affecting offshore platforms and was not priced into the market.
Macro effects recede: dollar strength and high rates fail to suppress the geopolitical premium
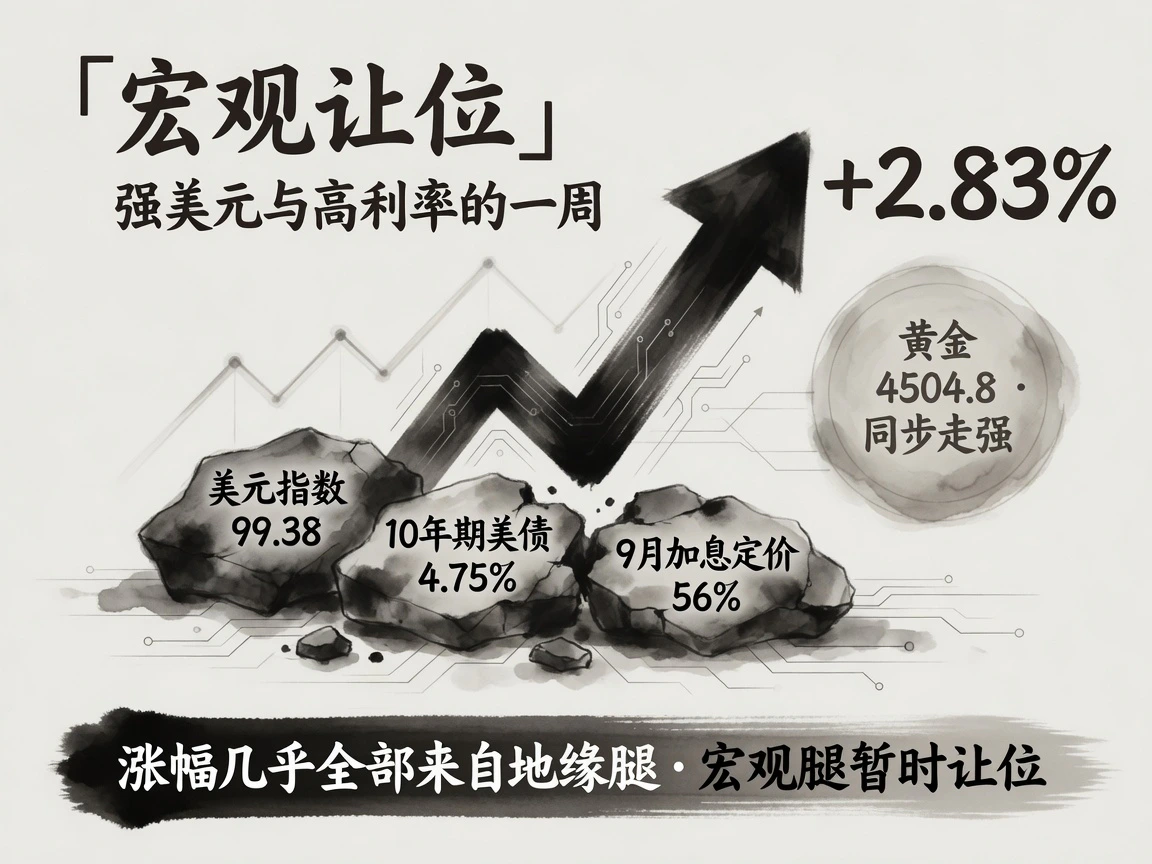
Geopolitics dominated Monday and temporarily overwhelmed macro restraint. The dollar index remained high near 99.38 versus Friday's roughly 99.7. Treasury yields moved narrowly: the 2-year was unchanged at 4.34%, the 10-year rose 2 basis points to 4.75%, and the 30-year 3 to 5.25% on the stated closing basis. Post-Jackson Hole September hike odds stayed near 56%, without easing.
A strong dollar and high rates usually constrain commodities, but August 31 gains came entirely from the geopolitical shock. Gold rose too, from an August 28 settlement of $4,478 to a latest snapshot of $4,504.8. The unusual joint advance of a haven and an industrial commodity showed Hormuz interruption being traded as an independent supply shock, with macro-financial effects secondary.
Geopolitics: U.S. strikes Larak Island while daily Hormuz transits remain in single digits
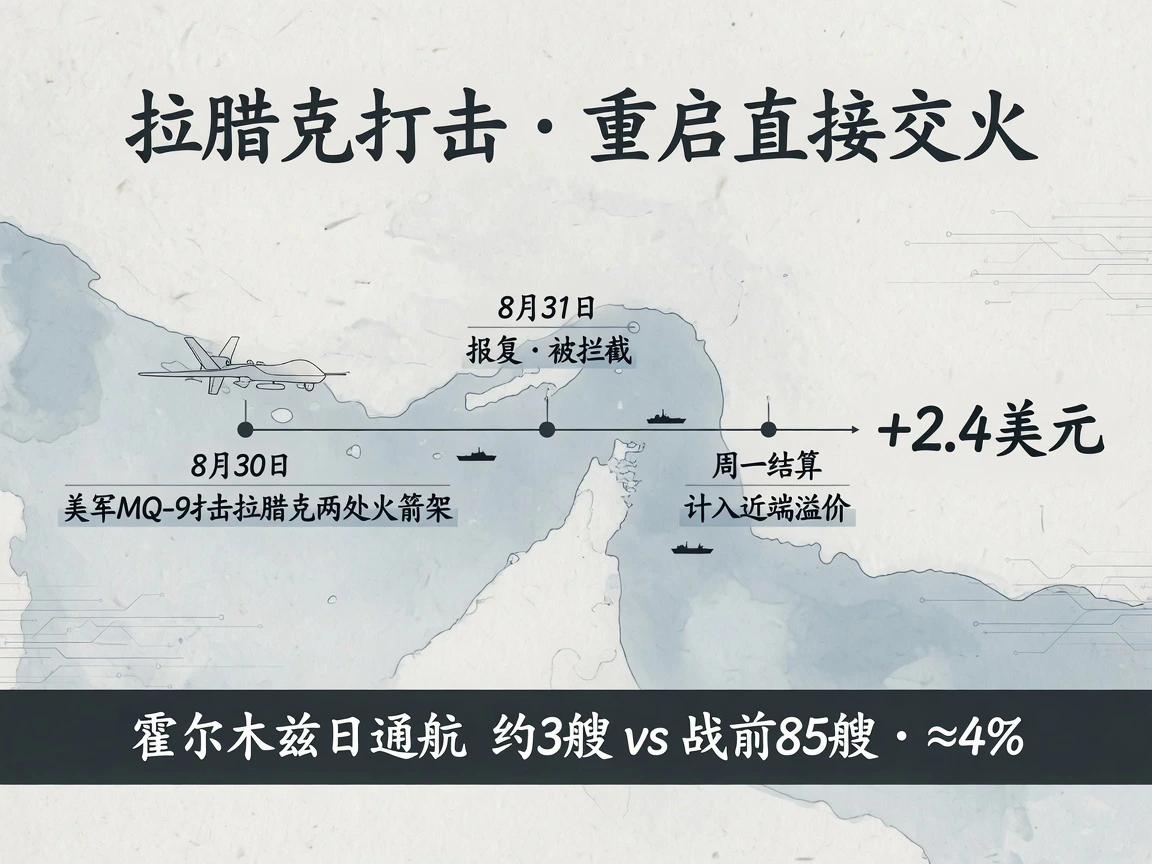
On Sunday, August 30, U.S. MQ-9 drones struck two rocket launchers on Larak Island, which Washington said were preparing nearby minelaying. It was the first direct U.S. strike on Iranian territory since late July. Iran retaliated with missiles and drones at two U.S. bases in Jordan, reportedly intercepted without major casualties. Monday, the first trading day afterward, rapidly priced renewed direct conflict into prompt risk premiums, contributing approximately $2.4 to the gain.
Public alarm and battlefield reality differed. Trump posted AI-generated imagery claiming Kharg's export terminal had been shattered. NIOC denied it, U.S. officials said Kharg was not targeted, and August 30 commercial satellite images showed no fire or smoke. Intact terminals with constrained shipments confirmed that actual supply-chain losses remained blockade-driven. Monday priced a tail risk of full-scale war in Hormuz, rather than new physical damage.
Logistics tracking confirmed the blockade's severity. IMF PortWatch data through August 23 showed approximately three merchant transits daily, about 4% of the prewar norm of 85. Between 360 and 500 ships remained stranded or waiting. AIS-dark operations and ship-to-ship transfers inside and outside the Gulf remained central to exports, while Petroline and ADCOP operated at full capacity. No new merchant-attack report appeared during the period.
Shipping and products: high freight and war insurance as Russian diesel remains constrained
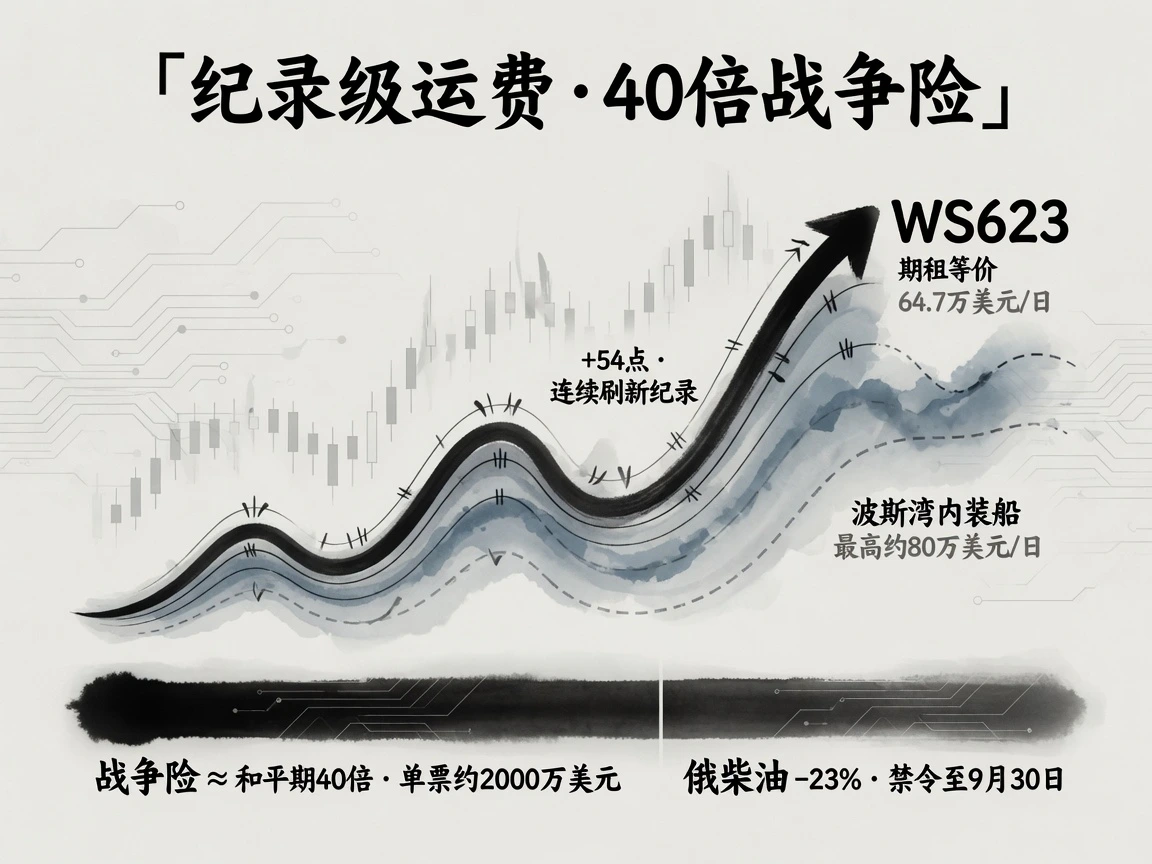
Scarcity premiums were more extreme in product cracks and tanker capacity than nearby crude. The Baltic Exchange's August 31 weekly report put Persian Gulf–China TD3C VLCC freight at WS623 and a $647,000 daily TCE, up another 54 points from Friday and setting new records. This surpassed the August 24–25 WS606 record, about $624,000 a day. Prompt Gulf loadings were even offered at up to $800,000 a day early in the week. Oman–China TD34 was about $219,000 a day and West Africa–China TD15 about $180,000.
War-risk insurance rose to around forty times normal levels. TotalEnergies' CEO said all-in ancillary costs for one tanker passing Hormuz had reached approximately $20 million.
Russian product restrictions tightened. The diesel-export ban extended to September 30; gasoline and nonproducer diesel restrictions to end-January 2027, and jet fuel to end-November. August refinery runs fell to approximately 3.8 million barrels a day, a more-than-twenty-year low. At least 21 drone strikes occurred that month, and diesel output fell about 23% year on year. Product scarcity premiums stayed high: U.S. Gulf ULSD cracks held above $90 a barrel after briefly exceeding $100 intraday in mid-August; Northwest European diesel cracks were about $78 and Singapore about $72.
Core pricing logic and the next monitoring windows
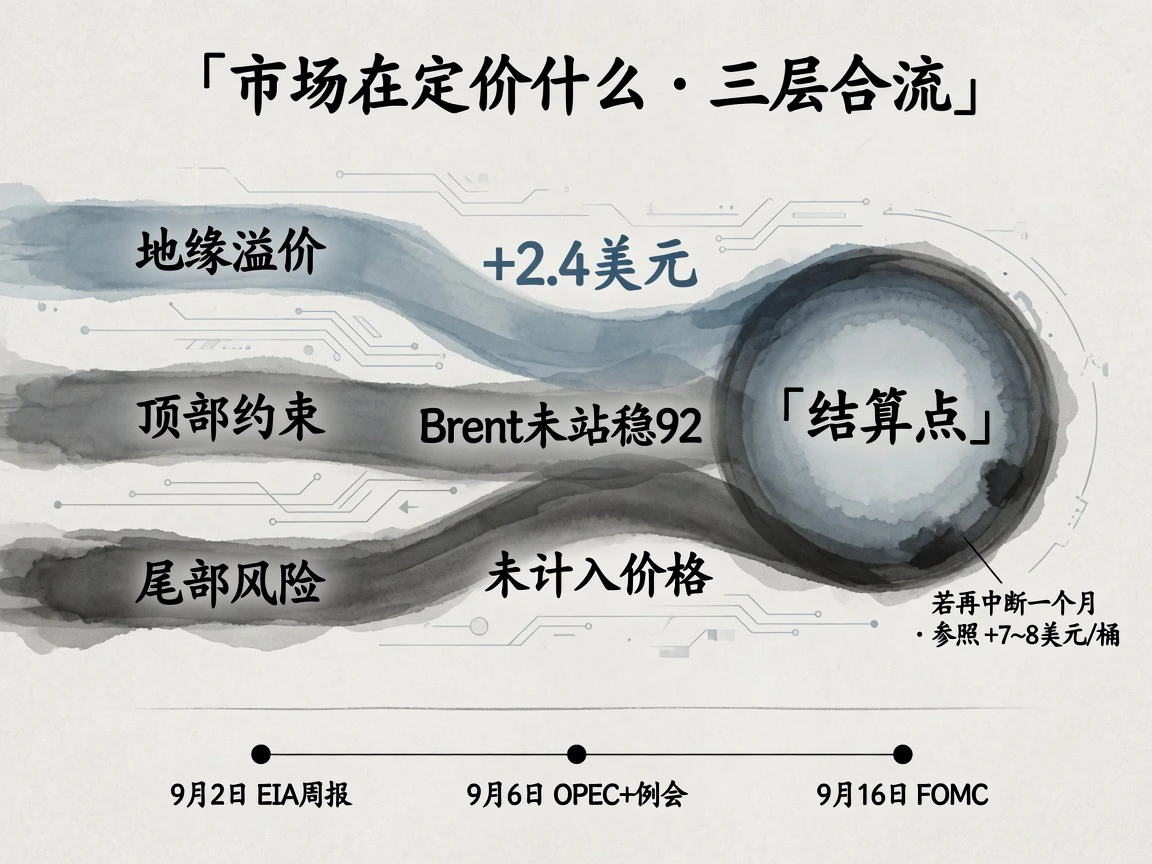
Monday's settlements lay at the intersection of three forces:
First, a renewed prompt geopolitical premium. Direct fighting drove nearby contracts up about $2.4, considerably more than deferred contracts.
Second, fundamental resistance. Gulf exports had not stopped completely, Chinese manufacturing PMI remained below expansion, and dollar and Treasury yields stayed high. Brent failed to hold $92 and WTI stalled below $87, recovering only to the middle of the previous week's sharp decline.
Third, extreme disruption was not fully priced. Kharg facilities were intact and overland pipelines operating. Pricing still assumed gradual shortages from intermittent attacks and sustained blockade rather than complete closure. JPMorgan estimated another month of interrupted passage would imply about $7–$8 a barrel in additional premium.
The structural mismatch of ample physical crude with tight tankers and products persisted into September. Key windows were the September 2 EIA report—whether crude builds for a fifth week and very high refinery utilization persists—the September 6 OPEC+ ministerial meeting on pausing October increases, the next 24–72 hours of U.S.–Iran confrontation after Larak, and macro repricing around September 4 payrolls and the September 16 FOMC.


