On September 1, 2026, global macro markets confronted four intertwined signals: softer economic momentum, sticky prices, firm Fed rhetoric and another step higher in oil. Interest-rate derivatives put September Fed hike odds near two-thirds, around 66%–69%, while Treasury yields rose across the curve for a fifth consecutive session.
The central change was inflation compensation taking over. The 10-year breakeven rose 4 basis points in a day, replacing real yields as the main driver of higher nominal rates: the oil shock had materially entered medium- and long-term inflation expectations. Across assets, the pattern was mild bear flattening with weakened haven performance. On the day fighting escalated, gold instead fell around 2% below $4,500. Repricing of risk-free and real rates driven by additional tightening had overwhelmed traditional geopolitical haven demand.
Bonds: Fifth day of selling as inflation compensation takes over
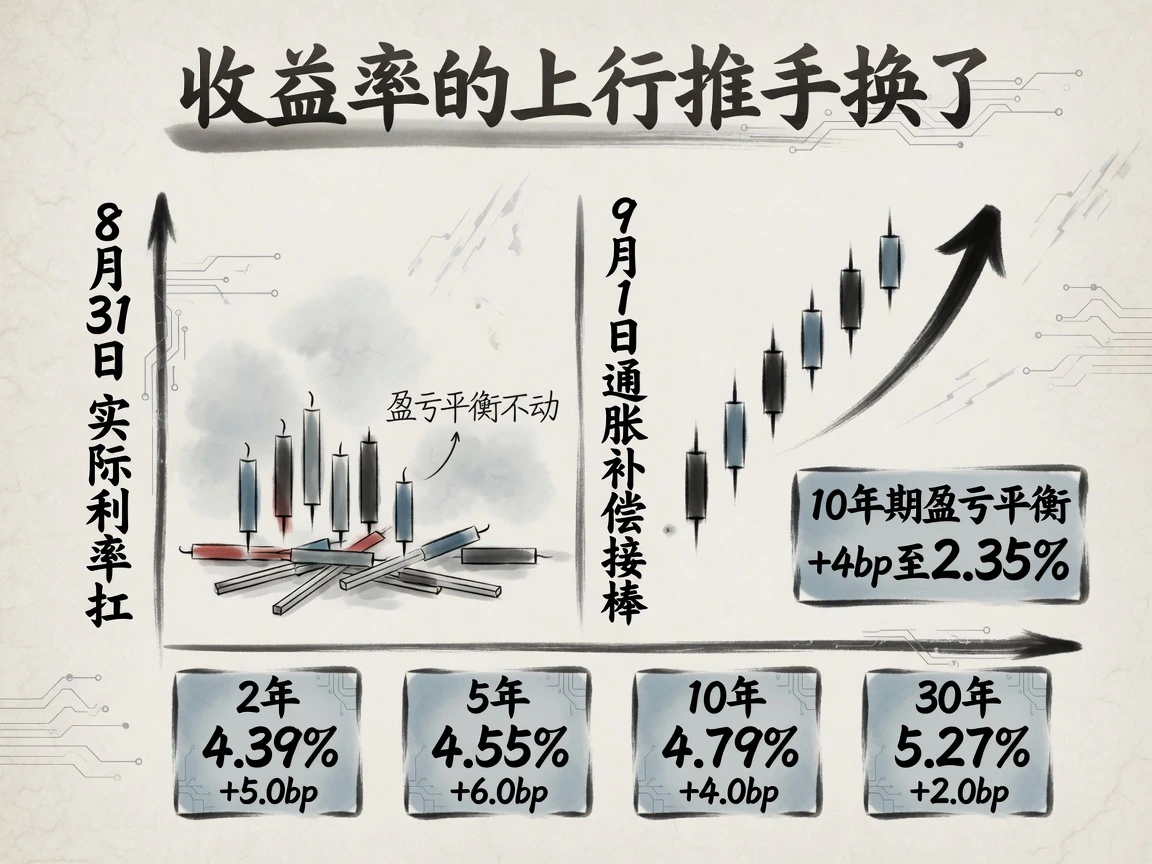
Treasuries remained under pressure for a fifth session, with modest bear flattening and the greatest selling in 5-year maturities. US Treasury end-of-day par yields changed as follows on September 1 versus August 31:
| Maturity | September 1 close | Daily change |
|---|---|---|
| 2-year | 4.39% | +5.0 bp |
| 5-year | 4.55% | +6.0 bp |
| 10-year | 4.79% | +4.0 bp |
| 30-year | 5.27% | +2.0 bp |
The 2-year/10-year spread narrowed 1 bp to 40 bp. The 10-year briefly reached 4.798%, its highest intraday level since January 14, 2025. Renewed inflation premiums drove the curve: 10-year breakevens jumped 4 bp to 2.35%, while implied real yields from TIPS were essentially unchanged near 2.44%. Inflation compensation accounted for almost all the nominal increase, the opposite of August 31, when real rates rose and inflation expectations were flat.
If Middle Eastern conflict followed the earlier pattern of escalation followed by retracement, the 4 bp breakeven increase could unwind easily. The 5 bp rise in the 2-year reflected policy-rate repricing and was considerably stickier. If WTI held firmly above $90, long nominal yields would instead face pressure from both higher inflation compensation and a rebuilt term premium.
Duration repricing spread globally. Japan's 10-year yield touched 3.0% intraday for the first time since September 1996, while rates markets nearly fully priced a 25 bp BOJ hike on September 17–18. Germany's 10-year reached 3.35%, its highest since 2011, and the UK's moved above 5.25%, the highest since 2008. Flash August euro-area CPI reached 3%. Synchronized overseas inflation was accelerating transmission inward through expectations.
Treasury primary-market demand remained solid. Tuesday's $85 billion 42-day cash-management bill attracted 2.85 times coverage, while the $52 billion 52-week bill received 3.61 times coverage, with foreign central banks and official institutions leading demand. On Wednesday Treasury would announce 3-year, 10-year and 30-year auction sizes of $58 billion, $39 billion and $22 billion, following August quarterly-refunding conventions. Their timing overlapped the Fed's first operation of expanded long-end repos scheduled September 9–10. Supply pressure and official support together suggested elevated, volatile 30-year yields around auction week.
Liquidity and credit showed no funding strain. The effective federal funds rate (EFFR) held at 3.63%, near the lower end of the policy range, indicating abundant short liquidity. The 2-year yield rise was entirely driven by hike expectations rather than tighter financing. Dollar credit spreads remained at historically extreme lows: US investment grade 0.80%, high yield 2.63%. Asian dollar bonds remained scarce in secondary trading, with issues clearing rapidly at very tight spreads. Offshore, overnight HIBOR fixed at 3.2825%, around 82 bp below month-end, while USD/HKD traded near 7.84, close to the weak-side guarantee.
At the September 2 08:10 Beijing-time snapshot, yields were 4.402% for 2 years, 4.561% for 5 years, 4.804% for 10 years and 5.279% for 30 years, roughly another 1 bp above official settlements. The 10-year remained precariously balanced around the key 4.80% threshold.
Macro and policy: Softer activity, stickier prices
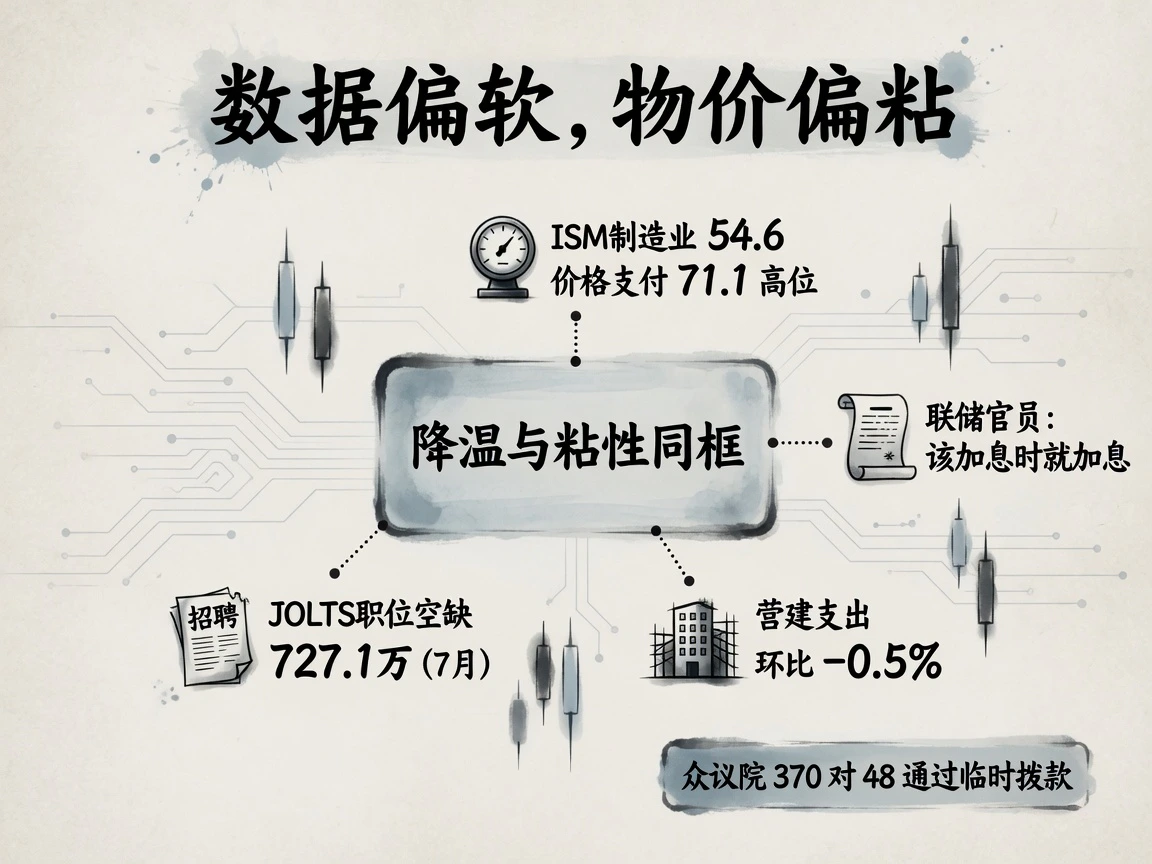
The day's releases painted a consistent picture: real activity was cooling at the margin, while prices showed no relief.
August ISM manufacturing PMI was 54.6, below expectations of 55.2 but in expansion for an eighth consecutive month. New orders at 53.7, backlogs at 51.8 and employment at 51.2 all softened at the margin. Prices paid nevertheless remained high at 71.1, with respondents citing supply-chain bottlenecks, longer transport lead times, Middle Eastern disruption and tariffs. The prior collapse in Chicago PMI contrasted with a strong Dallas Fed rebound; the nationwide ISM established the broader picture: output remained resilient, but slowing final demand had not materially eased costs. The elevated price component reflected persistent inflation rather than a gradual retreat.
Labor and investment data confirmed the pattern. July JOLTS openings were 7.271 million, slightly below expectations; the vacancy rate remained 4.4% and layoffs at a historically very low 1.0%. Labor demand was cooling but resilient, without evidence of a demand collapse sufficient to lower inflation on its own. A high vacancy rate suggested continuing risk of renewed wage-price spillovers. Construction spending fell 0.5% month on month, showing continued high-rate pressure on interest-sensitive sectors.
Fed Governor Michael Barr delivered the day's clearest hawkish statement: without convincing evidence of easing inflation, the Fed should act decisively to raise rates. This continued Chair Kevin Warsh's Jackson Hole tone. Policymakers' hawkish narrative was becoming more systematic, narrowing the range of foreseeable policy paths while focusing uncertainty on the next eight days' data. Under intense data dependence, each release acquired greater importance, raising short-term two-way cross-asset volatility; VIX jumped 9.52%.
Multilateral and fiscal developments also advanced. First, the House passed a continuing resolution through December 11 by 370–48, securing federal funding and removing the September 30 fiscal-year shutdown threat. Second, the G20 finance ministers and central-bank governors issued a chair's statement rather than a unanimous communique. Most members supported free, safe and predictable Hormuz navigation and avoiding unnecessary restrictions on critical energy exports. Middle Eastern shipping and supply-chain risks formally entered collective global financial-policy oversight.
Commodities: Oil rises as gold falls
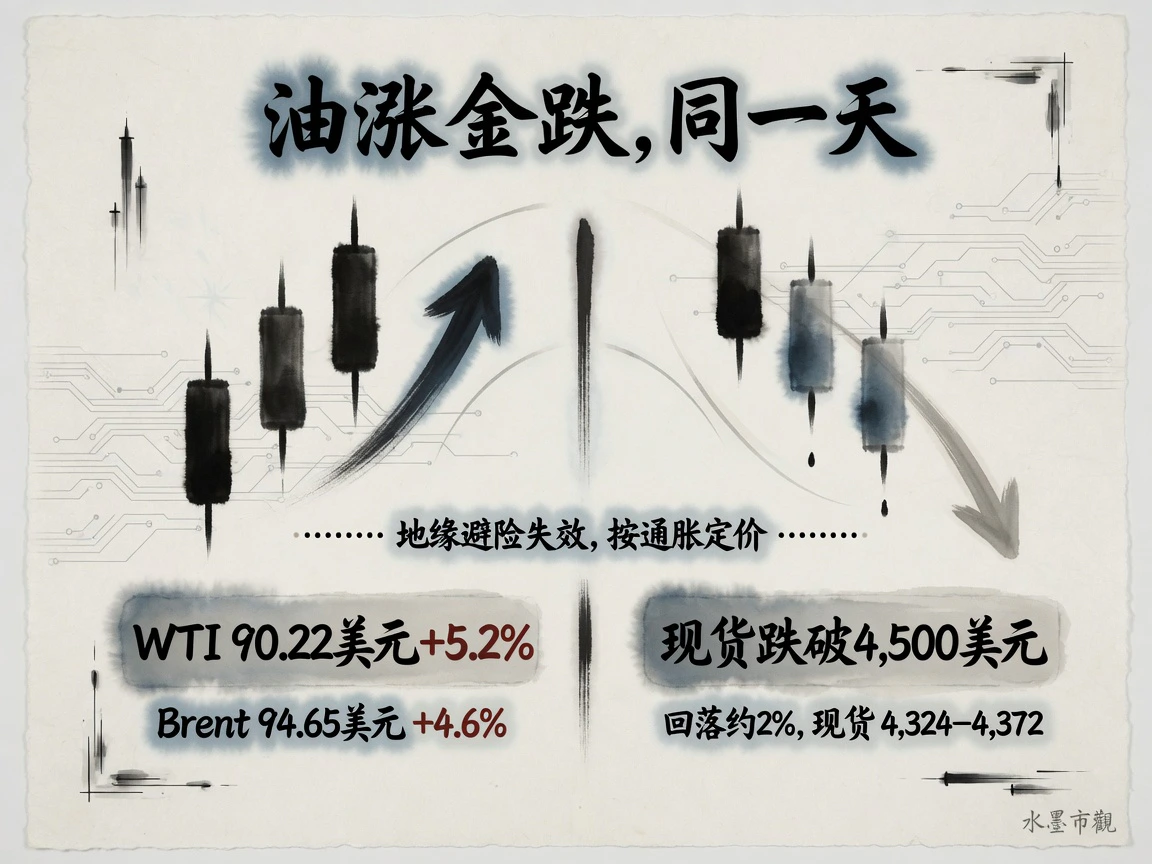
The clearest daily pricing feature was opposing moves in oil and gold: crude surged around 5%, while gold fell nearly 2%. Settlement prices were $90.22/barrel for October NYMEX WTI, +5.2%, and $94.65 for November ICE Brent, +4.6%. Both gained for a third session and reached five-week closing highs.
The immediate drivers were spreading Middle Eastern war and restricted Hormuz passage. The US launched fresh precision strikes on Revolutionary Guard facilities after two VLCCs laden with Saudi crude were attacked while leaving the strait, with normal commercial passage still unrestored. At a deeper level, this was a sharp repricing of geopolitical risk rather than pricing of a total supply cutoff. Satellite and shipping data showed daily tanker transits near five, described as around 7% of a prewar norm of 110–140/day, while some crude still passed slowly. WTI and Brent curves showed deep backwardation, with premiums concentrated in nearby 3–6-month contracts and relatively flat deferred curves. Markets were paying heavily for temporary delivery scarcity, rather than permanent capacity destruction.
Downstream refining and logistics pressure was even stronger. New York Harbor ULSD futures settled at $4.68/gallon, a high for the conflict. Middle East–China VLCC time-charter-equivalent earnings reached around $650,000/day, with isolated urgent fixtures above $800,000. War-risk insurance exceeded 15 times normal levels. Supply fears were spreading rapidly from crude into product cracks and transport chokepoints. OPEC+ had completed its final September quota increase on schedule. API data released after the close showed a 2.6 million-barrel crude draw the previous week, ending four consecutive builds; the detailed picture awaited that evening's official EIA confirmation.
Gold stood on the opposite side of the same transmission chain. Conventional reasoning would expect military escalation to stimulate haven buying, but the sequence of surging oil, worsening inflation expectations and additional central-bank tightening overwhelmed geopolitics. Spot gold rose then retreated below $4,500 and finished near the day's lows. Major sources showed $4,324–4,372/ounce and a daily decline around 2%; the retreat from mid-August record levels deepened, although gains during the year were still around 23%.
Oil up 5% and gold down 2% provided a central market signal: capital was systematically discounting the conflict as an adverse supply and inflation shock rather than a panic-driven tail crisis. If even an extreme strait-blockade event could not lift gold, the restraining anchor had shifted to expectations of higher real rates, closely linked to oil-driven anxiety about hikes.
At the September 2 08:01 Beijing-time cutoff snapshot, WTI was $90.75 and Brent $95.20. Asian early trading fluctuated steadily at high levels without a second chase-driven jump.
Equities: A shallow but broad duration sell-off
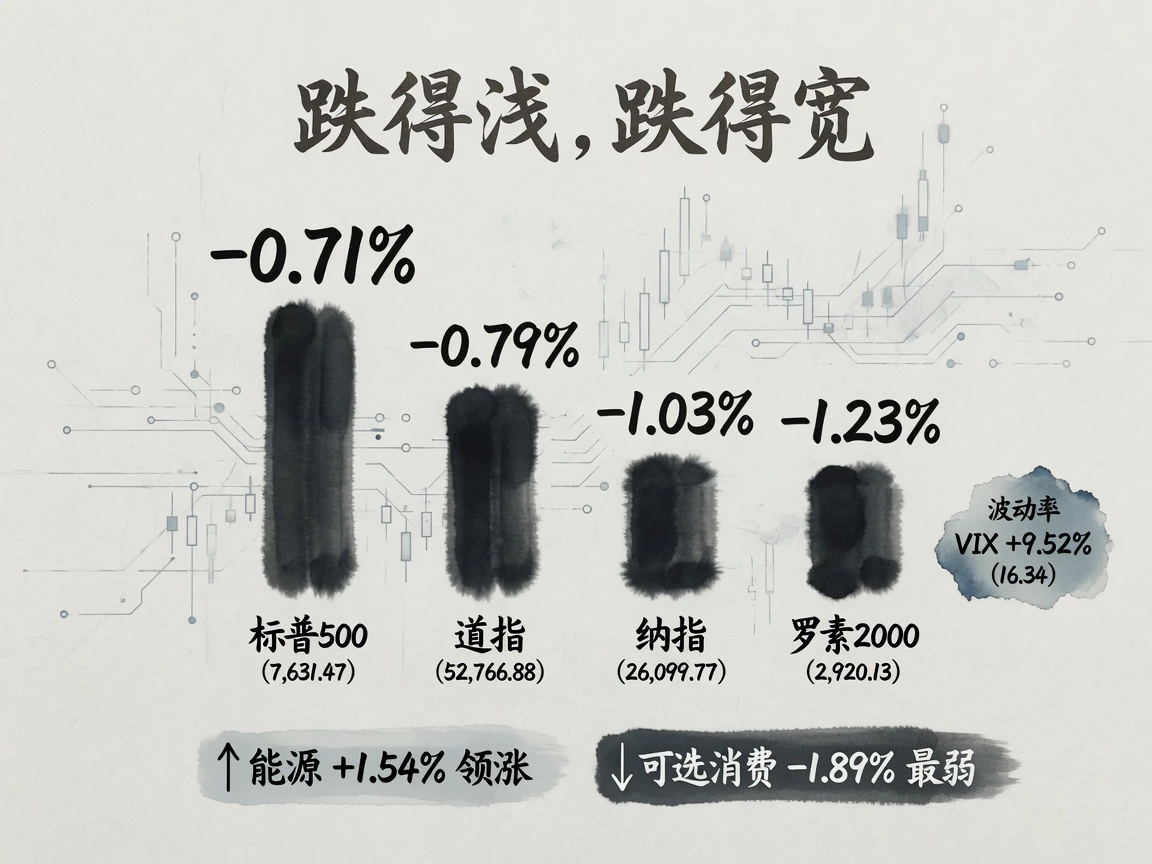
US equities declined across the board, showing pressure on duration assets from higher risk-free rates and energy costs. The S&P 500 fell 0.71% to 7,631.47; Dow 0.79% to 52,766.88; Nasdaq Composite 1.03% to 26,099.77; Russell 2000 1.23% to 2,920.13. VIX rose 9.52% to 16.34. The three main indices fell for a third session on the opening trading day of historically weak September. Reuters statistics identified September as the only month with a negative average S&P return since 1926. Decliners outnumbered advancers around 2.8:1, while total volume was slightly below the recent monthly average. The sell-off was limited in size but broad, a relatively orderly valuation compression without a liquidity run or systemic panic.
Sector differences mapped clearly to rate and cost sensitivity. Energy led with +1.54%, while utilities and healthcare held up relatively well. Consumer discretionary led losses at -1.89%, technology fell 1.00%, and Dow Transports dropped 2.51%, directly absorbing higher jet-fuel and diesel costs. Defensive leadership and pressure on long-duration assets suggested passive portfolio rebalancing for higher yields. Apple rose 2.5% on the first effective day of its CEO handover, Moderna gained around 10% on positive news, and declines in Nvidia and Amazon were major index drags.
After-hours results supplied important company signals. Dell's AI-server revenue reached $16.4 billion, doubling year on year; it recorded a record $60.9 billion AI backlog and raised full-year revenue guidance by $25 billion. Shares initially rose over 10% after hours, offering evidence that strong AI capital expenditure could counter rate headwinds. Palo Alto Networks beat revenue and ARR expectations, but a GAAP loss and cash-flow outlook prompted concern and shares gave back initial after-hours gains. US index futures gradually stabilized overnight: at 08:01 Beijing time, S&P futures were 7,645.25 and Nasdaq futures 29,134.5.
Asia-Pacific markets diverged. Japan focused on a returning hike cycle: with the 10-year JGB at 3.0% and September 25 bp hike bets at 80%–90%, Nikkei 225 fell 0.15% while Topix rose 0.62%. Financials and resources led; expensive semiconductors weakened. KOSPI edged up 0.23%. Hang Seng fell 0.93% to 25,329.73 as large technology stocks took profits. Shein traded weakly on its Hong Kong debut, closing at HK$48.50 after an intraday fall over 10%, with retail oversubscription only 5.63 times. In mainland equities, dividend defensives diverged from growth: Shanghai slipped 0.16% to 3,979.89 and Shenzhen Component fell 1.02%, with banks and liquor offsetting technology weakness. Early on September 2, Nikkei opened about 1.5% lower near 65,195. Regional assets balanced stabilizing US stocks against persistent valuation pressure from high Japanese yields.
Policy and geopolitics: Sanctions calendar provides a window
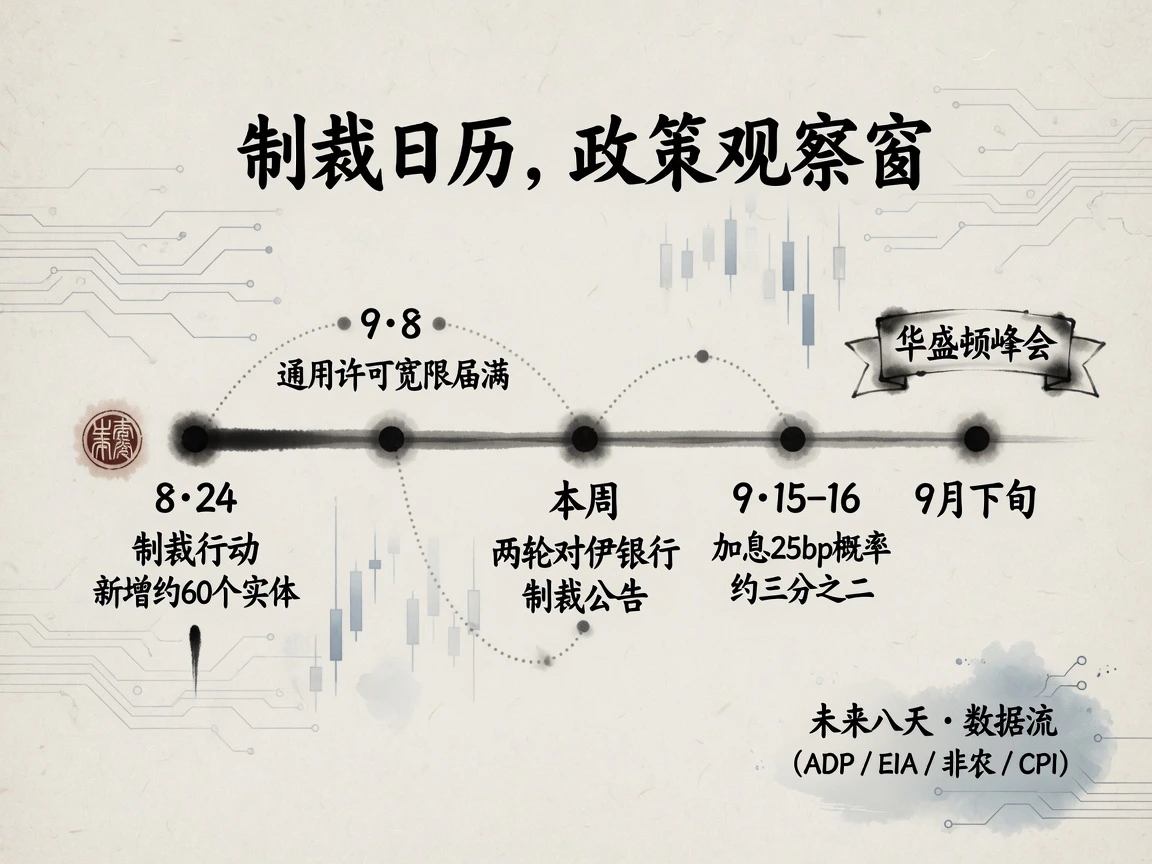
The conflict's asset transmission had become sufficiently consistent that macro pricing no longer required hourly battle reports: oil +5%, Treasury yields +4–6 bp, long-duration equities lower, volatility higher and gold also weaker. Global markets clearly treated it as **a supply-driven second inflation wave and greater tightening probability, rather than an indiscriminate liquidity and systemic-haven shock**. US–Iran confrontation had so far avoided core export terminals, major refineries and key nuclear facilities, preserving room for deterrence and retreat. The main political anchor remained a late-September multilateral Washington summit. If fighting eased beforehand, the summit proceeding on schedule remained the baseline.
Financial sanctions and physical conflict were escalating together. On August 24, Treasury blacklisted around 60 entities linked to digital assets and energy shipping, with general-license exemptions expiring September 8. The Treasury secretary also signaled incremental sanctions against Iran's banking system during this week and the next. September 8 and the detailed new rules would reveal the boundary of spillovers. Without external third-party entities or clearing banks being targeted, the confrontation would remain escalation within an established range. Broader sanctions could instead move oil premiums and global equities toward more violent, unanchored swings.
At the New York close, swaps and futures implied a 66%–69% probability of a 25 bp FOMC hike on September 15–16. A gap of 8–10 percentage points versus prediction markets showed no undisputed consensus between immediate September action and holding high rates while waiting. The next eight working days' calendar carried the entire contest: ADP employment, EIA inventories, Fed commentary, Treasury auctions, payrolls and finally August CPI would determine whether this inflation-and-hike trade could be realized.


