On September 1, the U.S. cash-market trading day, U.S. forces launched their largest strikes on Iran in a month, for the first time extending targets to a Hormuz-bypassing export route around southern coastal Jask. Reports that two VLCCs were attacked while attempting to leave the Strait Monday night, and another tanker caught fire after hitting a mine, helped oil break out of its nearly month-long consolidation range.
Front-month October WTI closed at $90.22, up $4.46 or 5.2%, and November Brent at $94.65, up $4.16 or 4.6%, both their highest closes since late July. The central driver was that bypass routes previously considered safe were also exposed to attack. Speculative and hedging funds rapidly priced extreme cutoff tail risk into nearby discounts. In physical logistics, freight retreated from historic extremes while diesel crack spreads set a record. The mismatch—crude supply not fully cut off, but effective shipping and products scarce—persisted, with escalating deterrence and reshaped physical flows in a delicate rebalancing.
Both benchmarks set new highs as nearby contracts pull ahead
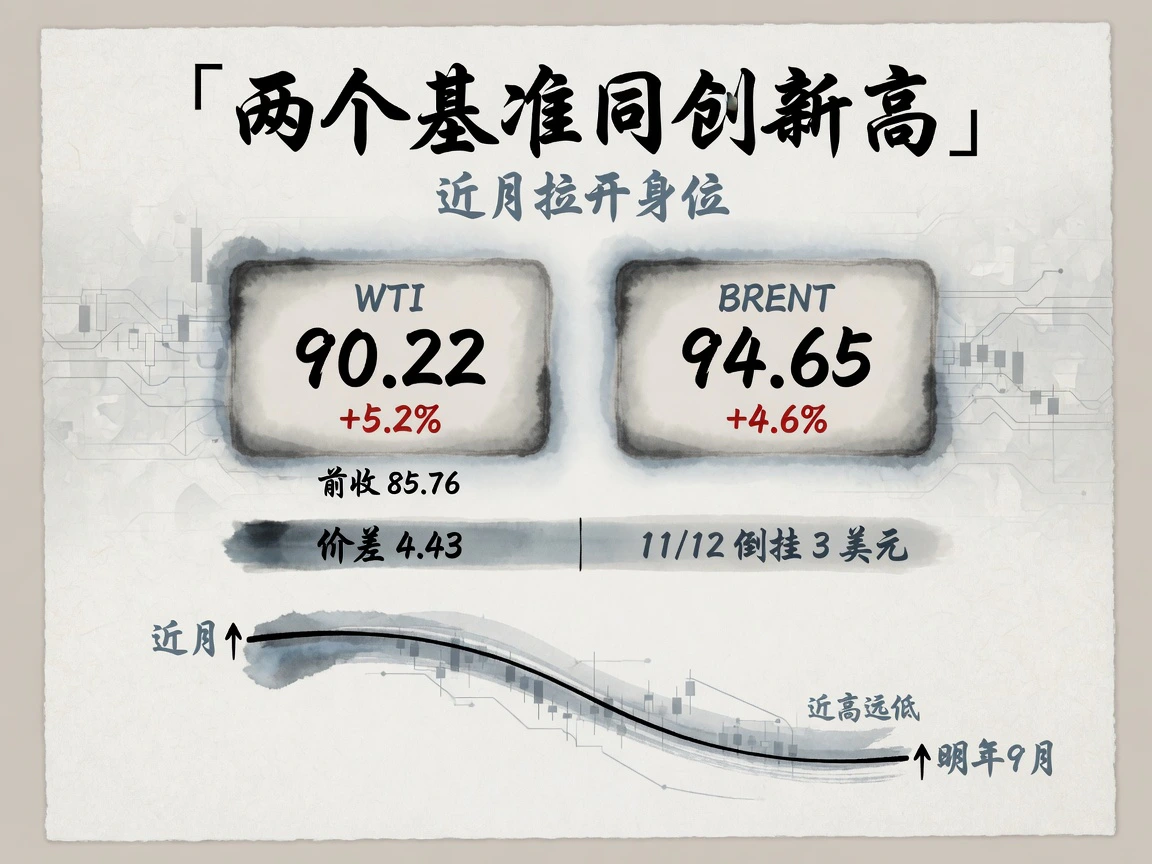
October WTI settled at $90.22, $4.46 above the prior $85.76, breaking upward on increased activity from around $86 to its highest close since July 23. November Brent settled $4.16 higher at $94.65, its highest since July 24. Both regained late-August pre-correction highs: August 21 settlements were WTI $87.06 and Brent $94.39. WTI's two-day gain reached 8.2%.
Brent's premium to WTI was about $4.43, slightly narrower than last week's roughly $4.7; both moved together without a sharply wider seaborne premium. The curve retained steep backwardation: November/December Brent widened to about $3, December traded $91.5–92, next January around $88.6 and next September only $78.6. A nearby premium above $15 closed storage-arbitrage opportunities, while prompt scarcity concentrated demand in nearby contracts.
Additional snapshot: at 08:01 Beijing time September 2, electronic WTI CL was $90.75 and Brent BZ $95.20, roughly another $0.5 above official settlements, showing after-hours strength. Specific daily changes in this article use formal settlements throughout.
The trigger: strikes reach a bypass export hub for the first time
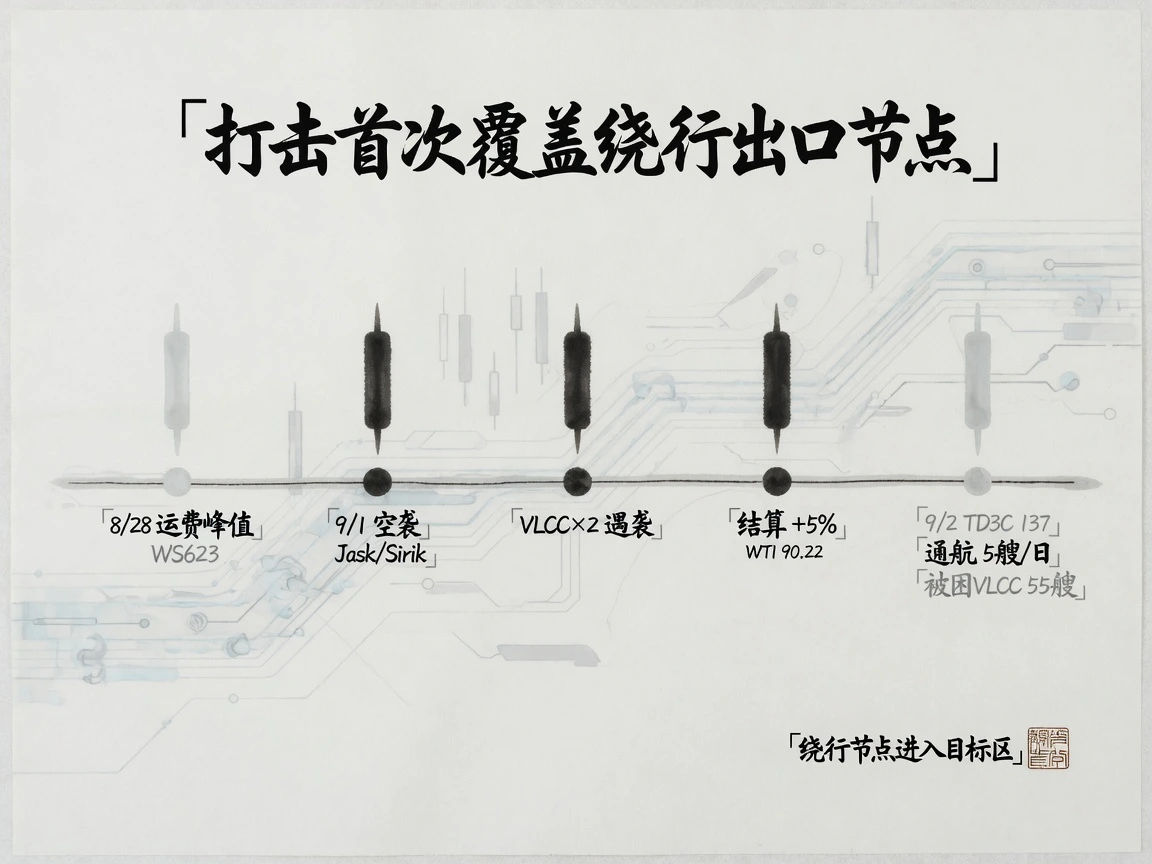
From 12:00 Eastern time September 1, U.S. airstrikes targeted southern Iranian Guard facilities, including air defense, radar, maritime facilities, mine-laying capacity and communications around Bandar Abbas, Qeshm, Chabahar and the Jask–Sirik coast. These were the first large-scale mainland strikes in almost a month, directly prompted by Strait mine activity and missile attacks on U.S. bases.
A more direct oil-market shock came Monday night: two departing VLCCs, Saudi Sidr and Senegalese Senegal Prosperity, were struck by projectiles, while another tanker hit a mine and caught fire. The parties confirmed there were no major casualties or crude spills and no group publicly claimed responsibility, but the reports directly ignited September 1 spot-market fear.
Jask's focus was no coincidence. Iran's only export route bypassing Hormuz directly to the Gulf of Oman relies on the Goreh–Jask pipeline and had recently handled frequent exports displaced from Kharg. Although no third party had confirmed direct destruction of the terminal itself, strikes around Jask and Sirik put a bypass lifeline within the target zone and undermined the market's baseline assumption of Gulf export resilience. Goldman estimated the seven-day average of Gulf crude exports had fallen to about 36% of prewar levels.
Iran claimed substantial Jask/Sirik coastal damage and vowed retaliation; Washington warned of larger responses. Traffic remained in single digits, with media counting about five vessels daily versus a normal 14. Many sailed with AIS off; about 55 VLCCs were stranded inside the Gulf. War-risk rates reached 15 times peacetime levels; on a $150 million vessel, each Strait transit implied about $2.3 million in added insurance.
Unlike aggressive futures buying, freight was retreating from extremes. The Baltic Exchange's September 2 TD3C assessment fell to WS137.17, equivalent to about $123,000 daily time-charter earnings, from August 28's WS623, about $650,000 daily. With the Strait partly paralyzed, actual deals for forced passage were scarce and index quotations more indicative than transacted; flows shifted to Gulf of Oman STS transfers and Cape of Good Hope detours. A buffer remained between rhetoric and physical cutoff: no conclusive destruction of Jask's main terminal was reported, pipeline capacity remained and a new global supply-loss gap had not been firmly established.
Inventories and supply: barrels exist; ships and products are lacking
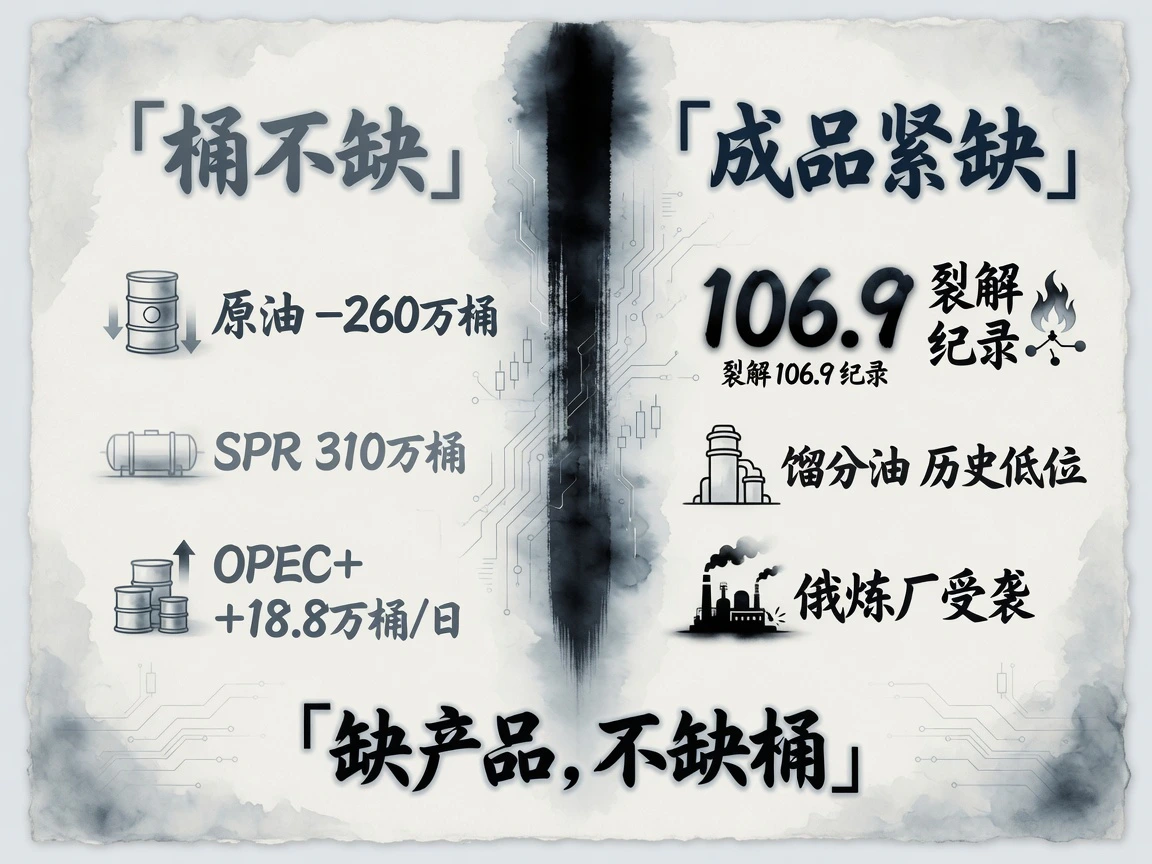
With EIA's official report delayed to September 2 at 10:30 Eastern, 22:30 Beijing, API's advance figures guided markets. In the week ended August 28, commercial crude fell 2.6 million barrels versus a prior 4.2 million build; gasoline rose 300,000, distillates fell 300,000 and Cushing rose 200,000. Another 3.1 million SPR barrels were released, leaving 286.6 million, near the 250 million–300 million operational red line. Commercial stocks had drawn about 48 million barrels over 20 weeks.
Products were physically tighter than crude. The U.S. ultra-low-sulfur diesel crack against WTI touched a record $106.9 a barrel intraday, while distillate stocks fell to multidecade seasonal lows. Repeated Russian refinery attacks and product-export limits again centered the theme of scarce final products despite crude underground.
Producer policy had no incremental change. OPEC+ retained its August 2 decision to raise September quotas by 188,000 barrels daily, completing reversal of the 2023 voluntary 1.65 million cut, while the 2022 roughly 2 million cut baseline continued through year-end. Attention moved to September 6's meeting, with major institutions generally expecting no further increases from October.
Macro tightening: why a stronger dollar and hike expectations cannot suppress oil
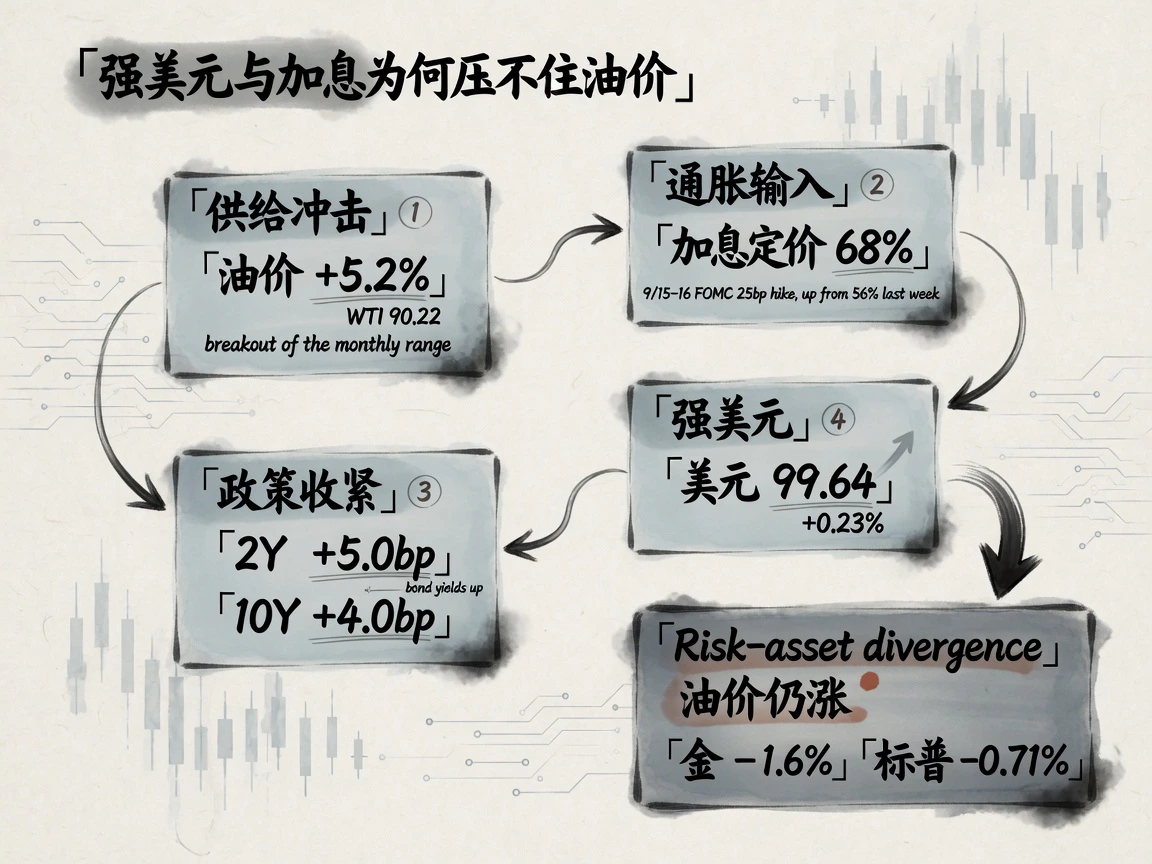
September 1's oil surge triggered altered cross-asset transmission. Treasury yields rose across the curve: two-year 4.39%, +5.0 basis points; ten-year 4.79%, +4.0; 30-year 5.27%, +2.0. The dollar index recovered to 99.64, +0.23%, while futures-implied odds of a 25-basis-point hike at September 15–16 FOMC jumped to 68% from about 56% a week earlier. FX and bonds priced oil's jump as a fresh imported-inflation shock.
Unlike July–August haven buying that lifted gold, spot gold fell about 1.6% to $4,365–4,368 and S&P 500 dropped 0.71%. Assets were trading supply-contraction stagflation and faster tightening rather than simple fear. Nearby oil's surge despite dollar strength and tighter liquidity highlighted physical risk's weight. Tighter finance nevertheless constrains further upside; confirmation that high prices damage demand would leave substantial valuation resistance above $90.
Three forces converge: what the 5% gain prices
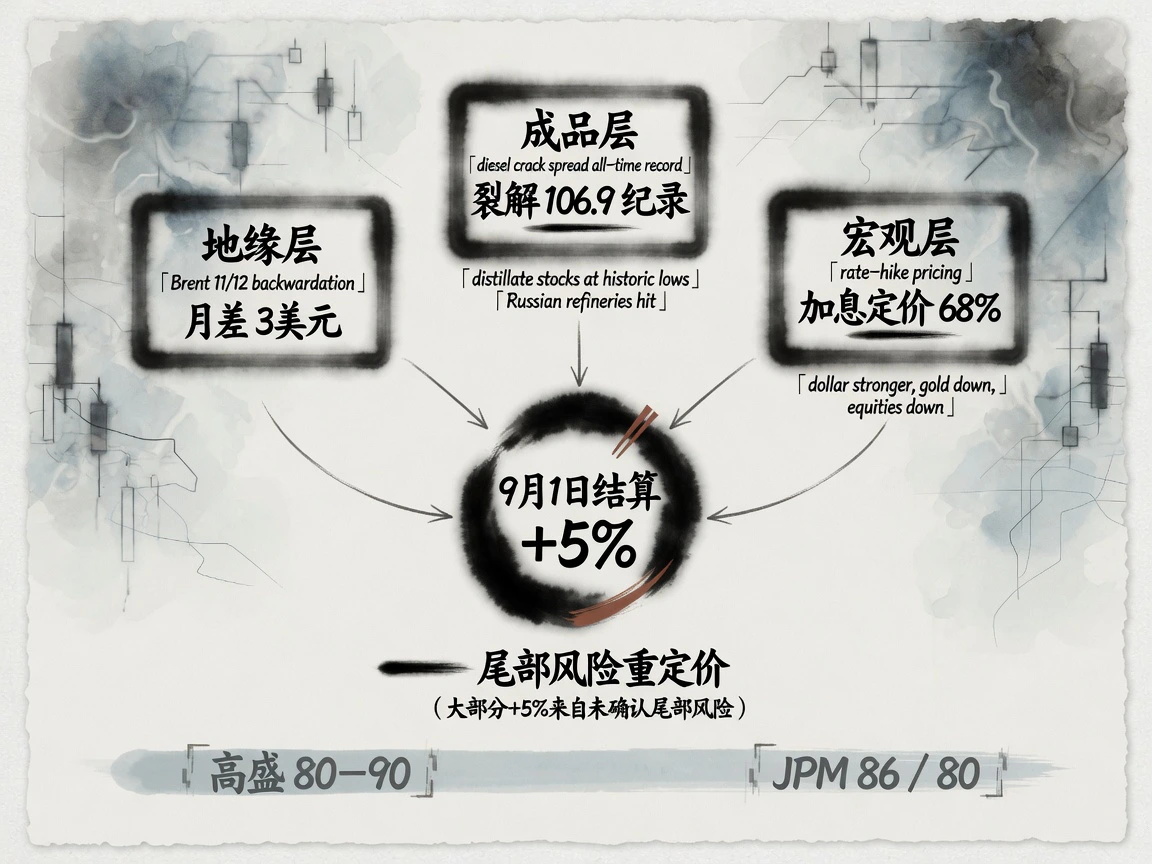
The more-than-5% September 1 oil advance reflected three intertwined forces:
Geopolitics supplied the trigger: targeting expanded from offshore outposts to contiguous mainland defenses and first reached alternative export routes. Nearby risk premiums were rebuilt rapidly, nearby contracts outperformed deferred ones and November/December backwardation widened to $3.
Industry fundamentals provided support: record diesel cracks, historically low distillate stocks, damaged refining and export constraints restored product scarcity as a driver of stronger crude.
Macro variables became constraints: higher hike odds, a stronger dollar and falling gold and stocks tightened finance and quickly limited deferred valuations.
Major banks' baseline anchors remain well below spot markets. Goldman forecasts $80–90 with fair value around $80. JPMorgan forecasts $86 in the third quarter and $80 in the fourth, estimating each month of genuine disruption adds $7–8 a barrel. Actual physical losses remain limited, so much of the 5% rise reprices unconfirmed tail disruption risk. Four tests matter next: EIA confirmation of draw strength, September 6 OPEC+ guidance on output, satellite confirmation of material Jask damage and the freight/risk-premium rebalancing amid extremely low turnover.


