Gulf oil exports are gradually returning, but fuel bills at filling stations and airlines remain burdensome.
Goldman Sachs's latest assessment on August 28 estimated Gulf crude and product exports at 15 million–16 million barrels daily, about two-thirds of prewar levels. This substantially eased fears of an extreme crude cutoff, but relief has been slow to reach downstream users. Original Bloomberg report
By late August, U.S. regular gasoline retail prices remained about 39% above prewar levels and highway diesel about 47% higher; Gulf Coast spot jet fuel was up more than 50%. Crude leaving port is only the first supply-chain step. Refining or logistical blockages before it becomes usable fuel delivered to customers can detach product prices from crude.
What does a two-thirds export recovery actually include?
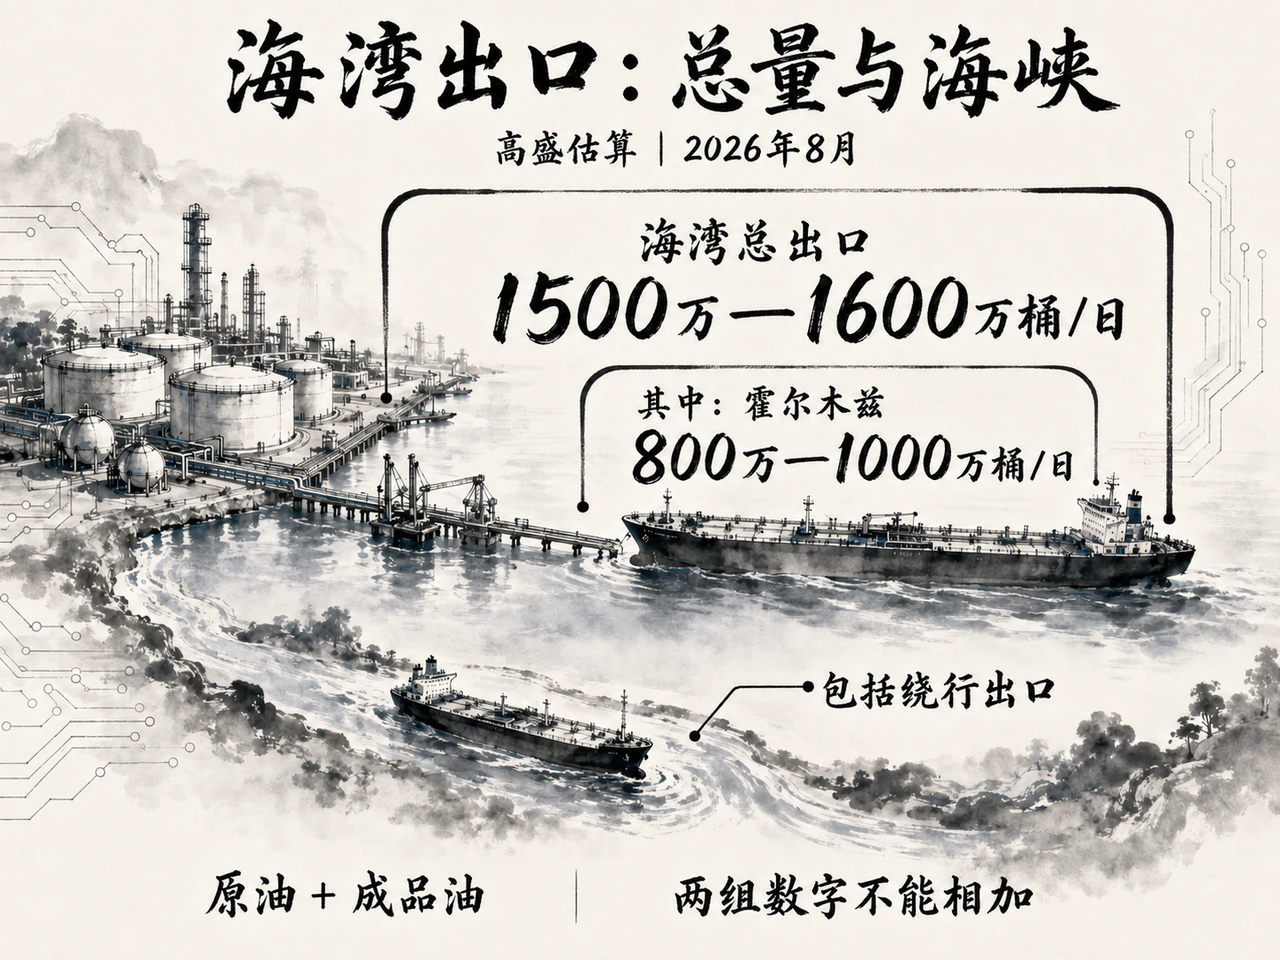
The first step is defining Goldman's figures. Its 15 million–16 million barrels daily is total Gulf crude and product exports, including both Hormuz cargoes and alternatives such as overland pipelines. It cannot simply be equated with visible vessel transits through the Strait.
Goldman estimated actual Hormuz oil flows at 8 million–10 million barrels daily, relying substantially on invisible transport with AIS signals off and offshore ship-to-ship transfers. Hormuz flows are already included in total Gulf exports; these are a total and subset and must not be added.
Indirect estimates cut both ways. Public AIS tracks alone understate real activity, but the existence of gray transfers cannot prove how much crude was safely delivered. Actual export efficiency requires comparing berth loading, ship capacity, headings and destination arrivals. A loaded tanker and an empty ballast return have entirely different supply implications.
Transport has clearly improved from March's low of 5 million–6 million barrels daily, but remains 7 million–8 million below prewar levels. Removing the earlier extreme full-blockade premium and adding transport capacity reduced panic in crude markets. Exports at only two-thirds of prewar levels nevertheless leave a firm physical shortfall. Scope and estimates in Bloomberg's report
Export composition matters even more. Customs oil exports include crude, diesel and jet fuel. If crude arrives where refinery bottlenecks prevent processing, it relieves a local fuel shortage far more slowly than a diesel cargo that can discharge directly into storage.
Unresolved refining bottlenecks concentrate pressure in products
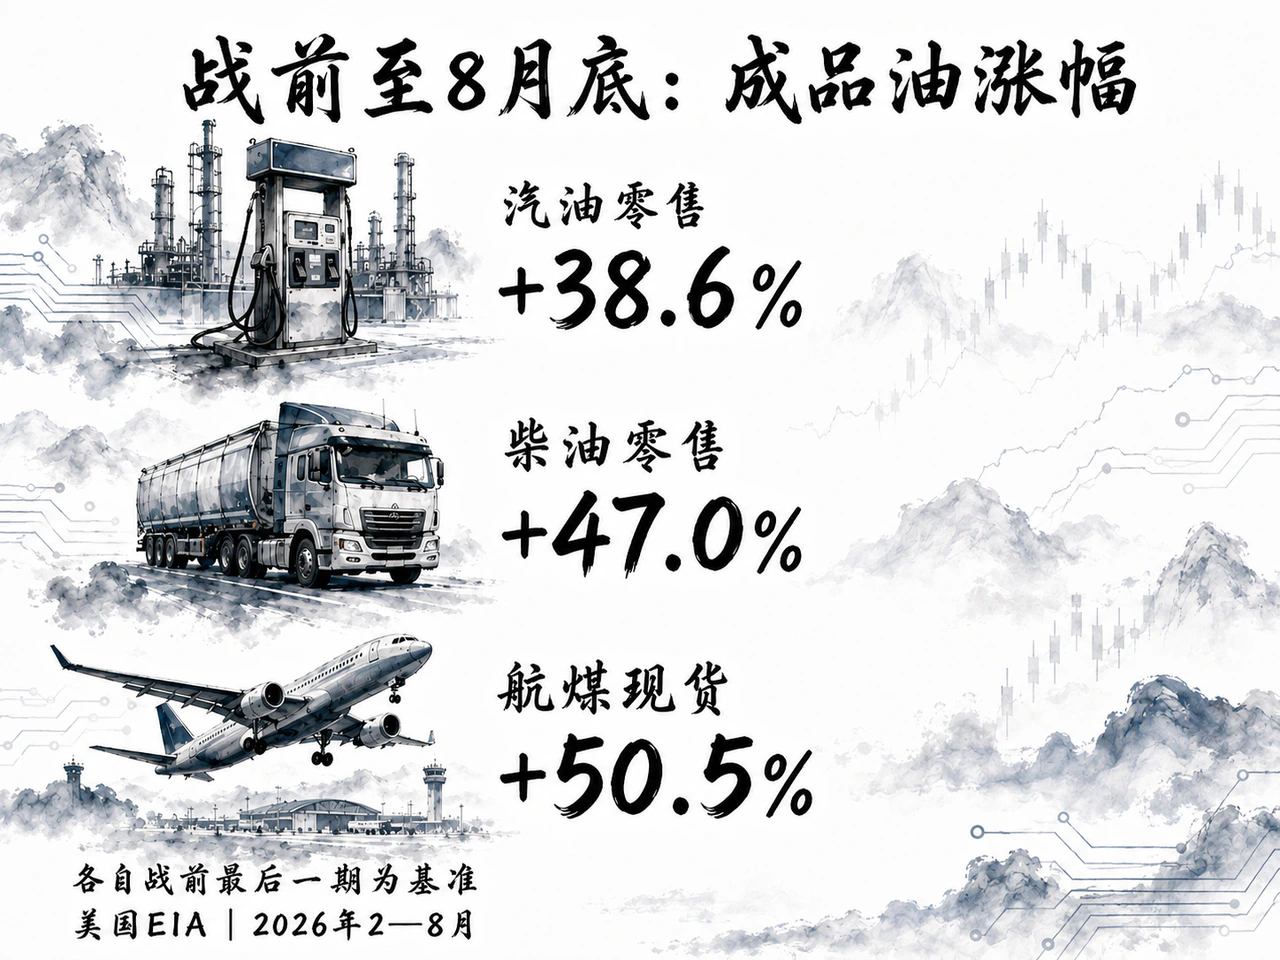
EIA tracking clearly records six months of downstream distortion. Units are dollars per gallon, with increases measured against the final prewar observation:
| Price measure | Prewar baseline | Latest, late August | Increase from prewar |
|---|---|---|---|
| U.S. regular gasoline retail | 2.937 | 4.071 | +38.6% |
| U.S. highway diesel retail | 3.809 | 5.599 | +47.0% |
| Gulf Coast spot jet fuel | 2.469 | 3.715 | +50.5% |
Note: gasoline and diesel compare February 23 with August 31; jet fuel uses weekly averages for the weeks ended February 27 and August 28. Each measure describes its own trend and is not a basis for calculating refining margins. Sources: EIA gasoline, diesel, jet fuel.
Prices have not risen in a straight line. Major fuels retreated with crude from June to early July, then diesel and jet fuel rebounded much more strongly. From their lows, gasoline rose only about 7.8%, versus diesel's 22.3% and jet fuel's 31.9%. Diesel retail prices are again near their post-conflict peak, while gasoline remains almost 10% below May's high.
The core cause of this extreme margin divergence is damage to global refining and middle-distillate supply chains. IEA estimated July refinery throughput at only 80.9 million barrels daily, nearly 5 million lower year on year, and seaborne product trade down 3.8 million. Damaged Russian refineries and restricted Gulf and some Asian exports effectively removed about 20% of global seaborne diesel trade and 34% of jet-fuel trade. IEA August Oil Market Report
Cross-regional flows were forcibly reorganized. Reuters said European jet-fuel imports gradually returned to early-year levels in June and July, but diesel arrivals stayed severely constrained, producing the unusual inversion of diesel costing more than jet fuel. Reuters report
Goldman global commodities head Nitin Jindal summarized in a recent interview that crude had proved resilient through peak summer travel, while products remained trapped by Gulf export disruption and damaged Russian refining. Crude's supply-demand narrative was easing, but product shortages remained stubborn. Goldman Sachs interview
This explains the apparent contradiction: even if benchmark crude's war premium disappears, high fuel surcharges facing industrial and agricultural transport and civil aviation will not truly recede until downstream refining and cross-border product shipping normalize.
Demand contraction: how much is temporarily suppressed and how much permanently lost?
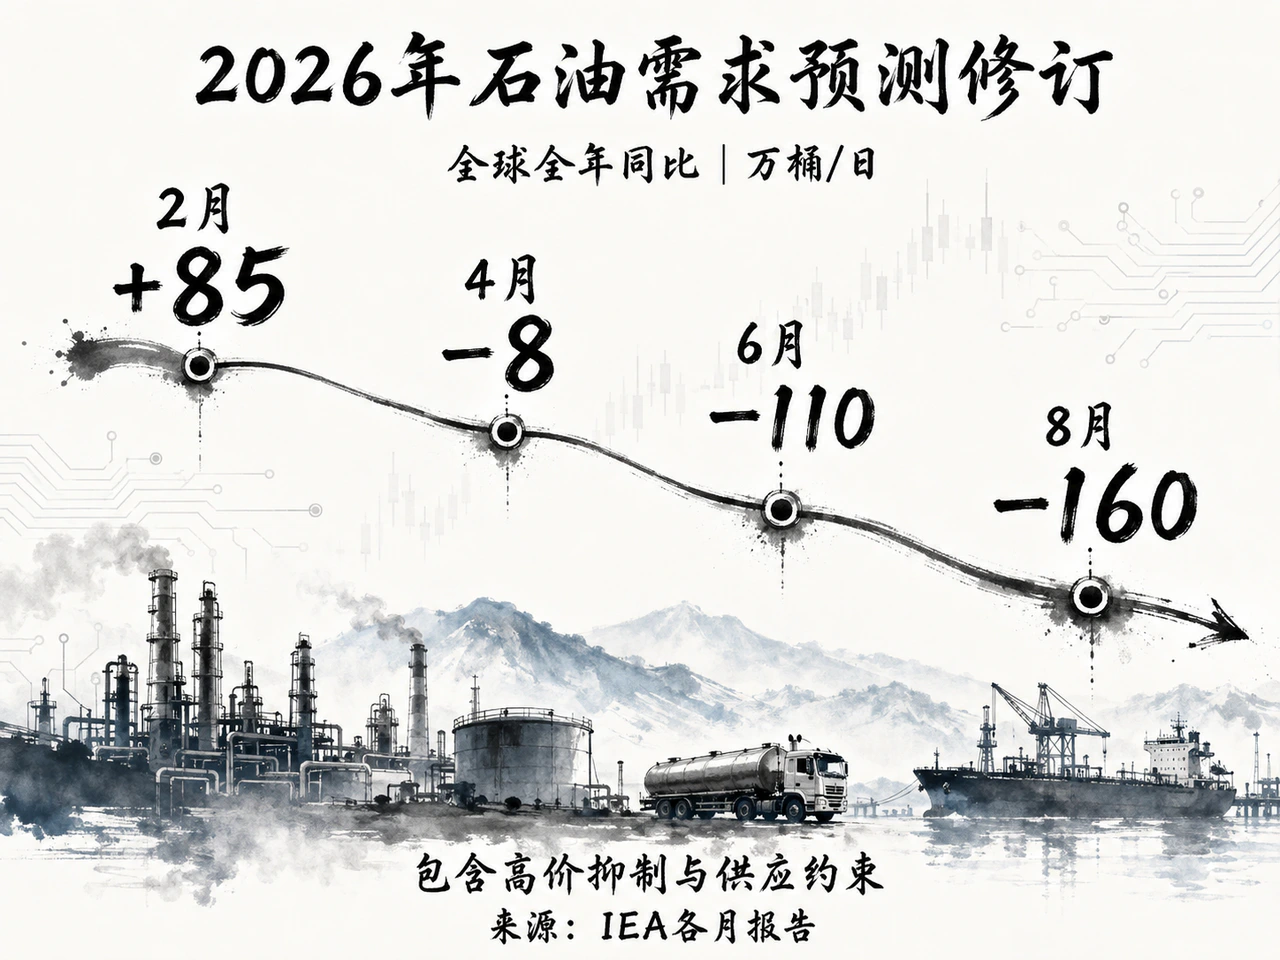
High prices continue destroying demand. Before the war, IEA's February forecast optimistically put 2026 global growth at 850,000 barrels daily. By April it projected an 80,000-barrel decline, in June a 1.1 million decline and in August a 1.6 million decline. The full-year average-demand forecast was cut by 2.45 million barrels daily. IEA February report, April report, June report, August report
Analysis must distinguish temporary demand priced out by high costs from permanent substitution through the energy transition:
One part is forced reduction through price elasticity. Soaring fuel costs and feedstock shortages force chemical and transport firms to cut operating loads. IEA warned in April that Asian petrochemical majors reduced utilization because of light-naphtha and LPG disruption. IATA data showed July global passenger traffic up only 0.2% year on year and Middle Eastern carriers down 10.0%. Demand suppressed by fares, rerouting costs and supply breaks is a cyclical shock that can return as feedstocks recover and prices fall. IATA July passenger data
Another part is structural weakening from industrial transition. In China, July industrial value added rose 4.5% year on year while crude processing fell 15.8%. NBS data, July energy production. January–July growth came chiefly from high-tech manufacturing, +13.8%, and software services, +10.6%, while energy-intensive property-development investment fell 19.2%. As growth shifts from heavy infrastructure and property toward lighter technology manufacturing, use of construction-equipment diesel, long-haul logistics fuel, heavy oil and bitumen naturally decouples.
Transport electrification brings more irreversible substitution. China's Commerce Ministry put July domestic new-energy passenger-car retail penetration at 65.1%. Ministry July consumption report. Even allowing for incumbent combustion vehicles' mileage and plug-in hybrids' actual fuel use, substitution is firmly established.
Globally, first-quarter electric-car sales fell 8% year on year amid retreating U.S. and European subsidies, while Europe itself grew about 30%; the long-term substitution trend nevertheless did not reverse. IEA Global EV Outlook 2026. IEA estimated EVs displaced about 1.7 million barrels daily of oil consumption in 2025, rising to 5 million by 2030. IEA electric-mobility outlook.
Falling prices could bring back postponed flights and reduced-load chemical plants, but gasoline and highway-diesel consumption displaced by EVs is unlikely to return the same way. Their relative shares determine how high demand can rebound when supply eases.
Finding a new balance: crude pricing amid divergent refining margins
Broader energy shifts lengthen the adjustment. Rapid wind and solar additions first affect electricity. They replace transport and industrial oil only with deep end-use electrification through EVs, industrial heat pumps and similar technologies. Much new renewable power is absorbed by data centers and cooling, rather than displacing oil one for one.
Aviation substitution lags further. IATA's June forecast put sustainable aviation fuel at only 0.8% of 2026 global aviation fuel. Conventional jet fuel remains essential over coming years; new energy cannot quickly fill refining and shipping disruptions. IATA industry outlook
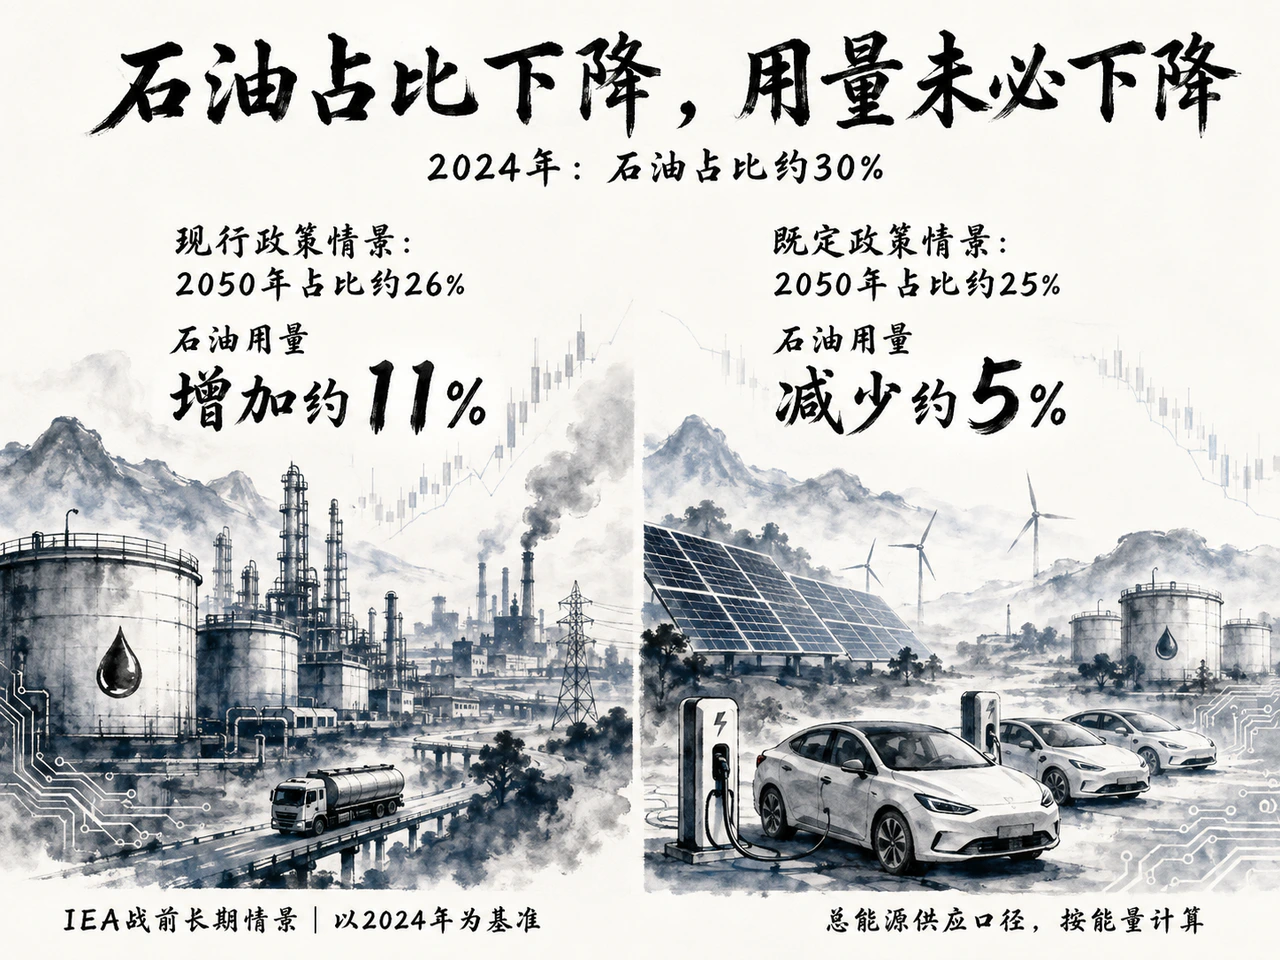
Even IEA's prewar World Energy Outlook 2025 scenarios put oil at about 30% of global primary energy in 2024 and 25%–26% in 2050. With total energy expanding, absolute oil demand in the two policy scenarios respectively rises 11% or falls only 5% from 2024. A shrinking share can coexist with high absolute consumption for a long time. IEA report, pages 414 and 420
Returning to today, Gulf exports remaining at Goldman's 15 million–16 million barrels daily do not produce a simple arithmetic oil balance. Gulf supply recovery is a regional flow; the 2.45 million daily demand downgrade is global and full-year. Strategic-stock rotation, non-OPEC output and delayed core refining recovery also intervene.
This structural mismatch defines the market:
- If crude exports keep recovering but transoceanic capacity and damaged refineries remain unrepaired, spot diesel and jet-fuel tightness will become entrenched while slowing final demand pressures crude, producing a gap between weak crude and exceptionally profitable refining margins;
- If trade routes and refinery operations fully recover, suppressed industrial activity and air travel will return cyclically, limiting a major crude decline. Rising electrification penetration will simultaneously constrain the long-term ceiling for road-fuel demand.
Crude returning to sea removes only the most extreme scenario. Meaningful relief in downstream energy costs depends on effective rebuilding of diesel and jet-fuel stocks and extreme refining spreads returning to reasonable levels.


