The Strait of Hormuz carries around one-fifth of global crude and liquefied natural gas trade, making it a nerve center of oil transport and pricing. On September 3, US–Iran fighting reached its greatest intensity since July, but oil markets reacted relatively calmly: October WTI settled at $91.79/barrel, up 0.86%, and November Brent at $95.91, up 0.29%.
Both rose for a third consecutive session, gaining more than 8% cumulatively and reaching six-week highs, but daily gains were clearly diminishing. There was no panic buying. Instead, markets priced each incremental escalation separately: nearby contracts remained in very steep backwardation, while deferred prices still refused to pay upfront for a complete shipping shutdown. Investors were willing to pay for immediate barrels, without excessive fear over future barrels.
Gains narrow as steep nearby backwardation discourages forward storage
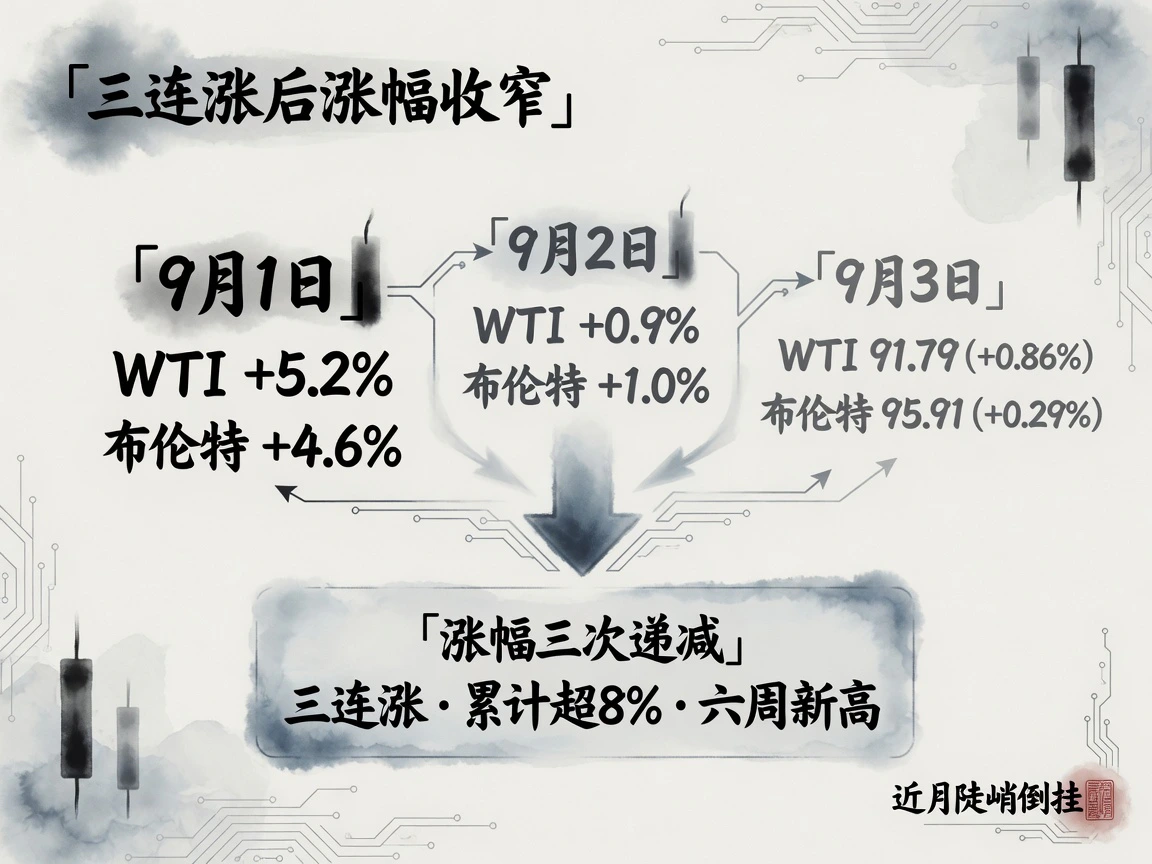
On September 3, October WTI closed at $91.79/barrel, $0.78 or 0.86% above the previous $91.01 settlement. November Brent closed at $95.91, up $0.28 or 0.29% from $95.63. Both main contracts reached their highest closes since late July. Compared with September 1 gains of 5.2% for WTI and 4.6% for Brent, followed by September 2 gains of 0.9% and 1.0%, upward momentum had diminished for a third day.
Brent swung between $95–97 and WTI between $90–93 intraday. Both finished toward the upper end, but neither established a one-way breakout. The Brent–WTI spread narrowed to about $4.1 from around $4.6, showing no jump in the seaborne-exposure premium and retaining the assumption that Hormuz cargo flows had not been completely cut off.
The curve provided a clearer view of expectations. Nearby backwardation remained extreme: November Brent stood around $3.6–4.0 above December, $6.7–7.3 above January 2027 and $14–16 above May 2027. Deferred prices gradually declined toward the high $70s. This steep backwardation made cash-and-carry and floating storage uneconomic, with no appetite to accumulate supplies for deferred use.
Pricing basis: MarketWatch put that day's official exchange settlements at $91.30 for WTI and $95.52 for Brent, around $0.4–0.5 below continuous-contract readings but in the same direction. Daily changes in this article use official settlements consistently. At the September 4 07:50 Beijing-time cutoff snapshot, both contracts were consolidating electronically, broadly unchanged from settlement.
High US refinery utilization offsets shortfalls as Gulf supply tightens structurally
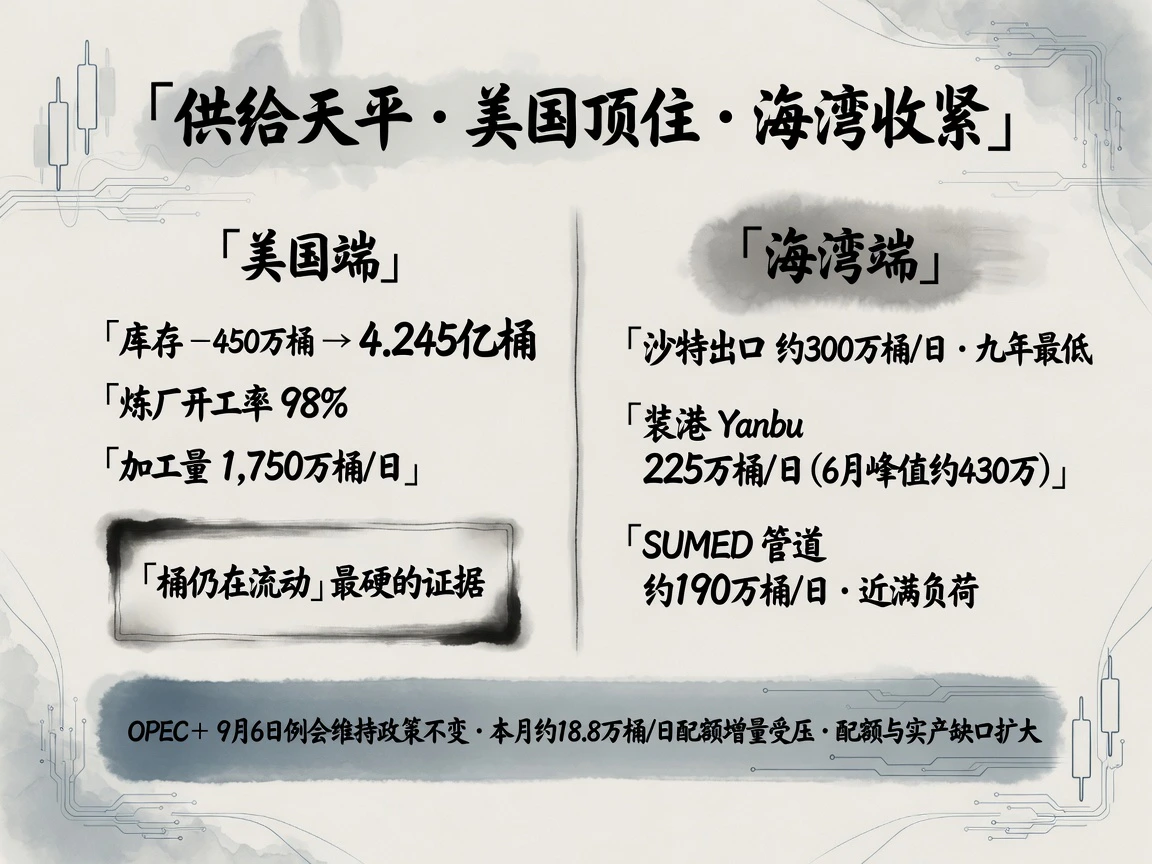
The latest EIA weekly report, released September 2 for the week ended August 28, showed commercial US crude stocks falling an above-expected 4.5 million barrels to 424.5 million, about 1% above the five-year seasonal average. Cushing stocks were 22.5 million barrels, up 80,000 on the week. Strategic Petroleum Reserve stocks fell another 3.1 million to 286.6 million barrels. Refinery utilization surged to an extreme 98%, with crude runs at 17.5 million barrels/day, up another 102,000 from the prior week. Labor Day delayed the next report to September 10.
Historically high domestic refinery utilization and rapid processing helped ease fears over Middle Eastern disruption at the margin, providing a crucial physical anchor for the proposition that crude was still moving.
The underlying supply risk nevertheless lay in the Gulf. Vessel-tracking data from Bloomberg, Vortexa and Kpler showed Saudi August crude exports down to around 3 million barrels/day, the lowest in at least nine years. Yanbu loadings fell from a June peak near 4.3 million to around 2.25 million in August. Egypt's SUMED pipeline, bypassing Hormuz, carried approximately 1.9 million barrels/day in August, close to designed capacity.
OPEC+ remained quiet. Reuters reported that a seven-country online meeting scheduled for Sunday, September 6, was expected to keep October policy unchanged without further output increases, shifting its focus to the 2027 capacity-baseline review, with third-party audits expected by late September. The 1.65 million barrels/day of voluntary cuts agreed in 2023 had been fully restored in September, but localized conditions prevented implementation of about 188,000 barrels/day in planned incremental quota that month. As the gap between effective capacity and actual production widened, core producers' reluctance to provide additional supply removed an important policy safety valve above prices.
Macro constraints ease as equities, bonds and currencies support valuations
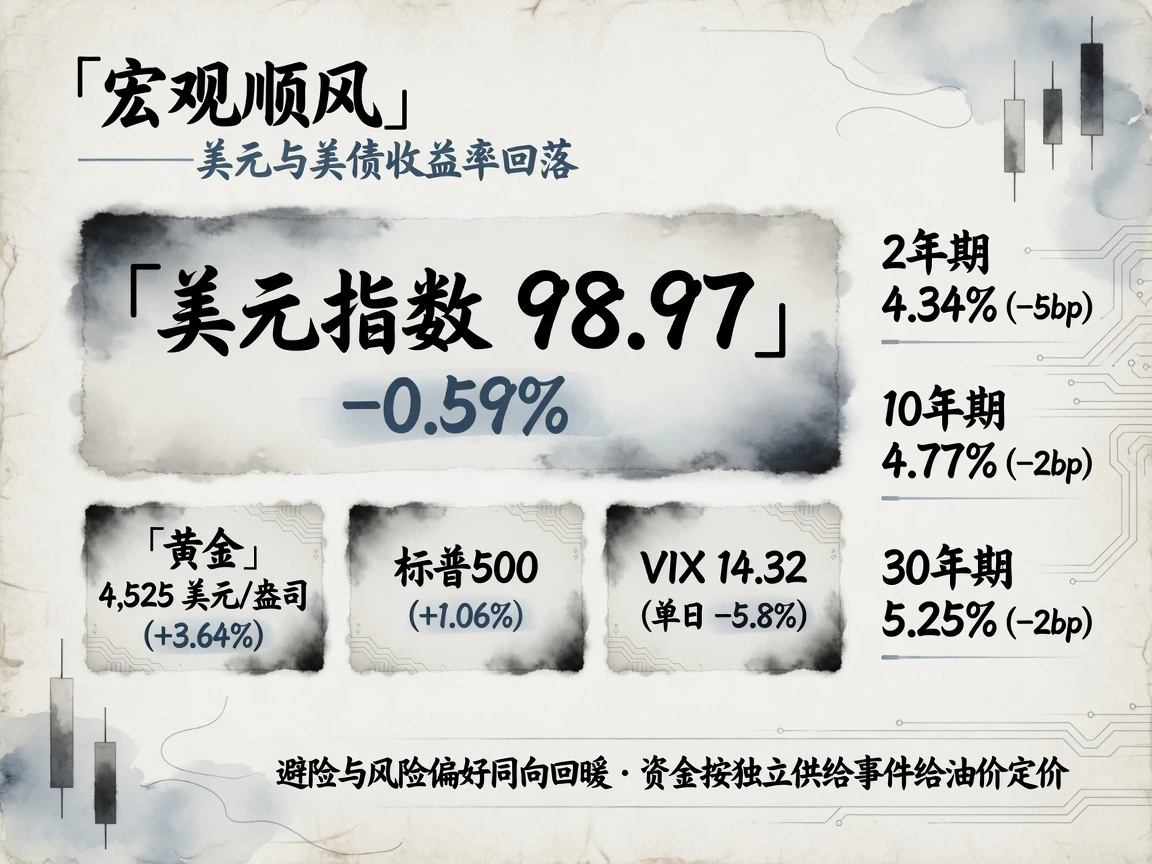
Cross-asset performance at the September 3 close imposed no restrictive constraint on commodities and instead offered a relatively supportive valuation environment. The dollar index fell 0.59% to 98.97, spot gold rose 3.64% to $4,525/ounce, the S&P 500 gained 1.06% and VIX fell 5.8% to 14.32. Treasury yields declined across maturities on the settlement basis: 2-year down 5 basis points to 4.34%, 10-year down 2 to 4.77%, and 30-year down 2 to 5.25%.
Lower Treasury yields and a weaker dollar directly opened room for dollar-priced commodities to rebound. The unusual simultaneous rise in haven gold and risk-sensitive equities suggested that capital was treating Middle Eastern friction as a discrete supply disturbance rather than extrapolating uncontrolled global inflation or systemic liquidity stress. Yen volatility increased during Asia, with USD/JPY at a 158.9 settlement and near 155.6 in the cutoff snapshot, but had not transmitted negatively to crude.
Geopolitics and shipping: Threats carry a premium, but destruction remains unconfirmed

September 1–3 saw the most intense US–Iran exchanges since July. US forces targeted radar sites, missile launch positions and minelaying facilities along Iran's southern coast. Iran retaliated with drones and ballistic missiles against US regional bases; the US said most were intercepted. Washington said operations would not be prolonged, while Israel warned it retained the option of striking Iran's core energy infrastructure.
For oil pricing, threats lifted sentiment premiums, but catastrophic supply losses remained unconfirmed. So far, no independent third party had verified substantive destruction of the core export terminals in and around Hormuz.
Passage data showed gradual pressure: commercial tanker transits fell to 4–6 a day, with the 10-day moving average near 13. The United States claimed escorted cargo flows remained at 17 million–18 million barrels/day, versus around 20 million normally; commercial shipping organizations had yet to independently corroborate this claim.
The most notable security incident occurred late on August 31. A Bahri VLCC carrying approximately 2 million barrels of Saudi crude was struck by a projectile in the strait, killing two crew. A South Korean tanker in the same group was also affected.
Bypass logistics were running at full capacity. Saudi Petroline diversion to Yanbu, Egypt's SUMED pipeline, Cape of Good Hope rerouting and STS transfers at anchorages outside the strait formed an emergency network to avoid Hormuz risks, at the cost of much longer voyages and sharply higher per-barrel transport costs. Fearnleys' week 36 report dated September 2 showed elevated rates across routes: MEG/Japan WS650, Middle East–Singapore WS675 and Middle East–West WS325, while one-year VLCC charters remained at $130,000/day. By September 3, voyage war-risk premiums had reached around 1.5% of hull value, about 15 times peacetime levels. A fully loaded VLCC's one-way strait transit incurred additional insurance of around $2.3 million.
What markets are pricing: Incremental repricing rather than tail-risk panic
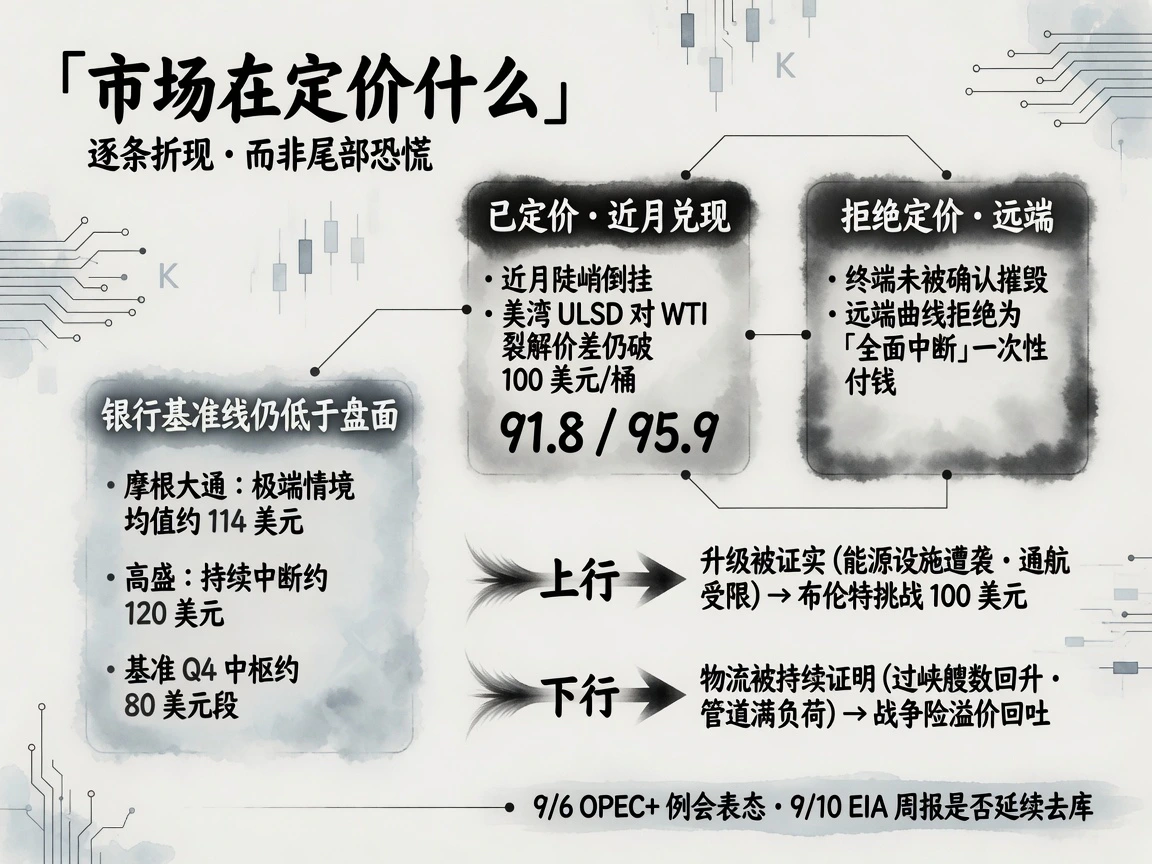
The pricing framework was clear: markets assigned a separate price to each incremental military escalation. Extreme 98% US refinery utilization, saturated alternative pipelines and the absence of confirmed terminal destruction led deferred curves to resist paying for the tail risk of total disruption. Anxiety centered almost entirely on immediate delivery and nearby fulfillment. Alongside steep crude backwardation, the US Gulf ultra-low-sulfur diesel (ULSD) crack against WTI remained above $100/barrel, a historic extreme confirming structural tightness in near-term products and physical supply.
Market prices had moved well above major banks' baseline scenarios. JPMorgan estimated that each month of interrupted strait flows would lift the oil-price level by $7–8/barrel; an extreme three-month paralysis could take the quarterly Brent average to around $114. Goldman Sachs saw $120 under a sustained blockade, but its baseline still assumed easing tensions and a fourth-quarter average back in the $80 range. At settlements near $91.8 for WTI and $95.9 for Brent, markets had already incorporated compensation for persistent shipping friction and passage restrictions.
Near-term trading centered on two tests:
- Upside catalyst: A substantive escalation, such as attacks on core energy-production facilities or tighter strait restrictions, would put Brent on a direct path to test $100;
- Downside release: If alternative logistics proved durably effective and daily transits recovered, war-risk premiums could unwind together.
The policy tone from core OPEC+ members on September 6 and whether the delayed September 10 EIA report sustained inventory draws would be the next two decisive real-world variables.


