As September's Fed meeting approaches, markets are repricing a possible hike. Whether Treasuries keep falling afterward depends not just on that increase but on subsequent hikes and how long rates remain high. Prices respond to differences between these new judgments and prior expectations.
On September 4, the 2-year Treasury yielded 4.37%, the 10-year 4.78%, and the effective federal funds rate (EFFR), a representative actual overnight borrowing rate in that market, was 3.63%. Futures had not fully priced September's hike, yet yield models suggested cash bonds might already include later increases. There is no contradiction: September action is uncertain, but two-year pricing can already include multiple hikes.
I. How much tightening is already priced?
Treasury yields are not entirely policy-rate forecasts. Long-bond investors bear price volatility and require extra return called the term premium. One decomposition separates expected future short rates from term premium. Short rates include overnight and similarly brief borrowing; expectations cover the subsequent period, not just the next meeting.
A second decomposition separates real yields from inflation compensation. Nominal yields do not deduct inflation; real yields account for purchasing power. Comparing ordinary Treasuries with inflation-protected securities whose principal adjusts with prices gives inflation compensation. It contains both expected inflation and compensation for uncertainty about inflation.
Both decompositions describe the same yield. Inflation-risk compensation belongs to risk compensation in the first and inflation compensation in the second; it cannot be added twice. Common measures relate as follows:
| Measure or method | Question answered | Relationship to other measures |
|---|---|---|
| Federal funds futures and FedWatch, CME's futures-based hike/cut probability tool | How much of September's decision is priced? | One-meeting focus cannot represent the complete two-year path |
| ACM: Adrian–Crump–Moench model, named after its authors and published by the New York Fed | How much yield reflects expected nominal short rates versus term premium? | Separates expectations and compensation without independently estimating inflation expectations |
| TIPS: Treasury Inflation-Protected Securities, and inflation compensation | How is nominal yield divided between real yield and inflation compensation? | Both retain risk and liquidity effects and are not pure expectations |
| DKW: D’Amico–Kim–Wei model, named after its authors, jointly analyzing nominal Treasuries and TIPS | How much comes from expected real short rates, expected inflation and risk compensation? | Links both decompositions within one model, with components summing to nominal yield |
| SEP: Summary of Economic Projections | What policy rates do officials consider appropriate for economic and inflation prospects? | An official policy-judgment reference, not another Treasury-yield component |
Futures and ACM indicate what markets expect; TIPS and DKW further explain yield content; SEP describes officials' preferred policy. Officials' economic judgments cannot be added to market decompositions.
September meeting: 25bp not fully priced
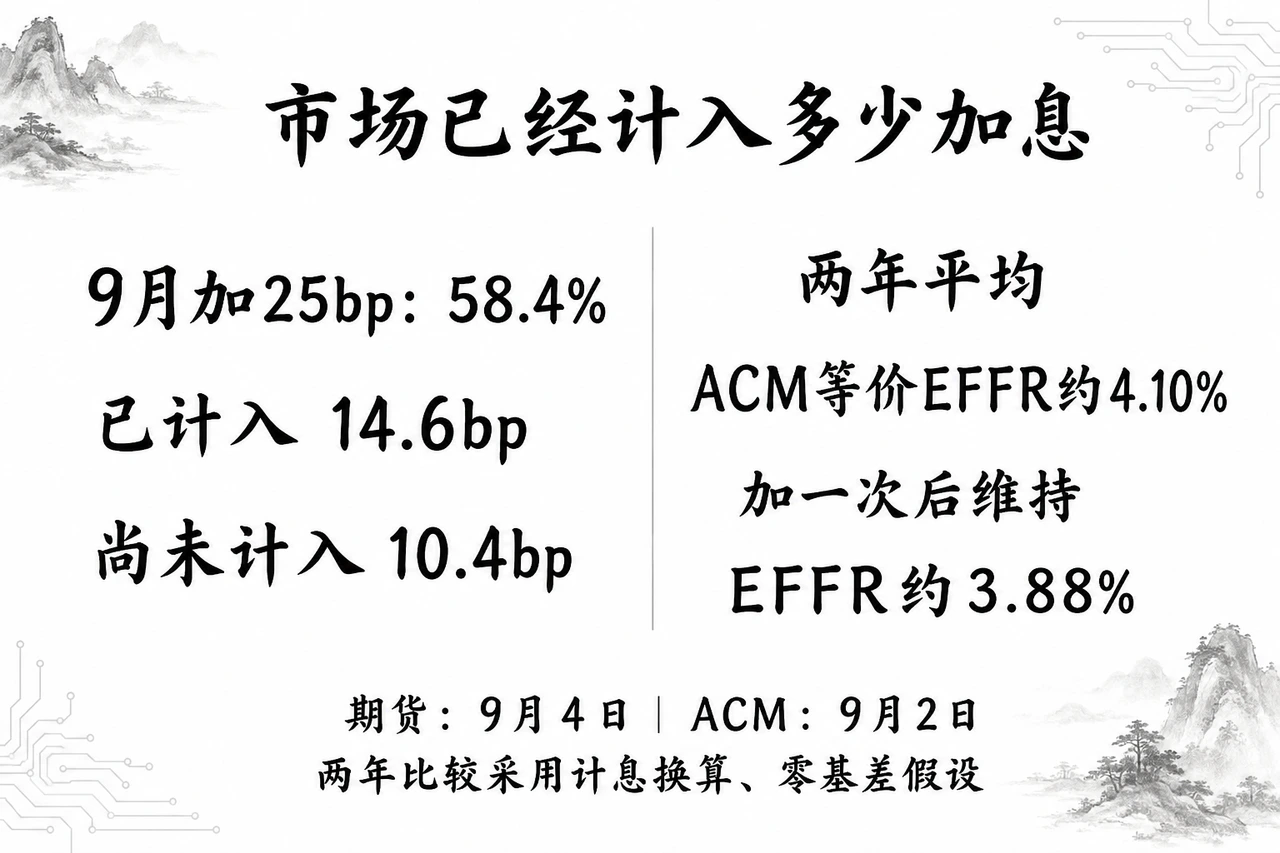
CME FedWatch data cited in September 4 closing reports gave a 58.4% implied chance of a 25bp hike. A basis point, bp, is one-hundredth of a percentage point, so 25bp equals 0.25 points. Implied probabilities are inferred from traded prices under model assumptions.
With only September hold and +25bp outcomes, the expected average increase is 25bp × 58.4% = 14.6bp. An actual 25bp hike therefore exceeds that expectation by 10.4bp, a hawkish surprise.
The 10.4bp only measures unpriced tightening at that meeting, not a target rise for 2-year yields. Bonds reflect many subsequent meetings; one-meeting probability cannot replace an entire rate path. Changed premeeting quotes require recalculation.
Next two years: average short rates already exceed the one-hike level
ACM uses Treasury prices across maturities to estimate nominal short-rate expectations and term premiums. The following data are September 2, before September 4 payrolls.
Fitted yields are model-derived from quotes, not direct transaction yields of individual bonds. The table consistently uses continuously compounded zero-coupon rates: zero-coupon bonds pay once at maturity, while continuous compounding assumes interest is continually added to principal to standardize calculations. These decompositions are estimates, not error-free consensus.
| Maturity | Fitted zero-coupon yield | Expected nominal short-rate component | Term premium |
|---|---|---|---|
| 1-year | 4.189% | 4.122% | 6.7bp |
| 2-year | 4.304% | 4.159% | 14.5bp |
| 5-year | 4.544% | 4.162% | 38.2bp |
| 10-year | 4.837% | 4.114% | 72.3bp |
For 2 years, expected nominal short rates of 4.159% plus 14.5bp, or 0.145 percentage points, produce approximately 4.304%. The 2-year chiefly reflects short-rate expectations. The 10-year term premium is 72.3bp; treating that compensation as expected tightening would overstate future policy rates.
Different maturities also suggest timing. The two-year average is 4.159%, first-year 4.122%; twice the former minus the latter gives a second-year average around 4.196%. Likewise years 3–5 average 4.165%, years 6–10 4.065%. The model implies a slight rise over one or two years, then gradual decline, with rates around 4% for an extended period rather than quickly returning to 3%.
Averages do not identify meeting decisions. A first year at 3% and second at 5% averages 4%, just like both years at 4%, despite wholly different paths. Both height and duration affect the average.
Comparing with EFFR requires two adjustments. First, interest convention: EFFR uses ACT/360, actual borrowing days over a 360-day year. Assuming daily interest enters the next day's principal, then converting to continuous compounding, makes it comparable to the table.
Second is the cross-market spread, called the basis here. Treasury short rates and federal funds rates can differ because of counterparties and supply-demand. Temporarily assuming zero basis, ACM's two-year expected component of 4.159% translates into EFFR held near 4.10% throughout two years. This comparison conversion is not a Fed commitment.
If September's target rises 25bp with EFFR's position within the range unchanged, current 3.63% becomes about 3.88%, around 22bp below the model-equivalent 4.10%. Even maintaining 3.88% for two full years falls short. Under these assumptions, further hikes remain possible, without specifying their number or timing.
September 2's model therefore exceeds a one-hike-then-two-year-hold path. It reflects two-year average expectations and cannot directly become September's meeting probability.
Real rates and inflation: high yields are not all policy expectations
ACM estimates nominal short rates without separating real rates and inflation. TIPS help: principal adjusts with CPI, a basket measure of consumer goods and services. Higher prices raise adjusted principal, reducing purchasing-power losses.
On September 4, 10-year nominal Treasuries yielded 4.78% and TIPS 2.43%, a 2.35-point difference called inflation compensation. Ordinary principal does not rise with prices, so yield must compensate. But the 2.35 points also include inflation risk and liquidity effects, not just expected inflation.
Connecting yields across maturities creates a yield curve. Treasury's daily real curve begins at 5 years without matching 2-year data. Fed staff's GSW curve estimates a complete curve from bond quotes. The following use matched-date, matched-maturity continuously compounded zero-coupon data for August 28:
| Maturity | Nominal yield | TIPS real yield | Inflation compensation |
|---|---|---|---|
| 2-year | 4.2659% | 2.1803% | 2.0856% |
| 10-year | 4.8031% | 2.4457% | 2.3574% |
TIPS protect against inflation but still fluctuate in price. Higher future real rates can reduce existing TIPS prices; required compensation is the real term premium. Nominal bonds also face unexpectedly high inflation eroding purchasing power: inflation risk premium. Expected inflation forecasts price increases; risk premium compensates for being wrong.
Liquidity means ease of trading. If selling requires a marked discount, investors generally demand higher yields. Thus the 2-year TIPS yield of 2.18% contains real-rate expectations, risk and liquidity compensation; its roughly 2.09% difference from ordinary Treasuries is likewise not pure inflation expectations.
DKW jointly uses nominal bonds, TIPS and other information to estimate real-rate expectations, inflation expectations and risk compensation under one assumption set. The August 31 10-year decomposition follows; annualized contributions indicate percentage points in the total yield:
| Component | Annualized contribution |
|---|---|
| Ten-year average expected future real short rate | 1.1527% |
| Ten-year average expected CPI inflation | 2.8007% |
| Real term premium | 0.7812% |
| Inflation risk premium | 0.1085% |
| Total fitted nominal yield | 4.8431% |
The first two sum to approximately 3.95% of expected nominal short rates; the latter two to about 89bp of term premium. Thus DKW subdivides each of ACM's expectations and compensation categories into two.
Estimates differ: August 31 ACM put 10-year nominal-rate expectations around 4.05% and term premium 76bp, about 10bp and 13bp different from DKW. Same date and maturity, different models allocate different amounts. Models distinguish policy expectations from risk compensation but cannot precisely infer a meeting's hike.
SEP: nominal cuts need not mean easing
Whether expected rates are reasonable also depends on officials' assessment of necessary rates. SEP projects growth and inflation conditional on each official's appropriate policy path. Subtracting subsequent expected inflation from year-end nominal rates approximates real policy rates. Higher real rates generally restrain borrowing, consumption and investment more: policy restrictiveness.
SEP uses PCE inflation. Both PCE and CPI measure consumer prices, but coverage and weights differ and cannot be mixed directly. Headline PCE includes food and energy; core excludes these volatile categories.
A 2016 Fed study approximated expected real policy rates by subtracting next-year median core PCE forecasts from current year-end median fed funds forecasts. A median is the middle ranked forecast, not unanimous agreement. BNY's 2025 analysis likewise discussed nominal cuts preventing disinflation from passively raising real rates.
As of September 7, the latest SEP remained June 17. Policy rates are year-end target midpoints; inflation is PCE growth from the prior Q4 to current Q4. Using published one-decimal medians and subtracting next-year inflation gives:
| Policy date | Nominal rate forecast | Next-year headline/core PCE forecast | Implied real policy rate: headline/core basis |
|---|---|---|---|
| End-2026 | 3.8% | 2027: 2.3% / 2.5% | About 1.5% / 1.3% |
| End-2027 | 3.6% | 2028: 2.0% / 2.1% | About 1.6% / 1.5% |
On headline PCE, end-2026's 3.8% minus 2027's 2.3% gives 1.5%; end-2027's 3.6% minus 2028's 2.0% gives 1.6%. Nominal rates fall while real rates rise because expected inflation falls faster.
Slower inflation makes the same nominal interest a heavier real burden. If inflation follows forecasts, the Fed can reduce nominal rates while restraining demand. Cuts do not necessarily imply easing.
Assessing restraint requires a neutral real rate, neither stimulating nor suppressing an economy without significant slack or overheating and with stable inflation. It must be modeled. A 1.5% policy real rate versus 1.0% neutral implies roughly 0.5 percentage points of restraint.
June SEP's long-run nominal median of 3.1% minus the 2% PCE target gives a 1.1% real reference. The New York Fed's August 27 HLW growth-and-inflation model estimated Q2 2026 neutral around 1.01%. Against 1.0%–1.1%, SEP's headline-PCE real rates of 1.5%–1.6% are 0.4–0.6 points higher, indicating restraint. Current neutral may differ from long-run neutral and models revise, so this is only a reference.
Comparing SEP and TIPS also requires matched horizons. SEP gives year-end rates; bonds reflect an entire holding period. A rate on one date cannot directly be subtracted from a two-year average.
For markets, subtract real term and liquidity premiums from TIPS to approach expected real short rates, or subtract separately estimated matched inflation from ACM nominal expectations. DKW estimates both internally. For the Fed, interpolate between SEP year-end points to obtain a period-average rate, then deduct matching inflation. Without this, the difference between 2-year TIPS at 2.18% and SEP's 1.5% cannot measure extra market-priced tightening.
Inflation definitions must match too: TIPS and DKW use CPI, SEP PCE. If expected CPI exceeds PCE by 0.3 points, CPI-based real rates are 0.3 points lower: 1.5% on PCE becomes about 1.2% on CPI. The 0.3-point difference is illustrative, showing conversion direction.
Available data cannot fully align both real-rate paths by date and horizon. Conditionally, if PCE inflation is 2.3% in each of two full future years, constant 3.88% EFFR implies about 1.58% real, while ACM-equivalent 4.10% implies 1.80%. Subtracting the same inflation leaves the approximately 22bp gap unchanged.
A September hike does not mean further Treasury losses. Bonds could rise if markets subsequently expect less tightening than before. Futures price 14.6bp of 25bp, leaving 10.4bp; September 2 ACM implies a two-year average funding rate around 4.10%, above a one-hike-then-hold 3.88%. The immediate decision can surprise hawkishly while two-year expectations fall. June SEP also shows nominal cuts preserving restraint if inflation falls. Post-hike bonds depend on subsequent expectation changes, not the hike alone; a rally is not guaranteed.
II. After one hike, where does the rate path go?
Bond direction requires comparison with premeeting pricing; greater policy restrictiveness requires comparing new rate and inflation forecasts with old ones. ACM's market path references the former, June SEP the latter.
Holding term premium and basis constant while changing policy paths isolates the effects of height and duration. Scenarios do not assign probabilities or calculate simultaneous risk-premium and liquidity changes.
SEP helps assess real-rate changes after nominal moves but is no committee commitment. Year-end points omit intrayear timing, and medians may come from different officials. A few year-end forecasts cannot alone value a 2-year bond.
Two-year cash Treasuries: fewer hikes or earlier cuts could lift prices
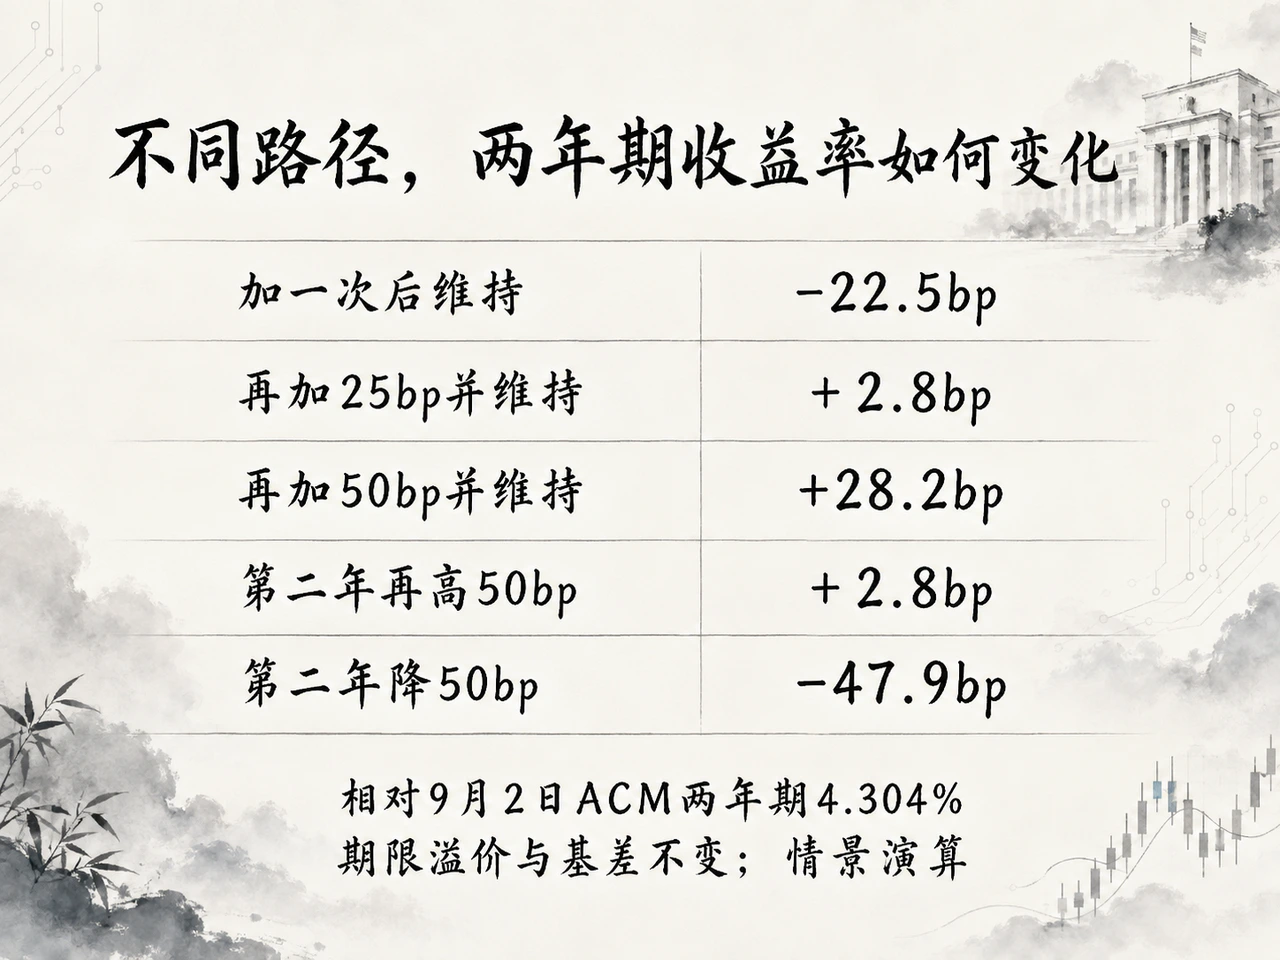
The reference is September 2 ACM's fitted 2-year zero-coupon yield, 4.304%. Scenarios set EFFR for two full future years, convert conventions, average and add a fixed 14.5bp term premium with zero Treasury/EFFR basis. Changes apply at hypothetical year starts rather than actual meetings. No probabilities are assigned.
| Two-year EFFR scenario | Year 1 | Year 2 | Corresponding 2-year model yield | Change from 4.304% |
|---|---|---|---|---|
| One September hike, then hold | 3.88% | 3.88% | 4.079% | -22.5bp |
| Another 25bp above the new level, then hold | 4.13% | 4.13% | 4.332% | +2.8bp |
| Another 50bp above the new level, then hold | 4.38% | 4.38% | 4.586% | +28.2bp |
| Hold in year 1; 50bp higher in year 2 | 3.88% | 4.38% | 4.332% | +2.8bp |
| Hold in year 1; cut 50bp in year 2 | 3.88% | 3.38% | 3.825% | -47.9bp |
In scenario one, EFFR stays 3.88% both years, equivalent to about 3.934% continuously compounded. Adding 14.5bp, or 0.145 points, gives 4.079%, 22.5bp below 4.304%. Despite a Fed hike, belief that no more are needed creates a below-prior-expectation path and room for lower 2-year yields. For the same bond, other things equal, lower yields mean higher prices.
The earlier roughly 22bp uses EFFR convention; 22.5bp here uses continuous compounding. They describe the same gap and cannot be added.
Conversely, another 25bp above 3.88% held two years yields about 2.8bp above baseline; another 50bp yields 28.2bp above. Higher subsequent expectations could still depress bonds.
Timing matters: another 25bp for two years and another 50bp delayed one year for one year produce almost identical averages and model yields. Prices reflect both rate height and duration.
These are ceteris-paribus comparisons, not targets for September 4 cash bonds or meeting day. On the same convention, if Treasury short rates average 10bp above EFFR, basis explains 10bp of the 22.5bp gap, leaving 12.5bp policy-related. If 10bp below, the gap widens to 32.5bp. Term-premium changes also alter results.
Nor can 22.5bp be added to the unpriced 10.4bp: the scenario's 3.88% already includes this hike. Fed funds futures settle on whole-month average EFFR. A midmonth change leaves earlier days at old rates, making the monthly-average move smaller than the postmeeting rate change; weight both rates by applicable days.
Meeting-day comparisons should use immediately preceding futures, overnight-index swaps (OIS) and cash prices. OIS exchanges fixed interest against interest formed from realized overnight rates over a period. Fixed quotes help observe expected overnight rates but also contain risk compensation.
Ten-year yields additionally reflect distant inflation and term premiums and need not match one- or two-year expectations. Stocks depend on why rates decline: less expected tightening with stable earnings can lift stocks and bonds together; recession and profit fears can lift bonds while stocks fall.
Subsequent policy: read rate and inflation forecasts together
September SEP updates official judgments. Each dot is an official's appropriate year-end rate. Higher dots only mean higher nominal forecasts; higher inflation forecasts may offset real tightening. Compare new year-end rates minus next-year inflation with June to assess the real change.
| September versus June judgment | Real policy meaning | Conditional implications for the path |
|---|---|---|
| Disinflation broadly realized; nominal rates subsequently fall | If inflation falls faster, real rates can hold or rise | One hike, pause and gradual cuts can still restrain demand |
| Inflation and nominal-rate forecasts both increase | Compare their adjustment sizes to determine real-rate change | Nominal increases may only partly offset inflation, not entirely add real tightening |
| Little inflation-forecast change, with higher or longer-held nominal rates | Higher real rates or longer persistence | Stronger case for further hikes or later cuts; unexpected changes pressure bonds |
A September hike to 3.75%–4.00% gives a 3.875% midpoint. Subtracting June SEP's 2027 headline PCE forecast of 2.3% gives about 1.6% real, or 1.4% using core, broadly near June's implied levels. But calendar-2027 inflation differs from the twelve months after September; this alone cannot establish one hike is enough. Here midpoint is used, while market scenarios use EFFR, expected to differ by about 0.5bp.
Less forward guidance requires combining projections and actual decisions to judge conditions for hikes, holds or cuts. No next-hike commitment does not mean tightening is finished; higher nominal forecasts do not mean equal real tightening. Inflation's evolution and the real rate officials deem necessary remain central.
Historical reference: one hike, two successive market reactions
On June 15, 2022, the Fed raised 75bp. The statement lifted expected short rates and Treasury yields, but the press conference reversed direction. San Francisco Fed event data separately record 30-minute statement and 70-minute press-conference windows. These are intrawindow moves, not daily closes.
MP1 estimates the current-policy surprise from futures. Positive is tighter than priced, negative looser. The actual hike was 75bp; MP1 +4.50bp measures the unexpected part. These are different concepts.
| Indicator change, bp | Statement window | Press-conference window |
|---|---|---|
| Current-policy surprise MP1 | +4.50 | -0.50 |
| 1-year OIS | +7.60 | -19.35 |
| 2-year OIS | +5.90 | -20.00 |
| 2-year Treasury yield | +5.05 | -18.26 |
| 10-year Treasury yield | +1.54 | -9.96 |
| 10-year TIPS real yield | +3.25 | -14.75 |
Powell called 75bp unusually large and said the next meeting could deliver 50bp or 75bp. During the press conference, 2-year OIS fell 20bp, 2-year Treasuries 18.26bp and the broad S&P 500 rose approximately 1.44%. The 75bp hike was settled, yet markets reduced one- to two-year rate expectations as later tightening looked less severe than feared.
Ten-year nominal yields fell 9.96bp and TIPS real yields 14.75bp. Because real yields fell more, nominal-minus-real inflation compensation increased approximately 4.79bp. The bond rally therefore cannot simply reflect lower expected inflation; risk compensation and liquidity also affect both instruments.
September is similar: after a hike, markets must judge what follows. Current-model comparisons put one hike then hold below the priced two-year average, allowing lower yields and higher bonds even on hike day. Information implying higher rates or longer persistence would still pressure bonds. Direction depends on changed subsequent expectations, not the word hike.


