On September 4, New York WTI settled at $91.48 a barrel and Brent at $96.28. WTI gained about 9.7% for the week and Brent a reported 7.6%, their strongest week since mid-July. Brent was more than 30% above its roughly $72 level before the crisis began in late February.
Renewed maritime conflict on September 1, tight product inventories and high transport costs supported prompt oil prices. New tanker attacks occurred over the weekend and OPEC+ left October quotas unchanged. Those later developments were not reflected in Friday settlements and would influence the new week. The curve remained backwardated, with disagreement centered on how long supply recovery would take.
Prompt premiums reflect immediate supply pressure
On September 4, WTI rose $0.18 and Brent $0.76 from the prior day. WTI gained about 9.7% from its August 28 settlement of $83.40, mostly after maritime conflict resumed during the week.
November Brent was $96.28, December $92.32, January 2027 $89.15 and February $86.65; 2028 contracts traded around $75. The prompt month exceeded January 2027 by about $7, a pronounced backwardation.
Buyers were paying more for near-term delivery, suggesting greater current than future supply pressure. Lower deferred prices also fit expectations of gradual recovery, but a futures curve is not a definite forecast of future spot prices and does not guarantee easing conflict.
By early September 7, Beijing time, electronic quotes were broadly unchanged from Friday settlements, insufficient to establish the full response to weekend events.
Crude stocks fall, while products are tighter
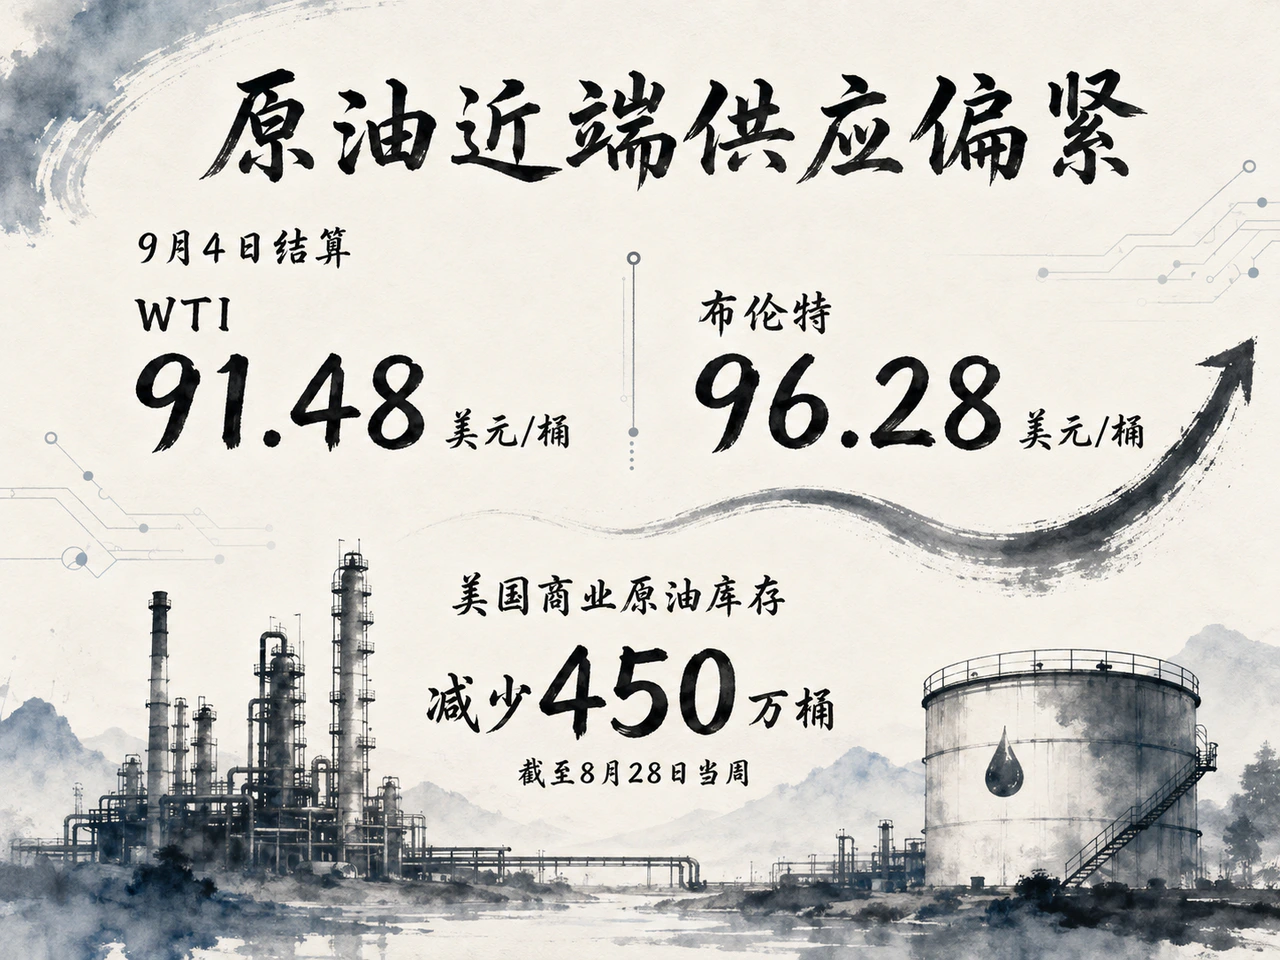
The EIA's September 2 report showed commercial crude down 4.5 million barrels to 424.5 million in the week ended August 28, still about 1% above the five-year average. Cushing rose 100,000 barrels to 22.5 million. Crude stocks were declining but not yet markedly below normal.
Refinery utilization reached 98%, processing 17.5 million barrels a day, up 102,000. Crude imports rose 612,000 barrels a day to 6.8 million. High utilization and increased imports reflected refinery feedstock demand.
Product supply was tighter. Gasoline stocks fell 1.2 million barrels to 6% below the five-year average. Distillates rose 800,000 but remained 14% below average. GasBuddy put September 3 U.S. diesel retail prices at $5.82 a gallon, above June 2022's record, and gasoline around $4.14, the highest for that time of September.
The U.S. East Coast ULSD crack spread, diesel's price relative to crude cost, briefly exceeded $100 a barrel, showing product tightness unresolved despite high refinery loads. Ukrainian drone attacks on Russian refineries added diesel uncertainty.
OPEC+ holds quotas as shipping still constrains effective supply
Seven core OPEC+ countries decided September 6 to hold existing October quotas rather than continue monthly increases. September's previously approved 188,000-barrel-a-day increase was the final step reversing 2023's voluntary 1.65 million-barrel-a-day cut. Their combined October required output was about 31.01 million barrels a day, including Saudi Arabia 10.478 million and Russia 9.949 million.
Quotas are not deliveries. Strait disruption prevented some producers from reaching buyers. Third-party estimates put Iranian August crude loadings around 220,000-255,000 barrels a day, below roughly 2 million in March and 740,000 in July.
OPEC+ extended compensation for overproduction through end-2026, with 2027 quota and capacity reviews to follow. U.S. supply showed no clear expansion either: oil rigs rose two to 449 in the week ended September 4. Rigs indicate future activity, but short-term count changes are not direct output changes.
Transport and insurance continue raising delivered costs
On September 4, the dollar index closed up 0.16% at 99.16; the 10-year Treasury yield rose 1 basis point to 4.78% on a consistent closing basis; gold fell 1.38%. Oil still advanced, indicating stronger supply-risk effects than tightening financial pressure. Sustained high oil could in turn feed inflation through costs and expectations.
On September 1, two tankers were attacked successively offshore Oman, including a Saudi Aramco crude tanker and a Liberian-flagged supertanker. Brent rose over 4% above $90, and the U.S. subsequently struck Revolutionary Guard targets. The sides clashed again on September 5: the U.S. said it disabled or destroyed three Iran-linked tankers; the Guard claimed attacks on six vessels. Iran's claimed results lacked independent confirmation, and the clash occurred after Friday's close.
Transit had not stopped entirely, but third-party tracking showed a seven-day average of only about four vessels a day, against roughly 90-110 before the crisis. Estimates put 36 million barrels of floating crude storage on 29 tankers inside the strait, with much Iranian capacity stranded. Missing signals and other tracking limits mean these figures should be understood on the institutions' specific statistical bases.
In early September, Middle East Gulf-to-Singapore VLCC freight reached WS 675, implying daily earnings around $280,000. One-year time charters were about $130,000 a day, up $10,000 from the previous week. War-risk premiums reached roughly 1.5% of insured value, which industry calculations for supertankers suggested could add about $8 a barrel to delivered costs. Vessel value, cargo size and voyage affect conversion, so the estimate cannot be applied to every crude transaction.
Available Middle Eastern tonnage over the next 30 days was estimated around 80 vessels. Whether subsequent fixtures lower freight and insurance rates would indicate whether transport bottlenecks were easing.
Whether oil stays high depends on the pace of supply recovery
October WTI implied volatility was around 46%, above realized volatility near 37%. OVX was about 45, below April's peak above 60. Options still demanded risk compensation but had not returned to earlier crisis extremes. This did not rule out loss of control; it showed current volatility pricing below the crisis peak.
The IEA's August report raised the global Q3 2026 supply deficit to 1.8 million barrels a day. The EIA's August Short-Term Energy Outlook estimated a full-year deficit around 1.9 million and, assuming strait flows gradually resumed from September, a 2027 surplus around 4.8 million. The figures refer to different periods, and the surplus forecast has an explicit condition.
Delayed transit recovery, falling inventories and high freight and insurance would support prompt oil; improved deliveries could quickly compress premiums. The September 9 EIA outlook update and the inventory report delayed by Labor Day to September 10 would provide near-term tests. The October 4 OPEC+ meeting would be the next production-policy event.


