During Labor Day, Brent settled higher at $97.31 a barrel as supply constraints continued to dominate short-term pricing. Reciprocal US–Iran strikes involving tankers over the weekend reduced commercial-vessel traffic through Hormuz to its lowest since May, while OPEC+ left October production policy unchanged. With transport bottlenecks unresolved and US product inventories low, the market still had to pay a premium for uncertainty over near-term supply.
On Friday, September 4, front-month WTI had settled at $91.48 a barrel, up $0.18 from the previous session, and Brent at $96.28, up $0.76. Daily gains were modest, but on Reuters' comparable-contract basis Brent rose approximately 7.6% for the week and WTI nearly 10%, their strongest weekly performance since mid-July. The holiday rally extended this supply narrative and cannot yet be read as a marked improvement in demand.
Holiday Trading: Brent Rises Further; WTI Has No New Official Settlement
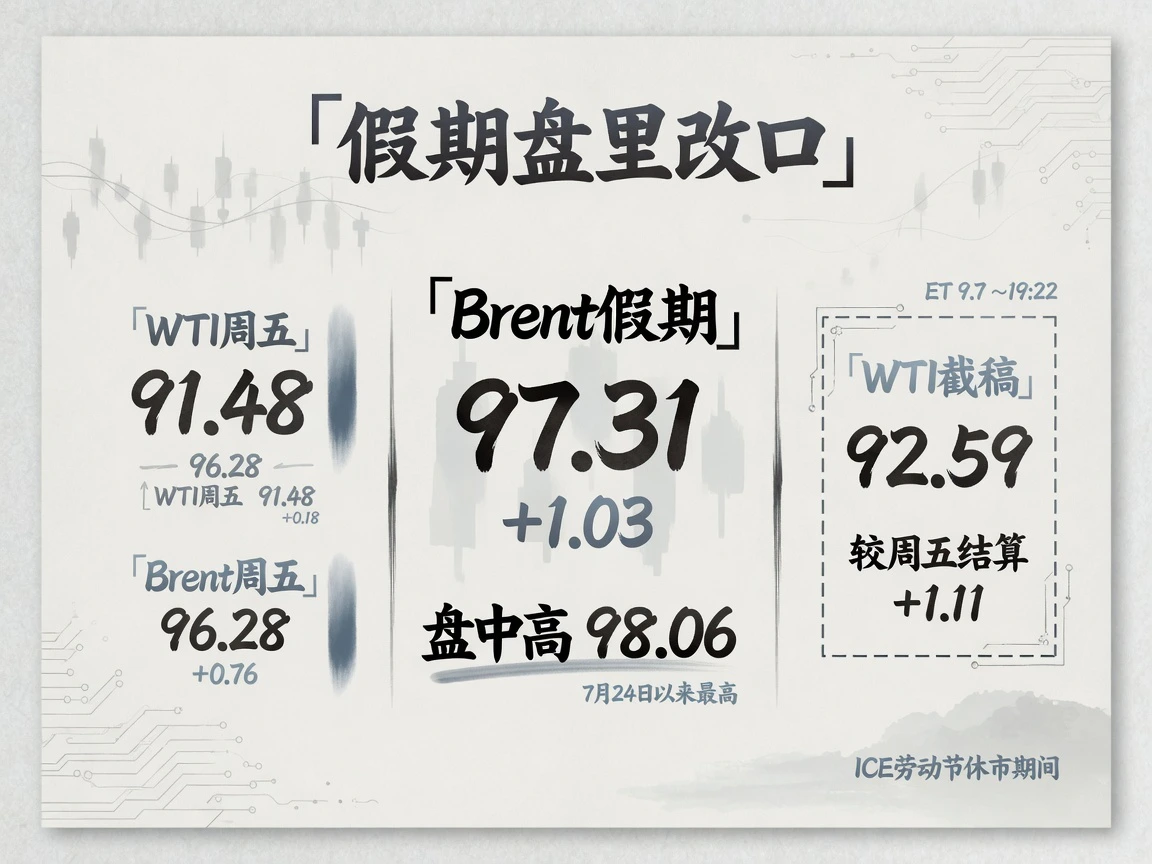
Friday's moderate gains followed a substantial weekly rise, suggesting supply risks from earlier military conflict were already partly priced. Further weekend shipping disruption kept that risk reflected in holiday trading.
During Monday's US Labor Day holiday, ICE settled about an hour early. Brent rose $1.03 to $97.31 and reached an intraday high of $98.06, the highest since July 24. NYMEX crude had no official settlement that day. Public quotations put front-month WTI near $92.59 around 19:22 US Eastern time on September 7, approximately $1.11 above Friday's settlement. This was a holiday quote at a specific time and cannot replace the next full session's official settlement.
Stronger front-month prices reflect concern over immediate supply, but price gains alone cannot establish the precise premium over deferred contracts. The gap between current prices and institutional quarterly or annual average forecasts likewise is not a futures calendar spread.
US Supply and Demand: Refineries Near Full Capacity but Product Inventories Remain Low

The latest EIA weekly report was released September 2 for the week ended August 28; Labor Day delayed the next release to September 10. Commercial crude stocks fell 4.45 million barrels to 424.5 million, still approximately 1% above the five-year seasonal average. Cushing rose 80,000 barrels to 22.51 million. Aggregate crude inventories did not indicate broad scarcity; pressure was more concentrated downstream. Gasoline fell 1.17 million barrels to about 6% below its five-year average. Distillates rose 800,000 barrels but remained around 14% below average.
Refinery throughput reached 17.5 million bpd, up 102,000 bpd, at approximately 98% utilization. Crude imports rose 612,000 bpd to 6.77 million bpd, exports also increased, and domestic output was broadly steady near 13.86 million bpd. The Strategic Petroleum Reserve fell 3.12 million barrels to 286.6 million, adding supply. With refineries near full load, there is limited room to raise processing further to fill product shortages.
EIA's average retail highway diesel price for the week through August 31 was $5.599 a gallon. Friday reports by Reuters and others describing record diesel retail prices used different timing and definitions from EIA's weekly average and cannot be compared directly. Low product stocks alongside high refinery utilization point to upward pressure on refining margins and retail prices, rather than US crude inventories nearing exhaustion.
Production Policy: OPEC+ Holds Targets; Actual Exports Remain Constrained by Transport
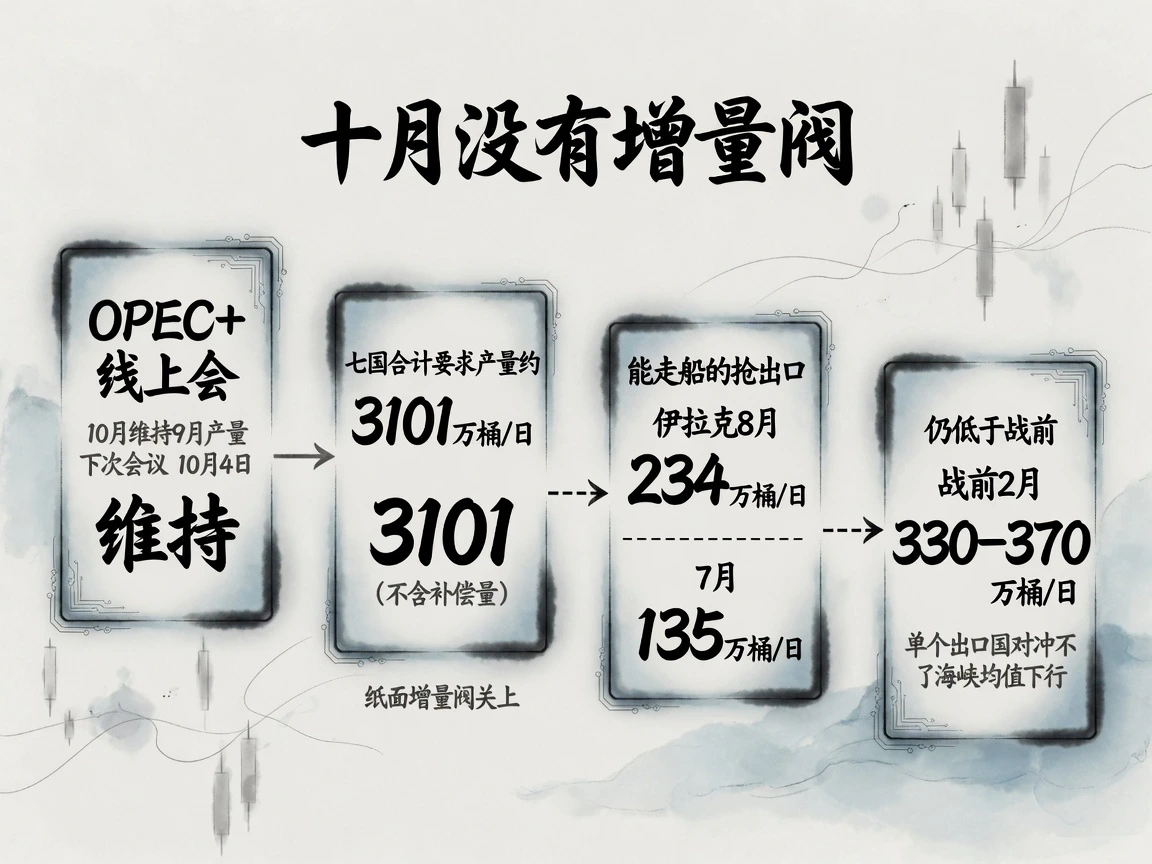
At an online meeting on September 6, seven OPEC+ voluntary-cut countries decided to keep October required production unchanged from September. The next meeting is October 4. Participants were Saudi Arabia, Russia, Iraq, Kuwait, Algeria, Kazakhstan and Oman. Media reproductions of the communiqué's annex put their combined required output near 31.01 million bpd, excluding compensation.
The seven had gradually restored their 2023 voluntary cuts over several months, so holding October targets does not mean a renewed cut. Yet with shipping through the strait disrupted, higher nominal quotas alone cannot increase deliveries. Rystad Energy's head of geopolitical analysis, Leon, told media there was a clear gap between OPEC+ quota changes and physical supply. If shipping recovers and constrained capacity returns to exports, the market could again face excess supply.
Iraq's export recovery shows that passage conditions differ. Reuters cited Iraqi officials as putting August exports near 2.34 million bpd, above July's 1.35 million. Vortexa and Kpler provisionally estimated roughly 2.30 million and 2.17 million bpd, respectively, still below prewar February's approximately 3.30 million–3.70 million. Iraq sustained shipments through larger discounts, transfers near Oman and fleets with partial passage authorization, but one exporter's recovery was insufficient to offset falling overall strait traffic.
Shipping Risk: Visible Traffic Remains Low; Total Supply Losses Are Hard to Quantify

Reuters cited Kpler data showing approximately 10 commercial vessels a day transiting Hormuz over the preceding 10 days, the lowest since May. Only four visible passages occurred on Thursday, below the then 10-day average near 15; publicly relayed data put Saturday at roughly two and Sunday six. The strait was not completely closed, but visible traffic was low.
Before the war, the route carried approximately one-fifth of global seaborne crude. EIA data showed oil flows falling to roughly 4.9 million bpd in the second quarter of 2026, far below 21.6 million in the fourth quarter of 2025. Vessel counts vary by type and cargo and cannot directly equal oil volumes; VLCC movements are more informative. One tracking report said no VLCC had been seen leaving the strait since the previous Wednesday.
Reciprocal weekend attacks increased commercial tanker risk. The US said it struck three Iranian tankers, while Iran said it acted against tankers using unauthorized routes. Maritime intelligence providers argued that commercial tankers were becoming instruments of reciprocal economic pressure, further blurring transport and military confrontation. Iranian officials signaled a forthcoming restricted area outside the strait. UAE adviser Gargash said alternative export routes were being built to reduce energy exports' exposure to the war. The Financial Times cited sources as saying Saudi Aramco's Jizan refinery was attacked on Monday. Damage was still being assessed and did not establish the scale of any shutdown.
Institutional estimates of price upside are conditional. Goldman Sachs sees potential for $120 oil if shipping attacks escalate further, or a retreat toward $80 if regional exports normalize. JPMorgan estimates that each additional month of disruption could add approximately $7–$8 to Brent, with a three-month interruption potentially taking the monthly average to $114. These are scenarios, not a certain path. Changes in war-risk insurance and tanker rates also do not yet support a definitive estimate of total transport costs.
Price Outlook: Near-Term Supply Premium Coexists with Medium-Term Recovery Expectations

On September 4, the dollar index closed at 99.16, up 0.16%; the 10-year Treasury yield was 4.78%, up 1.0 basis point close to close on the Treasury's end-of-day par curve; and gold was $4,429.80, down 1.38%. Oil rose despite a firmer dollar and slightly higher nominal rates, indicating that supply support outweighed financial constraints that day.
Near-term prices mainly reflect lower strait flows, tight US product inventories and no further October OPEC+ target increase. Institutional medium-term average forecasts still assume gradual shipping recovery. With reopening slower than previously assumed, Citi raised its third-quarter 2026 Brent average forecast from $80 to $86, while keeping its fourth-quarter forecast at $70 and 2027 at $65.
The gap of more than $10 between prices near $97 and the $86 third-quarter average forecast reflects different near-term premiums and later recovery assumptions. They cover different time windows; the gap cannot directly describe the futures curve, and today's price alone does not invalidate a quarterly average forecast.
The gains in shortened Labor Day trading still need confirmation during a full US session, and WTI awaits a new comparable settlement. The September 9 EIA Short-Term Energy Outlook, September 10 inventory report and whether Hormuz traffic stabilizes will help assess the durability of prices near $97. Slow logistical recovery and persistently low product stocks would support prompt prices; improved passage and exports would put the supply premium under pressure.


