On September 9, 2026, Brent returned above $100 a barrel, Treasury yields rose across maturities and major US stock indices fell. Energy and interest rates applied simultaneous pressure: the former squeezed profits and household purchasing power, while the latter raised financing costs and the hurdle for equity valuations. Higher yields nevertheless attracted Treasury buyers, and product developments supported some technology shares.
Markets diverged. Gold rose with a softer dollar, energy stocks gained against the market, and small caps fell more than large technology stocks. Chinese price data and US mortgage applications illustrated the same tension: rising costs alongside constrained final demand. Market prices in this review run through the September 9 US close, with news through 07:32 Beijing time on September 10.
Treasury yields rise; auction demand tempers selling
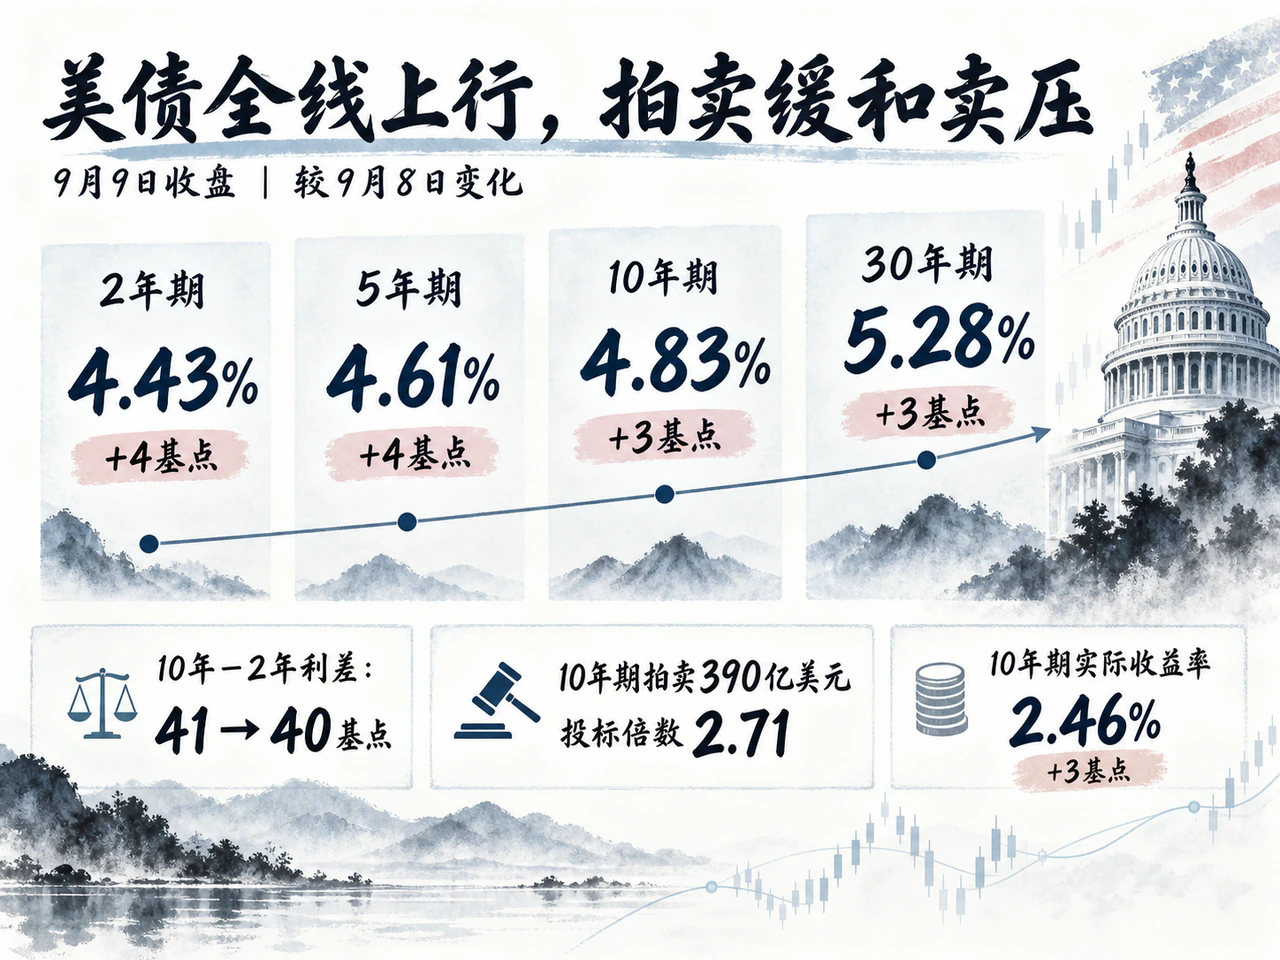
On the Treasury's comparable daily closing curve, yields rose at every maturity on September 9, slightly more at the short and intermediate portions.
| Maturity | Yield | Change from September 8 |
|---|---|---|
| 2-year | 4.43% | +4 basis points |
| 5-year | 4.61% | +4 basis points |
| 10-year | 4.83% | +3 basis points |
| 30-year | 5.28% | +3 basis points |
The 10-year/two-year spread narrowed from 41 to 40 basis points, a slight flattening. Short-end pressure aligned with changing policy expectations. Reuters reported after the September 9 close that fed funds futures implied about a 60% chance of a hike the following week, yet 65 of 93 economists in its poll expected no change. Market pricing and economists' forecasts remained notably different.
The 10-year sector also reflected Treasury supply and demand. Treasury announced plans to buy back up to $6 billion of debt with 10–20 years remaining on September 10. Mischler Financial's Tom di Galoma told Reuters some investors had expected more, and disappointment increased selling pressure. Such buybacks chiefly improve older bonds' liquidity; fiscal financing needs still determine long-term supply.
The subsequent $39 billion 10-year auction drew strong demand. Its high yield of 4.834% was more than 1 basis point below pre-auction trading, and the 2.71 bid-to-cover ratio was the highest since 2019. Reuters said the auction pulled yields off intraday highs. Di Galoma suggested some buying might also relate to the next day's older-bond buyback. Higher yields still attracted capital, but those purchases did not reverse the day's upward yield move.
The 10-year adjustment mainly reflected higher real rates. Treasury's 10-year real yield rose 3 basis points to 2.46%, matching the nominal increase. Their simple difference remained around 2.37%, broadly unchanged. With this spread, jointly influenced by inflation expectations, risk and liquidity, stable, the rise in real financing costs stood out.
Over longer windows, investors continued balancing yield and duration risk. Reuters cited LSEG Lipper data showing $12.2 billion into short-term Treasury ETFs and about $5.7 billion into intermediate bond ETFs over the 20 trading days through September 8. BNY research that day said US hyperscale technology companies had issued $157 billion in dollar bonds this year, exceeding 2025's $93 billion. Ultra-long corporate supply was competing with Treasuries for allocations.
Higher benchmarks increase dollar credit issuance and refinancing costs even if spreads are unchanged. On September 9, Duration Finance cited announcements that Sun Hung Kai & Co.'s dollar bonds due September 7 were fully redeemed, while Lenovo planned to redeem the remaining $29.675 million principal of convertible bonds on September 16.
Costs push prices higher while demand recovery remains uneven
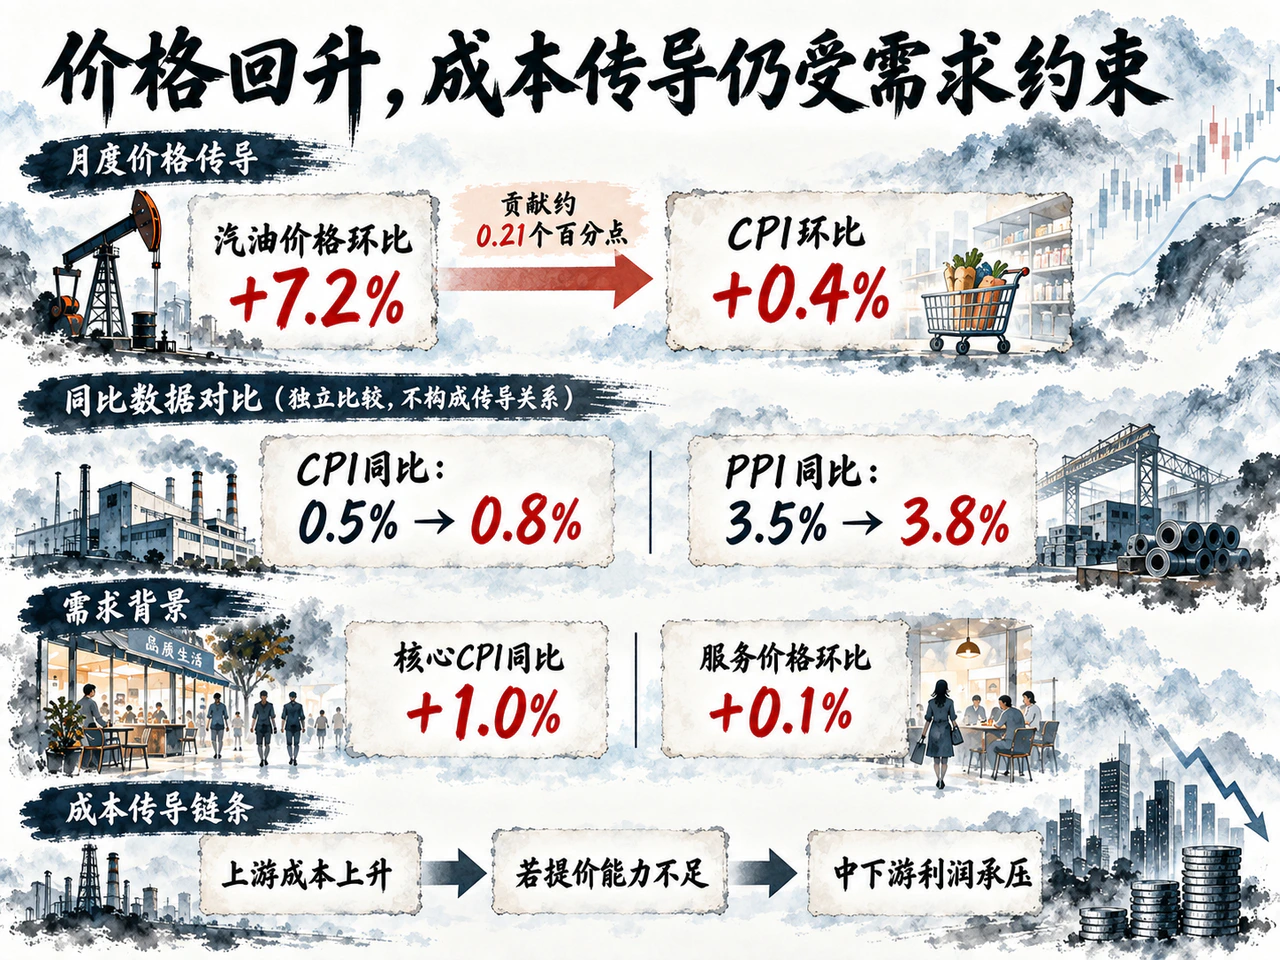
China's August price data showed clear cost-push features. The National Bureau of Statistics reported September 9 that CPI rose 0.8% year on year, above July's 0.5%; PPI rose 3.8%, above July's 3.5% and the expected 3.6%. Both increased 0.4% month on month.
Energy was the main driver of faster annual CPI inflation. Its contribution rose about 0.24 percentage points from the previous month, against a 0.3-percentage-point increase in overall annual CPI. Gasoline prices rose 7.2% month on month, contributing about 0.21 percentage points, more than half the monthly CPI increase. Gold jewelry rose 7.6%, contributing about 0.04 percentage points.
Demand improvement was milder. Core CPI excluding food and energy rose 1.0% year on year versus 0.9% previously, but monthly growth slowed from 0.3% to 0.1%. Services prices rose 0.1% month on month, 0.3 percentage points slower than the previous month. Producer categories also diverged: electronic-circuit manufacturing prices rose 3.5%, supported by compute demand, while autos, building materials and pharmaceuticals remained downward contributors.
Price increases had not spread evenly to final customers. Higher upstream costs could first squeeze margins at midstream and downstream firms without pricing power. Everbright Securities warned that imported disturbances could slow disinflation. Ding Meng, chief economist at China CITIC Bank International, argued that core inflation remained relatively low and a sustained rise required an actual consumption recovery. Persistent costs and the ability of final demand to absorb them would jointly determine subsequent prices.
US housing finance already showed rate constraints. Reuters on September 9 cited Mortgage Bankers Association data for the week ended September 4: the average 30-year fixed mortgage rate rose 6 basis points to 6.85%, the highest since June 2025. Total applications fell 2.7%, with refinancing down 6.2%. Higher rates increased new buyers' monthly payments and reduced existing borrowers' opportunities to improve cash flow through refinancing.
August US PPI and CPI were scheduled for 20:30 Beijing time on September 10 and 11 respectively, important tests before the following week's rate meeting. If price rises were mainly in energy, policy would require greater attention to the supply shock's drag on demand. Simultaneous strengthening in core goods and services would increase pressure for further tightening.
Oil and gold rise together amid supply risks and rate constraints
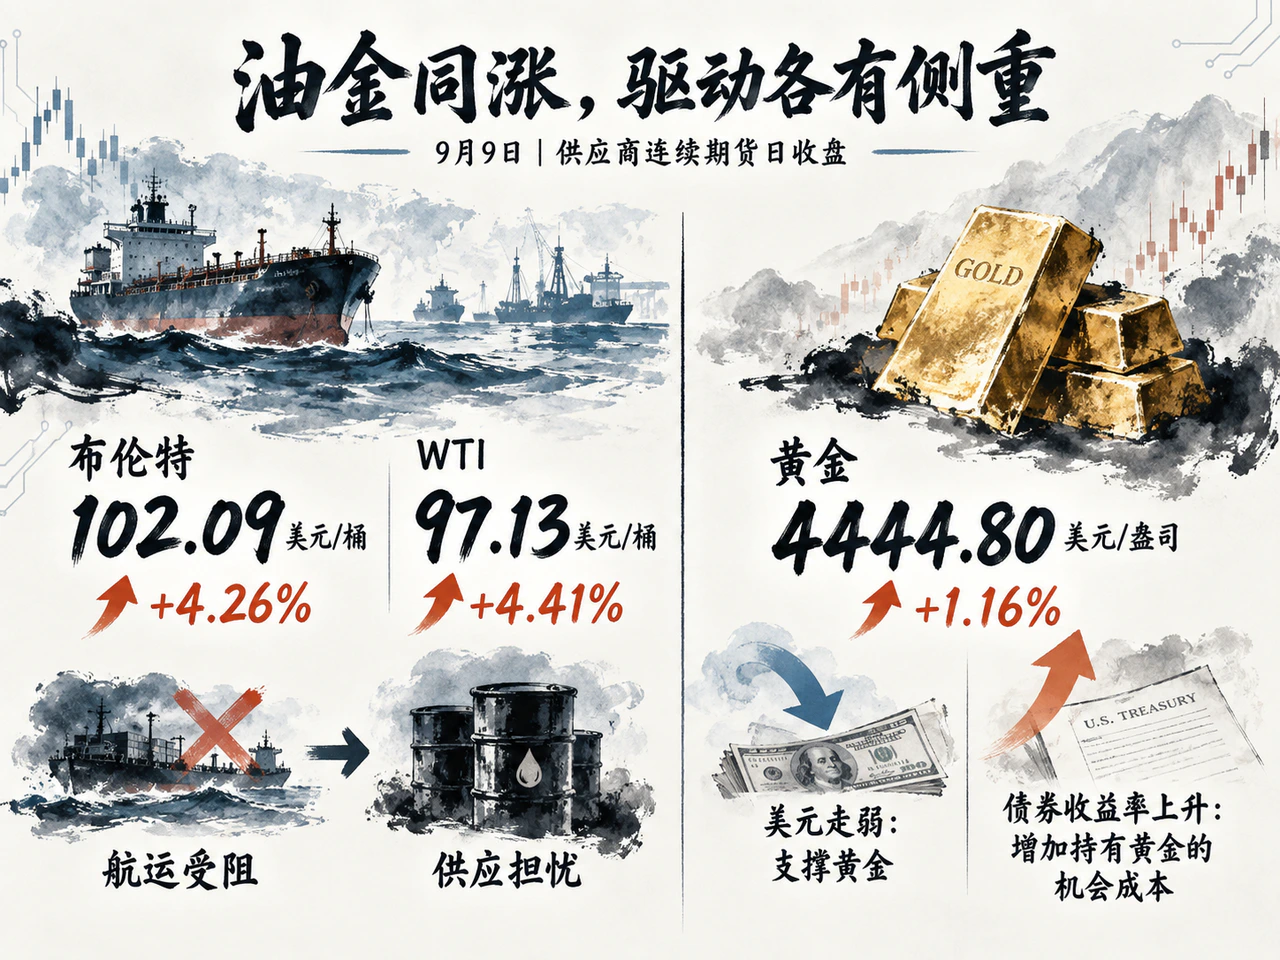
On one provider's consistent daily continuous-futures closing basis, Brent rose 4.26% to $102.09 a barrel, WTI 4.41% to $97.13, and gold 1.16% to $4444.80 an ounce. These provider closes differ from exchange settlements. The dollar index on the same basis fell 0.06% to 98.783.
Middle East shipping tensions continued shaping supply expectations. The EIA's September 9 Short-Term Energy Outlook estimated that global oil inventories had fallen about 400 million barrels since the start of the year and projected draws through year-end. The inventory buffer against disruption was weakening, while persistent energy-price rises made inflation risks harder to dissipate.
The EIA still projected average Brent spot prices around $90 in the second half of 2026, conditional on gradual restoration of oil flows and alternative transport. Model inputs ended September 3 and excluded later events; the speed of transport recovery would affect that half-year forecast. FXTM research head Lukman Otunuga said a persistent energy shock could keep price pressure high and complicate central-bank choices.
Gold faced both dollar and rate effects. High Ridge Futures' David Meger viewed recent dollar weakness as supportive. StoneX analyst Rhona O’Connell cautioned that energy inflation from shipping and supply-chain disruption could also raise bond yields. A softer dollar and value-preservation demand supported gold, while higher yields increased its holding opportunity cost.
US equities fall broadly; technology launches support selected stocks
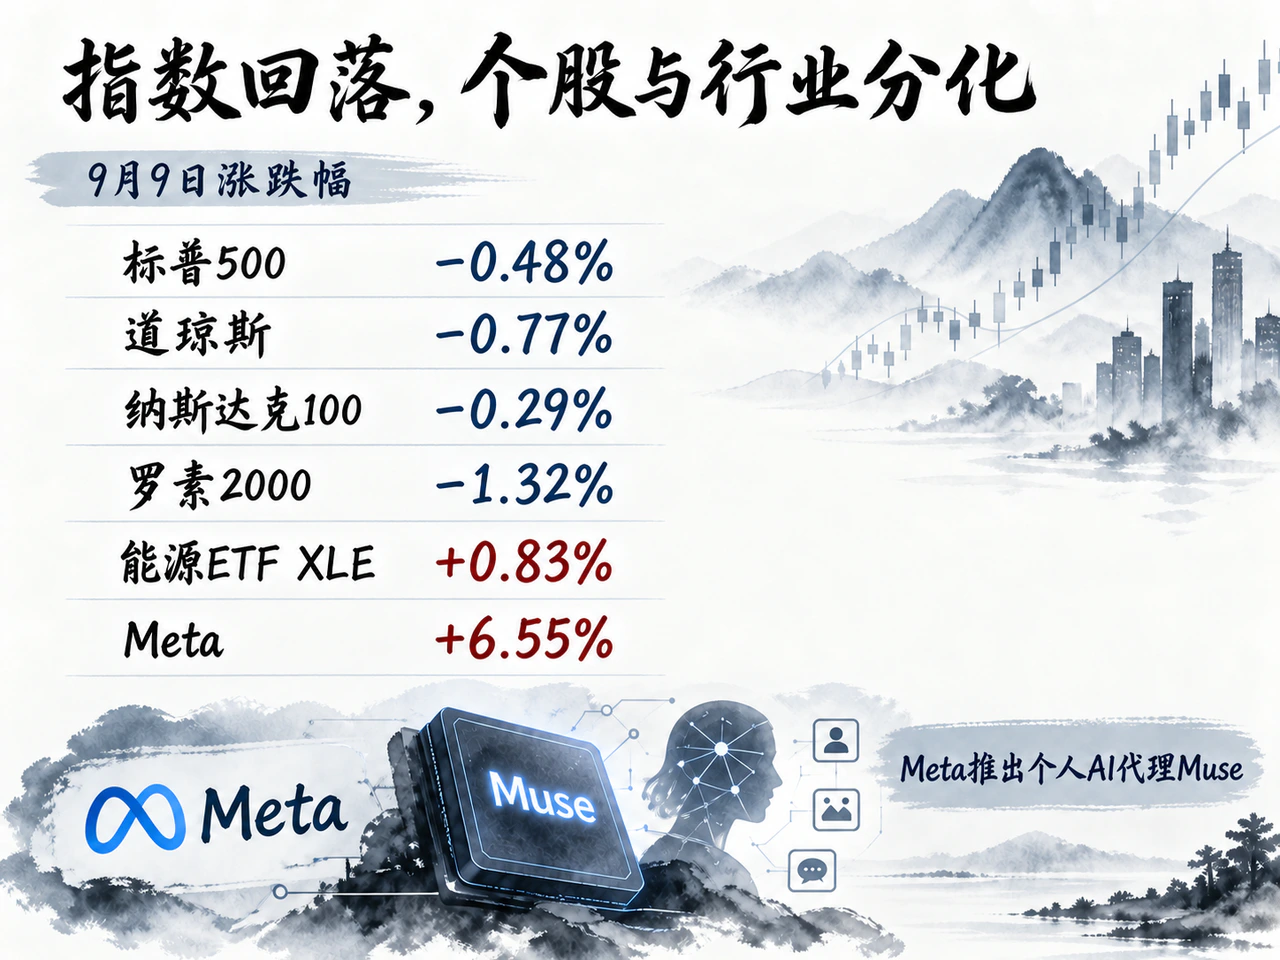
On September 9, the S&P 500 fell 0.48% to 7636.36, the Dow 0.77% to 52380.66, and Nasdaq 100 0.29% to 29421.55. The Russell 2000 declined 1.32% to 2921.23, underperforming larger stocks.
Rising oil and rates produced sector divergence. Energy ETF XLE rose 0.83%, technology ETF XLK was flat and financial ETF XLF fell 0.42%. Higher oil supported producers' profit expectations but raised costs for consumers of oil. VIX rose from 15.72 to 16.46, reinforcing the indices' signal of weaker risk appetite.
Meta was a prominent exception. A Motley Fool report carried by Yahoo Finance said shares rose 6.55% to $653.69 on volume about 98% above the three-month average. Its new personal AI agent Muse, able to handle online shopping, flight bookings and schedules, prompted reassessment of how heavy AI spending could generate revenue. Alphabet fell 2.28% and Snap 2.21%, however, showing optimism had not spread across digital advertising. Paid adoption and capital returns still required operating evidence.
Apple also launched its first foldable iPhone Duo on September 9, starting at $1999 in the United States, with preorders planned for October 16 and initial-market availability October 23. The company said it used the A20 Pro chip and a 2-nanometer process, providing demand signals for foldable displays, precision components and high-end chips. Sales and production would determine transmission into supplier orders and profits.
Asian markets had already diverged. AP reported September 9 declines of 0.2% for the Nikkei 225 and 0.3% for the Hang Seng, while Korea's KOSPI rose 1.4%; those closes preceded the same day's US close. Persistent high oil would increase Japanese and Korean import costs and squeeze downstream margins, while new technology products and AI applications could support selected supply chains.
US–Canada trade measures change; duration attracts greater attention
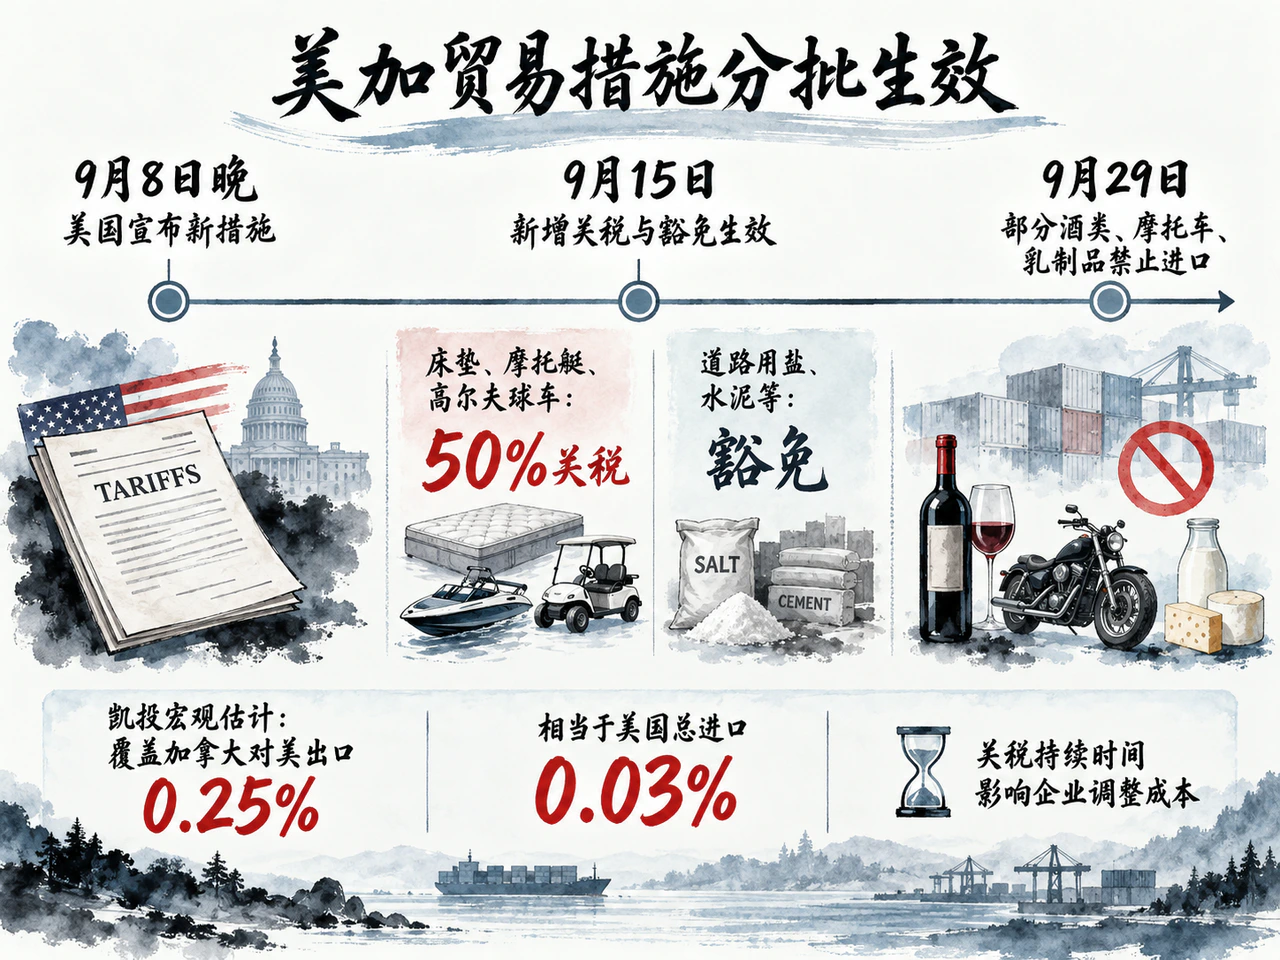
Beyond energy and financing costs, companies faced uncertain trade rules. The United States announced new Canada measures on the evening of September 8. The Canadian Press said some alcohol, motorcycles and dairy products would be banned from September 29, with new tariffs and exemptions effective September 15. Deutsche Welle, citing the White House, said mattresses, personal watercraft and golf carts were added to the 50% tariff list, while road salt and cement received exemptions.
The direct aggregate impact might be limited. The Canadian Press cited BMO chief economist Doug Porter saying the substitutions produced no additional net effect on Canada's economy. Capital Economics' Stephen Brown estimated that new bans covered 0.25% of Canadian exports to the US, equivalent to 0.03% of total US imports.
Brown was more concerned that escalation increased the risk of the 50% tariff lasting beyond the original assumption of roughly one month. Companies incur costs whether they raise prices, absorb tariffs or change suppliers. The longer tariffs persist, the harder it becomes to postpone order and capacity adjustments. Simultaneous exemptions and increases redistribute burdens across industries; duration determines whether firms face temporary costs or more lasting supply-chain pressure.


