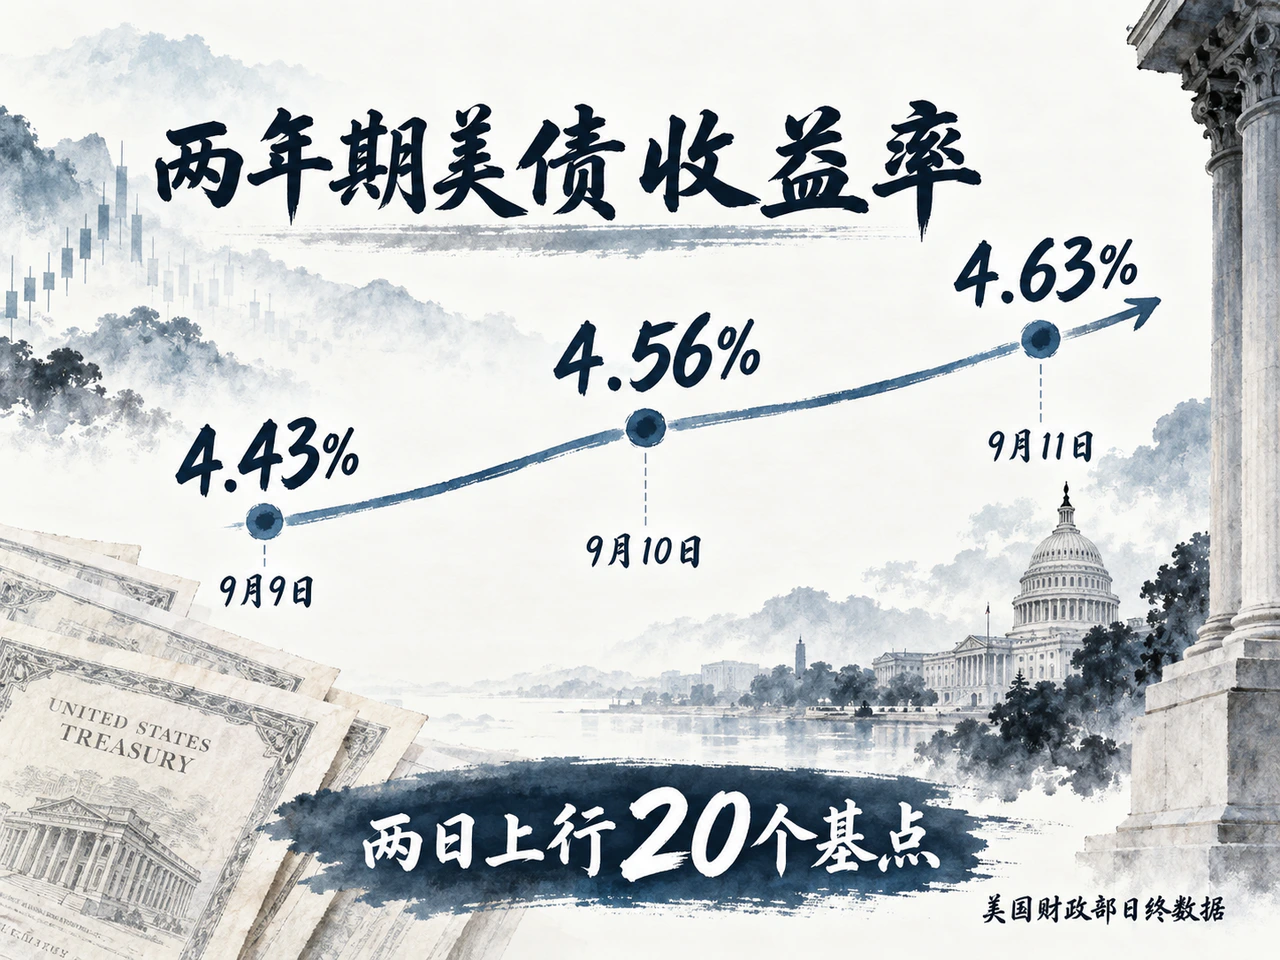
After US August inflation data, September hike expectations rose quickly. Market-implied odds of a 25-basis-point increase went from about 61% on the evening of September 9 to roughly 70% after PPI and about 85%–90% after CPI. Treasury end-of-day data showed the 2-year yield rising from 4.43% on September 9 to 4.63% on September 11, a 20-basis-point increase over two sessions.
Higher energy prices and above-forecast core CPI weakened the case for further Fed observation. Core annual CPI was still declining, however, its three-month annualized increase was around 2%, and monthly increases in both main core PPI measures slowed. Disinflation stalled without a general broadening of price increases.
A roughly 0.1-percentage-point core CPI surprise was enough to shift expectations toward a hike just before the policy meeting. The 2-year move also reflected concern that the Fed might hike more than once and cut later. Institutional views on September converged, while later rate paths remained sharply divided.
1. Data breakdown: Inflation stays elevated but within a manageable range
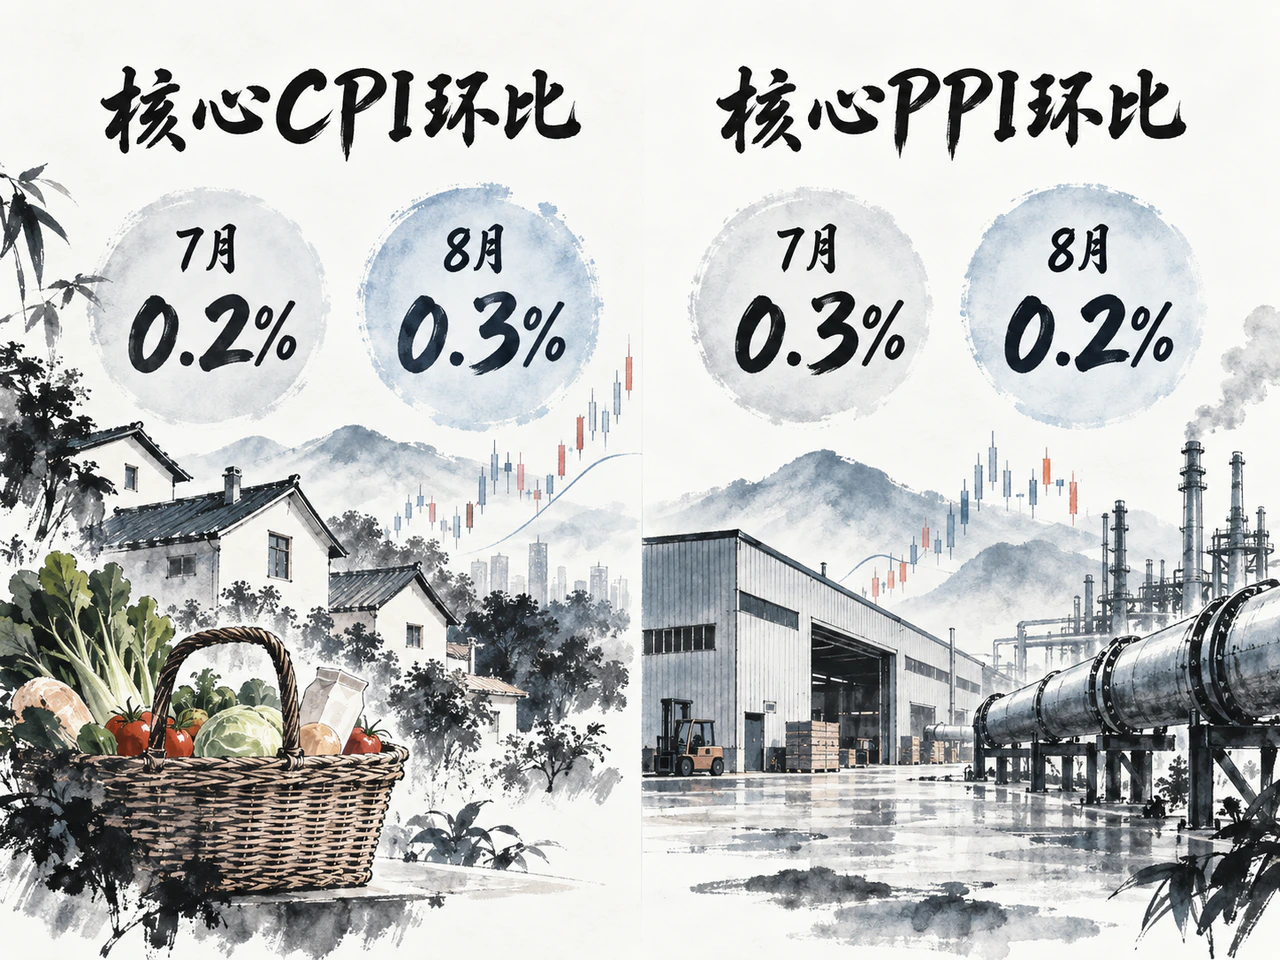
Core CPI rebounds in the short term, with price increases concentrated in selected items
The BLS reported on September 11 that August CPI rose 0.4% monthly, up from July's 0.1% but in line with forecasts. Annual inflation was unchanged at 3.4%. Core CPI excluding food and energy rose 0.3% monthly, above both forecasts and the prior 0.2%, while annual core inflation fell from 2.5% to 2.4%.
| Indicator | July | August |
|---|---|---|
| Headline CPI, month on month, seasonally adjusted | 0.1% | 0.4% |
| Headline CPI, year on year, not seasonally adjusted | 3.4% | 3.4% |
| Core CPI, month on month, seasonally adjusted | 0.2% | 0.3% |
| Core CPI, year on year, not seasonally adjusted | 2.5% | 2.4% |
| Core CPI, three-month compound annualized, approximate | 1.6% | 2.0% |
| Core CPI, six-month compound annualized, approximate | 2.4% | 2.6% |
August's rebound interrupted disinflation, but average recent increases remained moderate. Three-month annualized core CPI rose from July's 1.6% to 2%, and the six-month measure from 2.4% to 2.6%, both modest increases.
Energy lifted headline CPI. August gasoline rose 3.9% monthly, contributing more than a third of the overall increase. Energy rose 2.1% monthly and 16.3% annually, while electricity fell 0.2% and piped gas services 1.1%. Food rose only 0.1%, with food at home flat and food away from home up 0.3%. Pressure was concentrated in fuel rather than spreading simultaneously to all necessities.
Lodging and communication stood out within core services. Shelter accelerated from 0.1% to 0.3% monthly; rent and owners' equivalent rent, measuring owner-occupied housing services, each rose 0.2%. Lodging away from home rebounded 2.4% after July's 2.8% fall. Residential rent increases were moderate, while lodging's rebound raised overall shelter inflation.
Communication rose 2.3%, including 5.9% in wireless services. Bloomberg estimated wireless added about 0.1 percentage point to monthly core CPI, similar to the overall surprise.
Other items varied: airfares rose 2.7%, education 0.8%, used vehicles 0.4% and new vehicles 0.3%. Medical services fell 0.2%, vehicle insurance 0.8%, and apparel was flat. Goods excluding food and energy rose just 0.1% monthly and 0.7% annually. August increases remained concentrated rather than generally broadening.
Energy and transport lift PPI as core increases slow
August final-demand PPI, released September 10, rose 0.4% monthly as expected. July was revised from flat to +0.1%. Annual inflation rose from revised July's 4.8% to 5.4%. Excluding food and energy, monthly growth slowed from 0.3% to 0.2%; also excluding trade services, it slowed from 0.4% to 0.3%.
| Indicator; all monthly changes seasonally adjusted | July | August |
|---|---|---|
| Final-demand PPI | 0.1% | 0.4% |
| Final-demand PPI excluding food and energy | 0.3% | 0.2% |
| PPI also excluding trade services | 0.4% | 0.3% |
| Final-demand goods | −0.4% | 1.1% |
| Of which: goods excluding food and energy | 0.2% | 0.4% |
| Final-demand services | 0.2% | 0.1% |
| Of which: transport and warehousing | −1.1% | 2.3% |
PPI excluding food, energy and trade services rose 4.7% annually, unchanged from July. Both monthly core measures slowed, contrasting with the headline rebound and indicating new pressure mainly from energy and selected goods.
Energy and logistics prices rose together. Final-demand goods rose 1.1%, with energy accounting for more than three-quarters of the increase. Diesel rose 24.1%, alone contributing more than a third of the goods increase. Transport and warehousing rose 2.3%, with truck freight up 2.0%. Further upstream, processed intermediate goods rose 1.8% monthly and 11.5% annually, including 7.3% in processed energy and 0.5% in processed materials excluding food and energy. Fuel costs were already creating pressure through production and transport.
Pass-through depends on demand and pricing power. August trade-services PPI fell 0.2%, including an 11.3% decline in fuel and lubricant retail margins. Higher purchasing costs squeezed retailers, showing firms still absorbed some pressure. Inventory rundown and procurement adjustments could also cushion upstream increases.
PPI measures domestic producers' selling prices. Final demand includes consumption, investment, government purchases and exports, differing from CPI in scope and weights. PPI components such as air travel, medical and financial services also help estimate PCE prices and directly inform the Fed's inflation assessment.
PCE remains above target as employment keeps growing
The Fed's 2% target uses PCE. July headline PCE rose 3.7% annually and core 3.3%, both up 0.2% monthly. PCE and CPI differ in consumption weights, coverage of health and other spending, and methodology. Core CPI had fallen to 2.4% annually, but the latest core PCE remained above 3%, an important argument for hikes.
August payrolls rose 162,000, unemployment was 4.1% and June–July additions were revised up by a combined 55,000. Gains were concentrated: restaurants/bars and local-government education supplied about 62%. Hourly earnings rose 3.1% annually. Continued job growth gave the Fed room to restrain inflation, while concentrated gains and moderate wages suggested no broad labor-market overheating.
2. Market interpretation: Convergence on September, divergence thereafter
Institutions forecast the same September hike for different reasons
After PPI, institutional attention shifted from headline inflation to energy pass-through and PCE estimates. Reuters cited Capital Economics as judging inflation supportive of a hike this year, with September dependent on next-day core CPI. Its subsequent upside surprise led more institutions to adopt a 25-basis-point September hike as their baseline.
Their reasons differed. Media accounts of September 11 research said Goldman Sachs raised its August monthly core PCE forecast only slightly to 0.26%, with little change in its fundamental inflation assessment. It shifted to a September hike mainly because markets widely expected action and a hold could create volatility. JPMorgan argued that core PCE staying above 3% throughout the year left a substantial gap to 2%, requiring further hikes.
| Institution | September and subsequent policy forecast |
|---|---|
| Goldman Sachs | September +25bp; further hikes possible but not the baseline |
| JPMorgan | September and December +25bp each; October reserved for observation |
| Citi | September +25bp, hold through June 2027, then three cuts by end-2027 |
| TD Securities | September, October and January 2027 +25bp each |
| MUFG | September hike, October pause; subjective 55%–60% probability of another December hike |
| Scotiabank | September +25bp expected, but underlying cooling continues and a hike could be a policy error |
| Principal Asset Management | September hike expected, December more likely for the next move; final number undetermined |
Media accounts said Citi expected cuts to resume around mid-next-year, while TD saw hikes continuing to January. MUFG and Scotiabank publicly expected September action while questioning its effects. Disagreement concerned both the number of hikes and whether small hikes could effectively address supply shocks such as energy.
A small inflation surprise sharply increases hike likelihood
Calls for hikes already existed before the releases. July's FOMC held rates by 9–3, with all three dissenters favoring +25bp. On August 28, Warsh emphasized confidence that underlying inflation was returning to 2% fast enough. Subsequent resilient employment and rebounding energy increased concern that delay would entrench inflation.
Monthly core CPI of about 0.29%, above the 0.2% forecast, weakened the case to wait. Markets had already slightly favored a September hike; the data increased the prospect of committee consensus. Close to a meeting, a relatively small surprise can materially change expectations.
Earlier hawkish comments also raised expectations. If the Fed held after strong inflation, investors might infer tolerance of higher inflation and reduce later hike forecasts. Goldman and Scotiabank therefore thought the Fed might fulfill its earlier tightening signal even with limited change in the inflation trend.
The two-year yield also depends on hike counts and cut timing
The 2-year yield reflects expectations over two years. On comparable Treasury daily closes, it rose 13bp on September 10, the PPI release, and another 7bp on September 11, CPI day. The earlier session contributed most of the increase.
| US trading date | 2-year | 5-year | 10-year | 30-year |
|---|---|---|---|---|
| September 9 | 4.43% | 4.61% | 4.83% | 5.28% |
| September 10 | 4.56% | 4.75% | 4.95% | 5.37% |
| September 11 | 4.63% | 4.78% | 4.96% | 5.35% |
| Two-day cumulative change | +20bp | +17bp | +13bp | +7bp |
These are Treasury constant-maturity par yields constructed from indicative bid quotes around 15:30 Eastern time. On CPI day the 10-year rose only 1bp and the 30-year fell 2bp. The 10-year minus 2-year spread narrowed from 40bp before the data to 33bp. Larger short-end moves and flattening indicated higher near-term policy-rate expectations.
If September offered only a hold or a 25bp hike, a probability rise from 61% to 90% would raise the weighted expected increase from 15.25bp to 22.5bp, or 7.25bp. The 2-year yield reflects a longer horizon and cannot be explained by that meeting alone.
The 2-year yield broadly reflects expected average short rates over the next two years plus term, liquidity and other premiums. More hikes or later cuts raise that average. For example, if rates are 25bp above prior expectations for 18 of the next 24 months, the two-year average rises about 18.75bp. The duration of high rates is equally important.
Institutional differences over future hikes and cuts will therefore continue affecting 2-year Treasuries. The daily move also included oil, other central-bank policies, positioning and liquidity; these prices alone cannot separate their contributions.
If a 25bp hike is fully priced, meeting-day attention shifts to the statement, projections and press-conference guidance. An expected hike need not lift 2-year yields further, but indications of more hikes or later cuts still could.
3. Conclusion: Repricing policy thresholds and rate paths amid oil shocks, midterms and PCE revisions

After August PPI and CPI, a September 25bp hike became the central market and institutional expectation, taking the target from 3.50%–3.75% to 3.75%–4.00%. Further action and the duration of high rates still depended on energy, underlying inflation and higher borrowing costs' effect on jobs and consumption.
The longer expensive oil persists, the harder it is for firms to absorb costs through margins, the more likely they are to raise other prices, and the more likely households are to expect continued inflation. Lower oil could ease fuel and logistics costs. Higher energy bills also reduce money available for other household spending and erode profits, weighing on demand.
Hikes chiefly restrain demand and firms' ability to pass costs to consumers. Floating-rate borrowers, new borrowers and refinancing businesses gradually face higher interest and may cut spending, investment and hiring. Low-rate fixed borrowers are affected more slowly. Even expected hikes therefore gradually affect expenditure. With oil already squeezing consumption and profits, the Fed must weigh further economic restraint.
As midterms approach, reducing living and borrowing costs may become stronger policy demands. Results also affect taxes, spending, tariffs and energy: tax cuts or spending expansion may stimulate demand and government borrowing, tariffs alter import costs and energy policy affects supply. Implementation and timing influence inflation and Fed decisions.
August PCE and annual account updates on September 30 will add evidence. Reuters cited Morgan Stanley estimating methodological changes could reduce core PCE inflation through July from 3.3% to about 3.1% annually and its six-month annualized rate from 3.5% to about 3.2%, while three-month annualized inflation stayed near 3.0%–3.1%. Historical levels would be lower, but recent increases still elevated.
The BEA's announced adjustments cover portfolio management, household legal services and software. Portfolio-management real service volume will use industry employment changes. Household legal services will replace inadequate-quality CPI data with related PPI measures. Software prices will add gaming, hosting and related IT-service indicators. These method and source changes alter estimates for some consumption prices.
Scotiabank projected August core PCE around 0.2% monthly and Goldman 0.26%. At the September 15–16 meeting, the Fed would not yet have full revisions. Official month-end data would prompt renewed assessment of further hike odds.
Revisions may also increase estimated real consumption growth. With nominal spending unchanged, less price inflation deducted produces more real growth. Data could thus show both lighter inflation pressure and stronger demand, with no single directional implication for hikes.
If communication and lodging increases do not persist, energy falls and revised core PCE keeps slowing, the case for additional hikes weakens. Broader increases, continued energy pass-through and resilient jobs and spending would favor further hikes. The next 2-year Treasury moves will depend more on changing hike counts and cut timing.


