The pressure of high debt on US public finances is appearing ever more directly in the budget's interest bill. In fiscal 2025, federal revenue exceeded $5.2 trillion, yet the government still ran a deficit of approximately $1.8 trillion. Net interest reached $970 billion, consuming about 18.5% of revenue. In the first 11 months of fiscal 2026, net interest had already exceeded the previous full fiscal year's total.
The US is raising more revenue, but a substantial share of the increase is being absorbed by debt costs and statutory benefit spending. The faster interest and mandatory commitments grow, the less budget room the government can allocate at its discretion, and the harder fiscal repair becomes.
According to related Chinese-language news flashes about the September 15 House hearing, Treasury Secretary Bessent linked keeping the deficit within 3% of GDP to improving the debt burden and stabilizing the Treasury yield curve. The target has an economic rationale: with publicly held federal debt close to GDP and nominal growth around 4%, a total deficit ratio of 3% can help bring the debt ratio down.
A falling debt ratio, however, differs from a net reduction in debt principal. Even a substantial reduction in new borrowing generally leaves nominal debt rising as long as a fiscal deficit remains. The practical problem is that current tax and spending policies do not naturally bring the deficit down to 3%; specific fiscal measures are still required.
The US can improve its fiscal fundamentals, but must gradually bring noninterest revenue and spending closer to balance while preserving tax-base growth and monetary credibility. Tariffs, administrative savings, bond buybacks or demands for Fed rate cuts cannot accomplish this adjustment alone.
Under the original budget baseline, reaching a 3% deficit in 2028 would require nearly $1 trillion of annual fiscal improvement. Subsequent tariff and interest-rate changes have made the adjustment harder. Credible fiscal repair can reduce the risk compensation investors demand for holding long bonds, but rates at different maturities may not decline together. Between the secretary's target and bond investors' willingness to offer cheaper financing lie conditions including whether reforms are delivered and how the economy responds.
1. From Large Deficits to Heavy Interest Costs: Why Fiscal Repair Is Becoming Harder
1. Whether 3% Stabilizes Debt Depends on Growth
Understanding US government finances requires distinguishing deficits, gross debt and debt held by the public. The fiscal deficit is spending in excess of revenue during a fiscal year. Gross federal debt includes debt held by the public and Treasury securities held in government accounts such as Social Security. Publicly held debt more directly reflects obligations incurred through financial-market borrowing, and also includes Treasuries held by the Fed.
At the end of fiscal 2025, CBO recorded approximately $30.2 trillion of publicly held debt, or 99.4% of GDP. Media references to more than $40 trillion of Treasury debt use gross debt at a later date. The timing and statistical coverage differ, so the two figures are not directly comparable.
If debt grows more slowly than the economy, debt as a share of GDP can fall even with a continuing deficit. Ignoring financing adjustments such as cash balances and credit programs, assume the previous year's debt ratio was 100% and current nominal GDP grows 4%. A total deficit of approximately 3.85% of current GDP would keep the ratio broadly stable. Reducing the deficit to 3% would allow a gradual decline.
Conversely, with nominal growth of only 2%, the deficit compatible with a stable 100% debt ratio is about 1.96%. Even achieving the 3% target would then leave the ratio rising. The same deficit target produces different outcomes under different growth conditions.
The economic significance of Bessent's 3% target is to reduce additional borrowing so growth can gradually ease the debt burden. It is not a safety threshold independent of growth. For a government still running deficits, nominal debt generally keeps increasing. Relief first appears as lower debt relative to the economy, rather than a falling face-value stock of Treasuries.
Interest makes the adjustment harder. The primary deficit is the fiscal gap excluding net interest, showing whether current revenue covers noninterest spending. In February 2026, CBO projected net interest at approximately 3.3% of GDP that year. With that interest burden, limiting the total deficit to 3% requires a small noninterest surplus, rather than a continued primary deficit around 2.6%.
By 2036, if net interest rises to 4.6% of GDP, the same 3% total-deficit target would require a primary surplus of about 1.6% of GDP. A larger interest share leaves less room for other spending. The longer adjustment is delayed, the greater the revenue increases and spending restraint needed to reach the same target.
2. Pandemic Spending Has Ended, but the Fiscal Gap Remains Large
The US already had a large fiscal gap before the pandemic, with the 2019 annual deficit near $1 trillion. Spending expanded sharply in 2020–2021, lifting the federal debt stock. Deficits fell substantially as emergency spending ended, but did not continue toward balance. Since 2023, the gap has again remained near $1.7 trillion–$1.8 trillion.
Table 1: Renewed Revenue Growth Has Not Returned the Fiscal Gap to Its Pre-Pandemic Level
Amounts in trillions of US dollars; interest as a share of revenue is in percent. All years are federal fiscal years.
| Fiscal Year | Revenue | Spending | Deficit | Net Interest | Gross Debt at Fiscal Year-End | Net Interest / Revenue |
|---|---|---|---|---|---|---|
| 2019 | 3.463 | 4.447 | 0.984 | 0.375 | 22.670 | 10.8% |
| 2020 | 3.421 | 6.517 | 3.096 | 0.345 | 26.903 | 10.1% |
| 2021 | 4.047 | 6.821 | 2.774 | 0.352 | 28.386 | 8.7% |
| 2022 | 4.897 | 6.272 | 1.374 | 0.476 | 30.839 | 9.7% |
| 2023 | 4.441 | 6.128 | 1.687 | 0.658 | 32.989 | 14.8% |
| 2024 | 4.920 | 6.735 | 1.815 | 0.880 | 35.231 | 17.9% |
| 2025 | 5.236 | 7.011 | 1.775 | 0.970 | 37.375 | 18.5% |
The table uses OMB historical series published through FRED, updated in April 2026. Small revisions distinguish these amounts from earlier Treasury monthly statements and other CBO releases. Year-to-year comparisons should use a consistent data vintage.
From 2019 to 2025, revenue rose approximately 51% and spending 58%, showing that the US has not lost its ability to raise revenue. Net interest grew faster, from $375.2 billion to $970.1 billion, approximately 159%, far outpacing revenue. The primary deficit also widened from about $608.4 billion to $804.6 billion, so the noninterest balance did not improve.
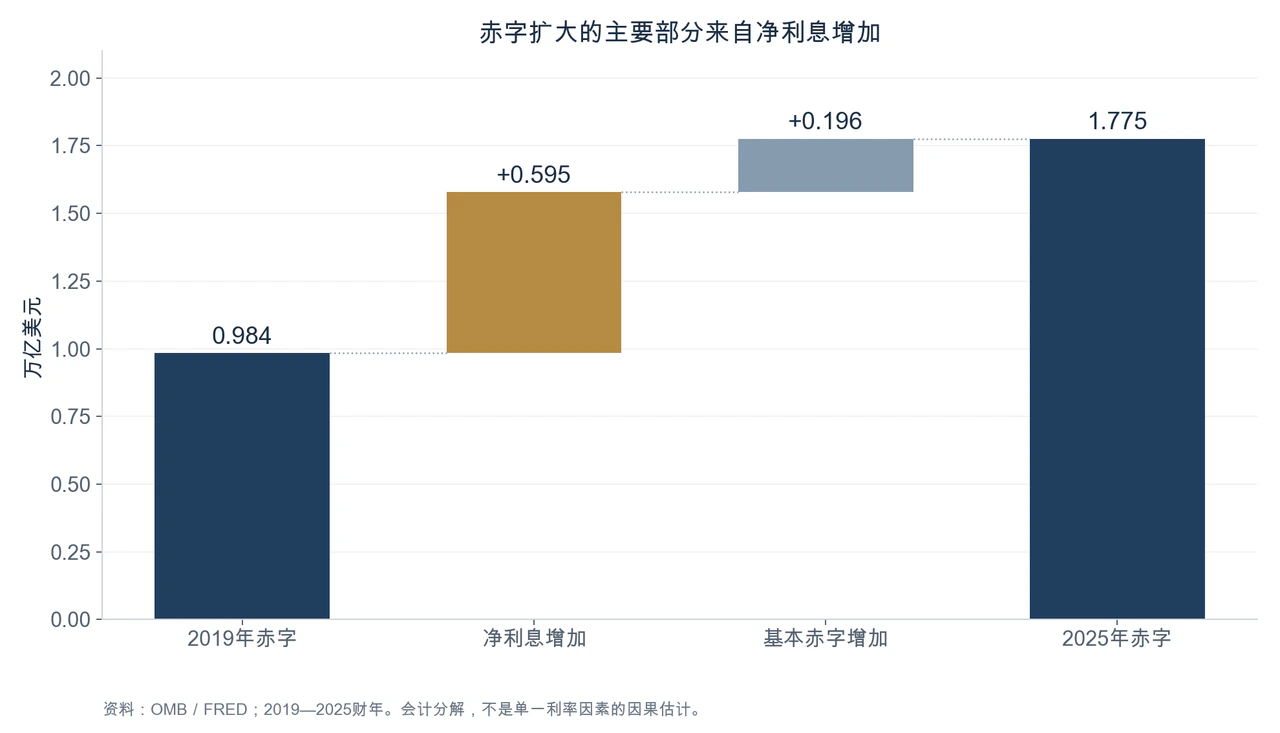
Both components widened the fiscal gap. The annual total deficit increased about $791.1 billion from 2019, including approximately $594.9 billion from higher net interest and $196.2 billion from a larger primary deficit. This is an accounting decomposition, not a claim that interest rates alone caused all fiscal deterioration; debt size also affects interest outlays. It nevertheless shows clearly that interest has become a major obstacle to budget repair.
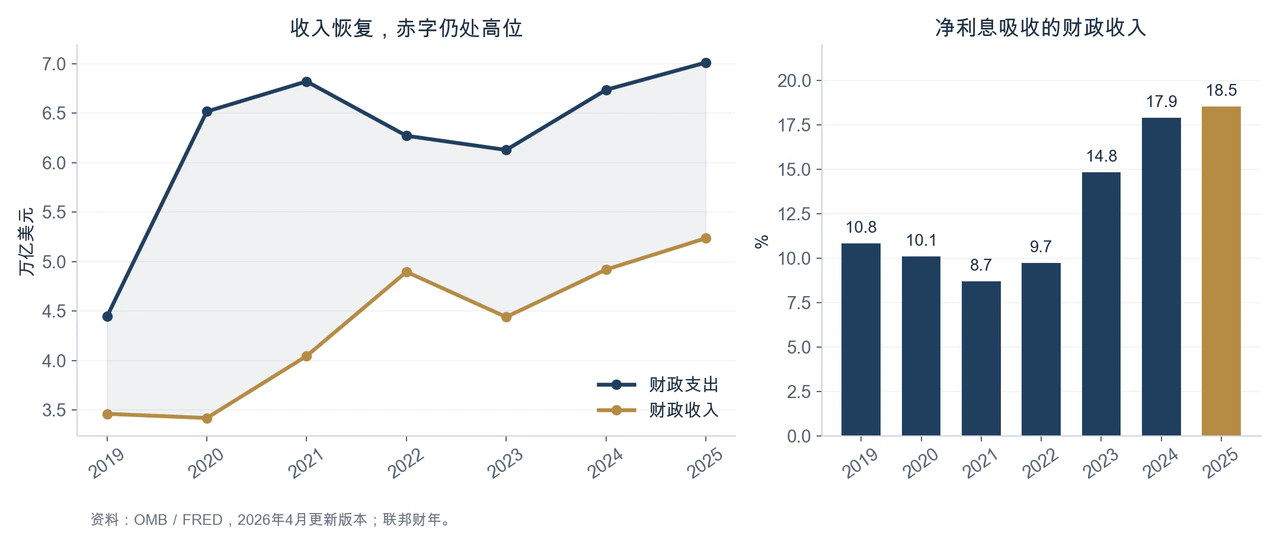
The contrast with 2020 is striking: the deficit surged that year, but net interest fell. Crisis-era low rates temporarily reduced the cost of expanding debt. As low-coupon debt matures and is refinanced at higher rates, previously accumulated borrowing enters the budget through a heavier interest bill.
Today's fiscal pressure thus comes not only from new borrowing this year, but also from repricing years of accumulated debt as it is rolled over. Even with a narrower new deficit, higher financing costs on old debt can continue squeezing the budget.
This explains the distinction between economic growth, higher taxes collected and fiscal improvement. Whether revenue can consistently outgrow combined noninterest and interest spending determines whether the gap narrows. Record tax receipts show increasing revenue; record debt shows continued accumulation of borrowing. Neither alone establishes whether fiscal adjustment is working.
3. The Wage Tax Base Holds Up, but Tariff and Corporate Tax Revenue Face Pressure
Treasury data compiled by the Joint Economic Committee show cumulative fiscal-year revenue through August 2026 of approximately $4.845 trillion, spending of $6.811 trillion and a deficit of $1.966 trillion. Revenue rose 3.29% from a year earlier and spending 2.20%, leaving the unadjusted deficit slightly narrower.
CBO's earlier preliminary estimate, however, found that after adjusting for shifts in payment dates for Social Security, health programs and other items, the first 11 months' deficit increased approximately $82 billion year on year. The two sources differ by about $1 billion in absolute estimates, without changing the interpretation of calendar effects: temporary improvement in cash receipts and outlays does not yet show that sustained deficit reduction has begun.
Employment, wages and personal income remain the country's most important tax base. CBO estimated that combined individual income and payroll taxes rose $239 billion in the first 11 months, including $169 billion more withheld from wages. Wage-related revenue growth continued supplying fiscal receipts.
Corporate income taxes fell $96 billion, approximately 25%. CBO linked this to expanded investment deductions in the 2025 tax law. Corporate investment may raise future capacity, but tax incentives reduce current liabilities first. Investment growth and fiscal revenue arrive at different times; unrealized growth benefits cannot be booked as present revenue.
Tariffs have also failed to provide a stable increment large enough to transform the budget. Net customs revenue in the first 11 months of fiscal 2026 was approximately $167 billion, broadly unchanged from a year earlier, with refunds offsetting some collections. In an August 20 update, CBO estimated fiscal 2026 net tariff revenue would be about $250 billion below its February baseline.
New tariff rates introduced after changes in tariff authority can replace some revenue but have not fully restored earlier expectations. Under policies implemented through July 31, cumulative deficits in 2027–2036 would be approximately $900 billion above the February baseline: about $700 billion from larger primary deficits and $200 billion from added debt interest.
Spending growth is concentrated in major categories such as benefits, interest and defense. After adjusting for payment timing, CBO estimated first-11-month increases of $198 billion in Social Security, Medicare and Medicaid combined, $111 billion in net interest, and approximately $41 billion in Defense Department military activities.
Lower education and other spending offset some growth, but included reestimates of student-loan costs. Such accounting adjustments differ from sustained cuts in routine spending and cannot all be treated as recurring annual cash savings.
The deficit-reduction room created by wage-related revenue growth is weakened by investment tax preferences and tariff refunds, then absorbed by growing benefits and interest. In August, CBO raised its fiscal 2026 deficit estimate from February's roughly $1.9 trillion to approximately $2.1 trillion, mainly because revenue fell short of expectations.
Assessing fiscal improvement requires more than noting that spending growth temporarily trailed revenue. More meaningful evidence is a sustained decline in the primary deficit and a genuinely narrower noninterest revenue-spending gap after payment calendars, refunds and accounting reestimates are removed.
4. The 3% Target Requires Nearly $1 Trillion of Annual Adjustment
CBO's full 10-year baseline published in February 2026 provides a framework for medium-term fiscal pressure. Built from tax and spending laws at a specific cutoff date, it describes the budget path if those policies largely continue. It is not a forecast rebuilt around September market conditions.
Subsequent tariff developments and market rates have departed from some assumptions. The baseline nevertheless offers a common comparison showing how revenue, interest and debt evolve over the medium term and why current policy does not naturally deliver fiscal balance.
Table 2: Interest Continues to Squeeze Fiscal Room in CBO's Medium-Term Baseline
Amounts in trillions of US dollars. The 2028 total deficit is adjusted for payment-date shifts; the other listed years need no such adjustment.
| Indicator | 2026 Forecast | 2028 Forecast | 2030 Forecast | 2036 Forecast |
|---|---|---|---|---|
| Revenue | 5.596 | 6.071 | 6.595 | 8.301 |
| Net Interest Outlays | 1.039 | 1.218 | 1.432 | 2.144 |
| Total Deficit (Adjusted) | 1.853 | 1.956 | 2.201 | 3.115 |
| Total Deficit / GDP | 5.8% | 5.6% | 5.9% | 6.7% |
| Net Interest / GDP | 3.3% | 3.5% | 3.8% | 4.6% |
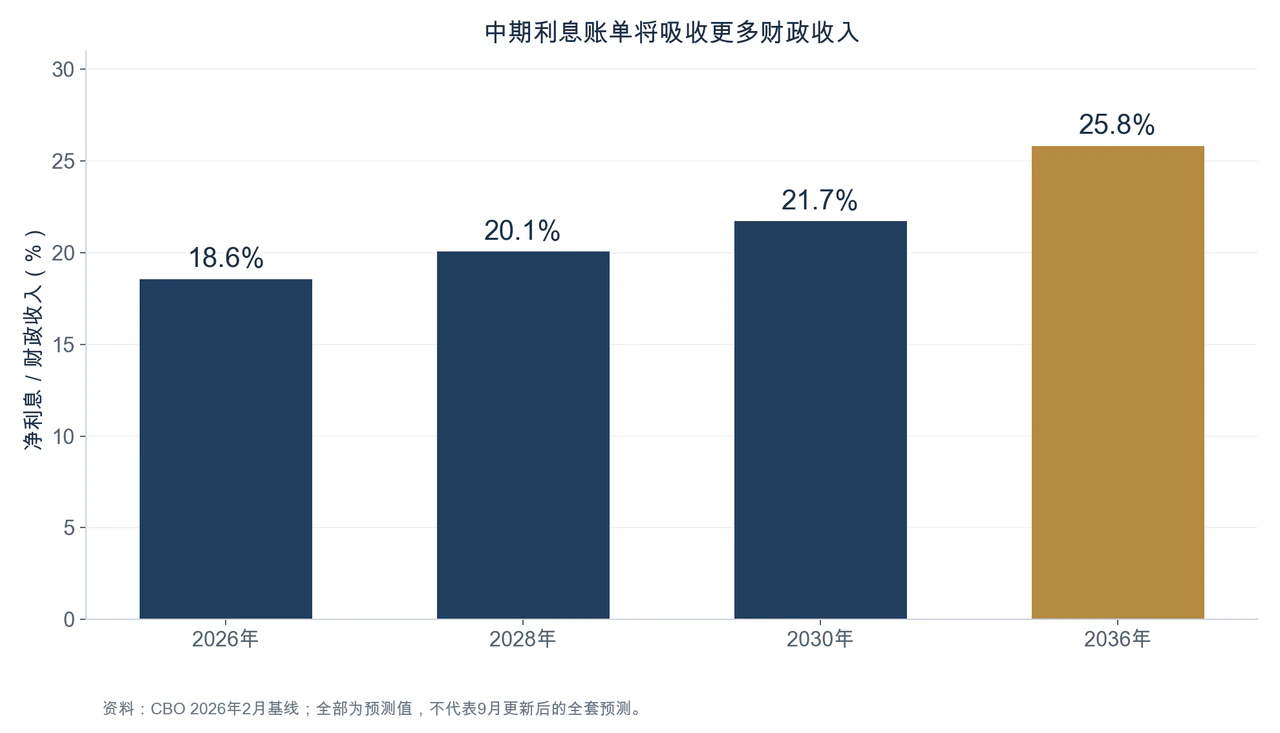
| Net Interest / Revenue | 18.6% | 20.1% | 21.7% | 25.8% |
| Publicly Held Debt / GDP at Year-End | 100.6% | 104.1% | 107.7% | 120.2% |
All table entries use CBO's February 2026 baseline. The August update put the full-year 2026 deficit near $2.1 trillion, so the table's $1.853 trillion is the original projection, not the latest annual estimate. Comparing medium-term structure and assessing current-year progress require the relevant data vintages separately.
On this path, net interest absorbs more than one-quarter of revenue by 2036. Social Security spending is then approximately 5.9% of GDP and major health programs together about 6.7%. Even the baseline decline in discretionary spending relative to GDP is insufficient to offset benefits and interest growth.
The gap is structural: demographics and benefit arrangements determine part of the spending trend, while accumulated debt continuously generates interest. A strong economy can raise revenue, but a single growth cycle is unlikely to eliminate these long-term pressures.
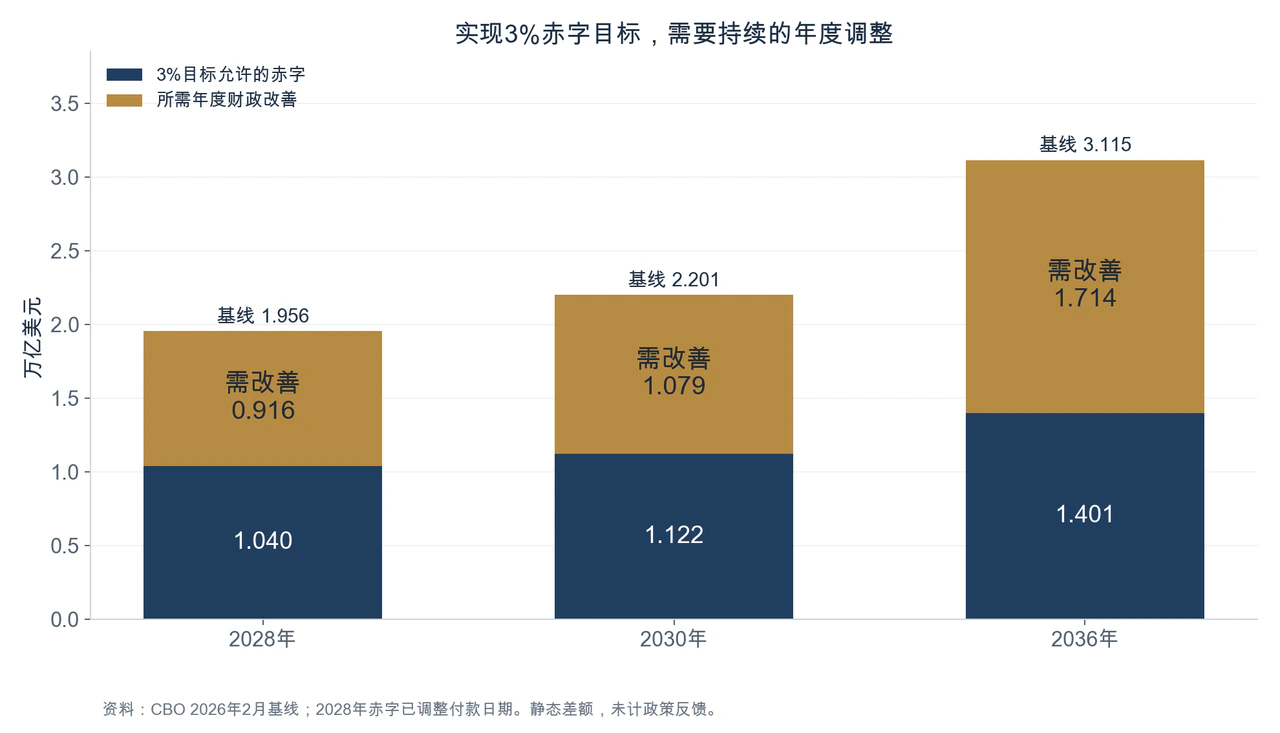
Using CBO's approximately $34.666 trillion nominal GDP forecast for 2028, a 3% deficit equals about $1.040 trillion. Relative to the $1.956 trillion baseline deficit adjusted for payment timing, annual improvement of approximately $916 billion is needed. Against the unadjusted $2.080 trillion deficit, the gap is about $1.040 trillion.
Both measures point to nearly $1 trillion of annual adjustment to reach a 3% deficit, roughly the size of an entire year's nondefense discretionary spending in that period. This task far exceeds what cuts to a few administrative departments can achieve.
In 2030, the same 3% target requires about $1.079 trillion of annual improvement; by 2036, the gap rises to approximately $1.714 trillion. These are static differences calculated with unchanged GDP and interest paths, not cost scores for specific reforms, and they do not preemptively include interest savings from fiscal repair.
They show that maintaining a 3% deficit over time requires changes to the growth paths of revenue and spending. Temporary measures narrowing one year's gap cannot substitute for lasting tax and spending reforms.
5. Historical Fiscal Repair Combined Growth with Budget Discipline
The US achieved substantial fiscal improvement in the 1990s. On the same OMB historical basis, 1993 revenue was approximately $1.154 trillion and spending $1.409 trillion, leaving a $255.1 billion deficit. By 2000, revenue reached $2.025 trillion and spending $1.789 trillion, producing a $236.2 billion surplus.
Over seven years, revenue rose approximately 75% and spending 27%. Revenue outgrew expenditure markedly and for long enough to move the budget from deficit to surplus.
The improvement included the 1990 and 1993 tax increases, budget constraints and subsequent spending adjustments. Strong growth and buoyant asset markets further lifted taxes. The 1990 budget reforms introduced spending caps and PAYGO rules requiring offsets for new tax cuts or mandatory spending, limiting the extent to which new policies could widen the budget gap.
That experience cannot be reduced to tax cuts automatically generating enough growth. Expansion supplied revenue, while budget discipline restrained spending and new commitments. Together they created the conditions for sustained deficit reduction.
Today's constraints differ. Age-related spending is heavier, debt stocks higher and interest's erosion of revenue stronger; the medium-term budget also faces demands for greater defense investment. The 1990s show a fiscal policy mix can work, but do not guarantee that era's growth conditions or spending room remain available. History offers direction; concrete adjustment must fit today's budget structure.
The postwar experience also shows the institutional cost of suppressing financing rates. From 1942, the Fed pegged short-term Treasury bill rates at 0.375% and maintained an implicit ceiling around 2.5% on long Treasuries. Maintaining this arrangement required purchases of government securities and restricted its ability to respond independently to inflation.
The 1951 Treasury–Fed Accord ended the arrangement and established the direction of separating debt management from monetary policy. Lower government financing costs and monetary stability cannot always be achieved simultaneously through the same policy.
When nominal growth is strong and average debt interest costs low, the US can gradually reduce its debt ratio. But deliberately generating inflation or demanding prolonged yield suppression erodes creditors' real returns. If investors raise inflation compensation and risk premiums, newly issued debt may instead become more expensive.
A one-off erosion of old debt's purchasing power does not necessarily yield lasting fiscal benefits. Government benefits over time from credible low inflation and stable financing because substantial debt must still be issued, mature and be refinanced.
2. From Budget Reform to Bond Pricing: How Fiscal Repair Affects Treasury Yields
1. Revenue Increases and Spending Cuts Must Produce Lasting Net Improvement
Fiscal repair must constrain new permanent spending and tax-cut promises rather than spend prospective growth benefits in advance. In its February baseline, CBO estimated that the 2025 reconciliation act still increased cumulative 2026–2035 deficits by approximately $4.7 trillion after economic feedback and debt interest.
That estimate already includes the law's growth benefits. Even if the economy benefits, additional revenue does not offset the fiscal cost. Unquantified future growth cannot then be used again to erase that cost entirely.
The 2027 budget proposal also illustrates the trade-offs. CBO's June 30 assessment found it would increase mandatory spending in 2027–2036 by about $351 billion and defense discretionary spending by approximately $2.4 trillion, while cutting nondefense discretionary spending around $2.6 trillion. On these rounded figures, other increases nearly offset nondefense cuts.
The presidential request contains no revenue proposals and does not fully set out aggregate deficit or debt projections. It shows a shift in spending priorities, but cannot independently establish that a complete plan to achieve the 3% deficit target exists.
Revenue reform can begin by broadening the tax base. Using Joint Committee on Taxation estimates, CBO put 2026 tax preferences in the individual and corporate income-tax systems, including payroll-tax effects, at approximately $2.6 trillion, or 8% of GDP. Limiting inefficient deductions, narrowing exemptions and improving collection can expand the effective tax base and reduce reliance on higher statutory rates alone.
The accounting total of tax preferences is not the revenue immediately available from repeal. Provisions interact and firms and households change behavior; some arrangements involve health insurance, retirement savings and investment. Reform requires provision-by-provision evaluation, preserving measures with clear social value or benefits to supply capacity. The full $2.6 trillion cannot be treated as available funds.
Tariffs can contribute revenue but are unlikely to carry the main burden of fiscal repair. Their base depends on imports, which higher rates themselves change; exemptions, trade negotiations and legal developments affect collections. Higher import costs can also raise inflation and financing costs, offsetting some budget gains.
The latest downward tariff revision shows that fiscal plans cannot simultaneously count on import substitution and indefinitely assume an unchanged import tax base. Assessing tariffs' contribution requires net post-implementation receipts and economic effects, rather than the tariff-rate increase alone.
Spending reform also cannot indefinitely avoid fast-growing major categories. In 2025, mandatory spending was approximately $4.168 trillion, net interest $970 billion and defense discretionary spending $893 billion, together about 86% of total outlays. Excluding all these areas leaves the remaining budget poorly placed to close the gap on a sustained basis.
Social Security reform can address the contribution tax base, benefits for high-income groups and gradual parameter changes. Health programs need better payment incentives and control of service prices and inefficient spending. These involve distributional choices: savings must be assessed alongside who bears the cost. There is no vast spending-cut channel without anyone paying a price.
The 2026 Social Security trustees' report projected exhaustion of Old-Age and Survivors Insurance trust-fund reserves in the fourth quarter of 2032, when continuing revenue could cover approximately 78% of scheduled benefits. Social Security revenue would not disappear; rather, the gap between promised benefits and dedicated financing has reached a point requiring action.
Under statutory budget rules, CBO continues to include full scheduled benefits. Possible cuts after trust-fund exhaustion are not already determined fiscal measures and cannot be treated as additional implemented savings outside the baseline.
2. Growth Expands the Tax Base but Cannot Fill Budget Gaps in Advance
Bessent has sound economic reasons to emphasize growth. Higher productivity, more employment and a larger wage tax base can raise revenue and accelerate debt-ratio declines. Better energy supply, grids and construction approvals, effective capital formation and greater labor participation could benefit both the real economy and public finances.
Short-term demand stimulus differs from long-term supply capacity. Deficit-financed spending can raise current GDP without necessarily creating a tax base sufficient to cover financing costs over time. The fiscal question is whether growth lasts and whether its revenue exceeds additional spending and interest.
In February, CBO projected average real GDP growth of approximately 1.8% in 2027–2036. Other things equal, raising sustained real growth to 3% would leave the real economy about 3.6% larger after three years and 12.4% after 10. Sustained growth has considerable long-term value, but that value accumulates over time and cannot all be booked in one year's budget.
Even assuming revenue rises proportionately, against roughly $6 trillion of receipts after three years the gain would be only a little over $200 billion, far smaller than the annual adjustment near $1 trillion. This calculation compares orders of magnitude only and excludes changes in spending, rates and revenue responsiveness to growth.
Investment tax incentives have a particularly important timing gap. Immediate expensing lets firms deduct investment earlier, reducing current tax payments before new equipment and R&D generate output in later years. If projects underperform, forgone current revenue is not automatically recovered.
Higher productivity may also raise the equilibrium real interest rate. Fiscal benefits should therefore come principally from a broader tax base and a lower debt ratio; one cannot assume much faster growth, fully realized tax gains and necessarily lower borrowing rates all at once.
A credible fiscal plan should first enact executable tax and spending measures, then let stronger-than-expected growth accelerate deficit reduction. Fully budgeting unrealized growth dividends in advance makes the fiscal target depend on the least controllable variable.
The IMF's 2026 US Article IV consultation likewise judged that substantive adjustment requires both more revenue and rebalancing Social Security and health programs. Its recommended general-government primary surplus of about 1% of GDP covers a broader government perimeter and cannot directly replace the federal 3% total-deficit target. Both nevertheless require sustained improvement in the primary balance so noninterest receipts and spending move away from a persistent gap.
3. Buybacks Improve Liquidity but Cannot Substitute for Fiscal Savings
The Treasury's recent expansion of long-bond buybacks attracted attention. On August 19, it announced that per-operation liquidity-support buyback caps for the 10–20-year and 20–30-year segments would rise from $2 billion to at least $4 billion. The schedule updated September 9 then put the September 10 operation in the 10–20-year segment at a $6 billion cap.
These are permitted operation limits, not completed purchase amounts. Their market impact still depends on actual operations and investors' views of subsequent financing.
Buying back old issues can improve liquidity in less actively traded securities, ease dealer inventory pressure and smooth market functioning. But if financed with new notes, bonds or bills, the government merely changes its liability composition and the structure of securities in circulation. It does not gain equivalent fiscal revenue or a surplus.
Replacing long debt with short debt can reduce duration risk borne by the private sector, meaning price exposure to changes in long-term rates. In return, government must refinance more frequently and becomes more sensitive to future short-rate changes.
Even when discounted repurchases reduce face-value debt, that decline is not all a fiscal gain. Old issues usually trade at discounts because their coupons are below current market funding costs. Whether higher-cost new debt used to buy back low-coupon old debt is worthwhile requires comparing future cash flows and maturity risks, rather than face value canceled. Smaller book debt and lower economic costs are not always the same.
The Treasury's August quarterly refunding statement expected nominal coupon and floating-rate auction sizes to remain steady for several quarters, with seasonal financing mainly adjusted through bills. Cash-balance targets also affect near-term issuance.
A temporary fall in bill issuance may therefore simply reflect tax-date cash flows, rather than a structurally smaller deficit. Financing must cover not only deficits, but maturing debt, cash-balance adjustments and credit-program cash flows.
Broadening the Treasury investor base, improving market-making capacity and strengthening repo and clearing arrangements can all smooth government financing. They mainly affect willingness to hold debt, liquidity and risk-bearing capacity, improving trading conditions without automatically narrowing the budget gap.
Greater demand for short-term bills does not imply equally stronger demand for long Treasuries. Fiscal sustainability depends on reducing cumulative financing pressure over many years, rather than merely making one auction easier.
4. Fiscal Policy Affects Risk Compensation; Growth and Inflation Affect the Rate Path
Long Treasury yields broadly comprise the expected average of future short-term rates and a term premium compensating investors for long-rate risk. The premium is not directly observable and requires model estimates. Fiscal risk, inflation uncertainty, duration supply and the investor base can all affect it.
The 10-year yield minus today's policy rate therefore cannot simply be called a fiscal risk premium. That gap also includes expectations for future policy rates, and the two influences must be distinguished.
Credible fiscal consolidation supports long bonds through two main channels. Lower future net financing needs and a more stable debt path can reduce required risk compensation. If deficit reduction also eases demand and inflation pressures, it may lower expected future policy rates. Long bonds benefit most clearly when both occur together.
If fiscal improvement comes mainly from higher productivity and investment returns, the outcome may differ: lower risk compensation could coincide with a higher equilibrium real rate, leaving little net change in nominal yields. Growth and inflation mediate the link between fiscal improvement and lower rates.
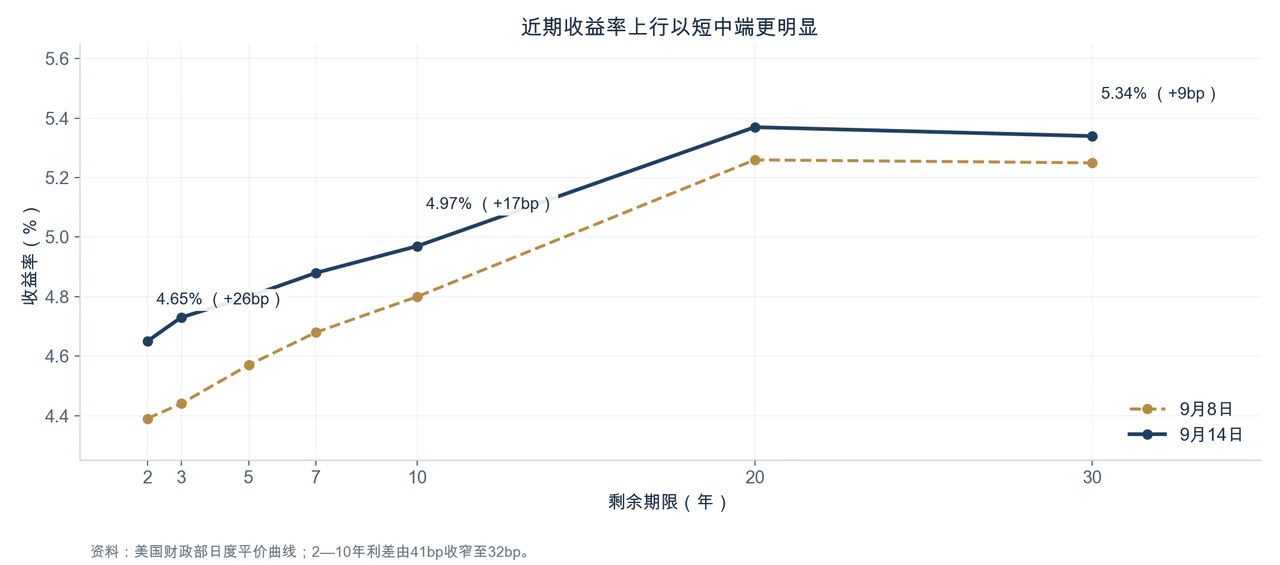
As of September 14, the Treasury daily curve showed two-year yields of 4.65%, 10-year yields of 4.97% and 30-year yields of 5.34%. From September 8, they rose 26, 17 and nine basis points, respectively, narrowing the two-year/10-year spread from 41 to 32 basis points.
Yields rose overall, but short and intermediate maturities rose more, flattening the curve. This alone does not establish that fiscal concerns caused an isolated loss of control at the long end; markets were also repricing the short-rate path and other macroeconomic factors.
Inflation remains a real constraint. August CPI rose 0.4% month on month and 3.4% year on year. Gasoline rose 3.9% in the month, contributing more than one-third of the headline increase; core CPI rose 2.4% year on year. Energy pressure and broader price trends were not fully aligned.
The Fed must assess both the persistence of energy shocks and core inflation. The government's desire for cheaper financing cannot replace the central bank's judgment about prices and economic conditions.
On September 14, the 10-year real Treasury yield was 2.60%, approximately 2.37 percentage points below the nominal yield. This gap approximates inflation compensation, but includes inflation risk and relative liquidity effects and cannot all be interpreted as pure expected inflation.
The elevated real yield also shows that high nominal rates do not arise entirely from inflation compensation. Even if inflation expectations ease, real financing costs may continue supporting long yields.
If future yield declines come mainly from recession and Fed cuts, fiscal conditions need not improve. Weak growth reduces tax receipts and raises automatic-stabilizer spending such as unemployment benefits. Treasury yields could fall markedly while the fiscal balance deteriorates.
Interpreting a bond rally requires jointly observing term premiums, inflation compensation, primary fiscal balances and growth. Lower rates from better credit fundamentals have different fiscal implications from recession-driven haven demand and rate-cut trading.
5. A Changed Debt Path Provides the Basis for Lasting Rate Repricing
A simplified scenario exercise illustrates the long-term value of the 3% target. Starting from CBO's projected end-2026 publicly held debt ratio of 100.6%, assume constant total-deficit ratios and nominal GDP growth for the next 10 years, ignoring other financing adjustments. Different policy-growth combinations can then be compared.
Table 3: Whether the Debt Ratio Falls Depends on the Combination of the Fiscal Gap and Nominal Growth
| Constant-Parameter Scenario | Annual Total Deficit / GDP | Annual Nominal GDP Growth | Debt / GDP after 10 Years | Nominal Debt Increase over 10 Years |
|---|---|---|---|---|
| Fiscal gap remains high | 6% | 4% | 118.6% | 74.5% |
| Deficit immediately falls to 3% and stays there | 3% | 4% | 93.3% | 37.2% |
| Stronger growth, deficit still 6% | 6% | 5% | 110.4% | 78.8% |
| Weaker growth, further widening deficit | 7% | 3% | 136.4% | 82.2% |
These are fixed-parameter calculations, not official forecasts, and no probabilities are assigned. Immediate achievement of 3% is used only to illustrate the target's effect, not a realistic timetable. A gradual multiyear adjustment accumulates more debt during transition and produces a higher final debt ratio.
A fixed total-deficit ratio already includes interest. Adding interest again would double-count financing needs.
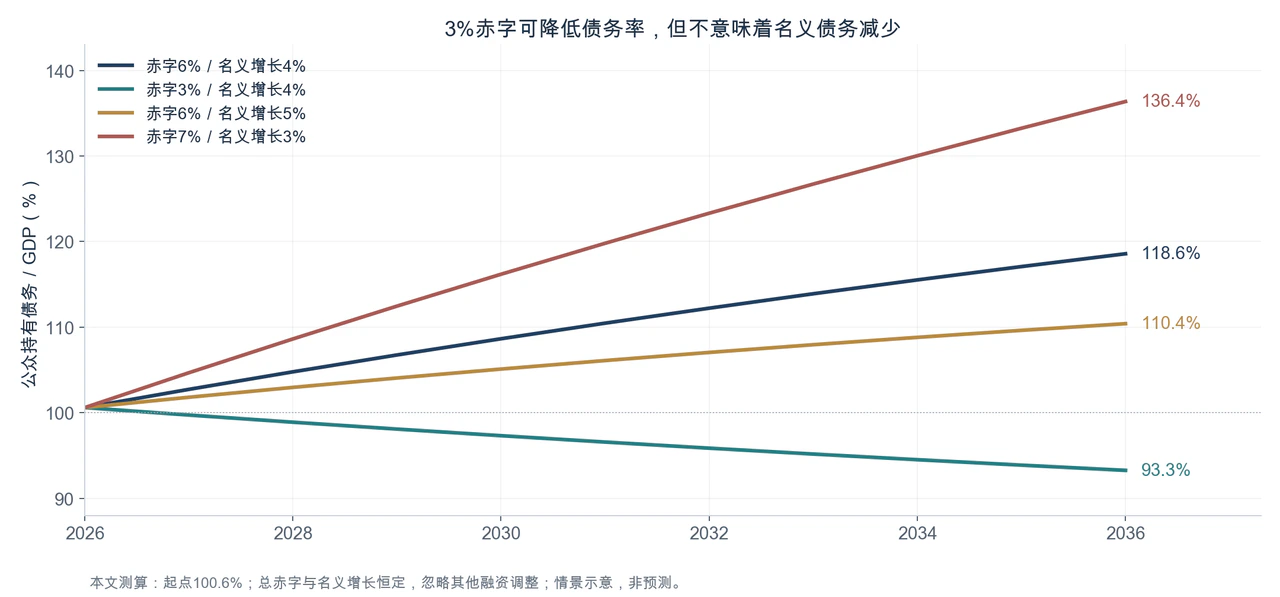
Stronger growth eases debt-ratio pressure, but at a 6% deficit even 5% nominal growth does not initially bring the ratio down. By comparison, the 3% deficit scenario lowers the ratio after 10 years from roughly 119% to 93%, although nominal debt still grows approximately 37%.
Bessent's target mainly reduces debt relative to the economy and leaves fiscal room for shocks such as recession or war. It improves risk-bearing capacity without making the Treasury debt stock automatically decline after the target is met.
Historical research offers a reference for fiscal effects on rates. Fed economist Thomas Laubach found a one-percentage-point increase in expected deficits associated with roughly 25 basis points higher forward long-term rates; a one-point rise in the debt ratio corresponded to an estimated three to four basis points. Another Fed study of G7 countries put the long-run deficit effect around 15 basis points.
These studies differ in subject, horizon, controls and sample. Deficit and debt coefficients cannot be added or directly applied to today's spot 10-year yield. They demonstrate fiscal effects on rates, not a fixed price transferable across eras.
Using those estimates only as an order-of-magnitude reference, credible and lasting improvement of three percentage points in the deficit ratio could affect long rates by tens of basis points. Mechanically applying coefficients of 15–25 basis points gives 45–75 basis points.
This is not a target for today's yield. Growth effects, how much markets have already priced, central-bank policy and international capital demand could materially change the result. Debt-ratio effects reviewed in 2024 Fed research themselves ranged from one to six basis points, with warnings that historical relationships may not hold at higher debt levels.
Rates also feed back into fiscal outcomes over years of refinancing. CBO estimated in April 2026 that, holding other economic variables constant, rates 0.1 percentage points above baseline at every maturity each year would add approximately $379 billion to cumulative 2027–2036 deficits and around $60 billion in 2036 alone.
Lower financing costs therefore have considerable long-term value, but savings emerge gradually as old debt matures and is refinanced. Multiplying all outstanding debt by today's yield decline cannot produce an immediately bookable saving in the current budget.
6. Medium-Term Benefits Depend on Budget Delivery and Monetary Credibility
The US retains economic and institutional resources to stabilize debt, but has not assembled a policy mix sufficient to ensure the 3% target. The 2026 revenue composition, interest growth and tariff revisions all show the need for more lasting measures.
The depth and liquidity of dollar asset markets make US financing resilient. That advantage helps the government continue borrowing, but does not guarantee long-term borrowing costs stay where it wants.
Over the next 6–12 months, the most useful tests are a credibly scored budget plan with concrete revenue and spending provisions, and sustained narrowing of the primary deficit after special factors are excluded. Progress on both would directly show whether fiscal promises are starting to be delivered.
Buyback announcements, one-month surpluses and auction-size changes affect trading but cannot independently demonstrate repaired medium-term fundamentals. Enacted laws and their implementation are more capable than executive targets of changing investors' expectations for fiscal balances and borrowing.
Over 2027–2030, fiscal policy could correspond to three different rate environments.
If reforms remain limited to selective savings, reprioritized spending and debt management, primary deficits, interest costs and inflation uncertainty will continue constraining long yields. Markets will lack a basis for persistently reducing risk compensation.
If revenue and spending reforms are credible and growth stable, term premiums could fall, giving 10–30-year yields additional downside support relative to levels determined solely by policy-rate expectations.
If fiscal contraction causes pronounced weakness, markets may lower policy-rate expectations faster, with larger declines in short and intermediate yields and a steeper curve. Such a curve change need not mean weaker fiscal credibility; it may mainly reflect a softer growth and monetary-policy outlook.
Another combination deserves attention: continued spending expansion without matching revenue, accompanied by attempts to suppress financing costs through monetary policy. This may temporarily ease short-term interest bills while causing investors to demand more long-term inflation and policy risk compensation.
The result could be lower short yields but persistently high long yields. If fiscal repair undermines monetary credibility, its benefit to long Treasuries may be offset, potentially making future financing harder.
The feasible route to better US fiscal fundamentals is to move noninterest receipts and spending gradually toward balance, then use credible budget rules, productivity growth and stable inflation to keep easing the debt burden. A 3% deficit target can provide a medium-term constraint, but must become executable tax and spending arrangements.
The important Treasury-market implication of Bessent's remarks is the link between stable long-term financing costs and a better fiscal path. Only budget changes sufficient to convince investors of sustained relief in future borrowing pressure give the bond market reason to reduce its required risk compensation on the US government over time.


