On September 17, 2026, oil prices and Treasury yields fell together, easing recently tight market sentiment and helping US equities recover from the previous session's pressure. The S&P 500 rose 1.14% and Nasdaq 100 gained 1.73%, led by semiconductors and data-center infrastructure. Benchmark 2-year and 10-year Treasury yields both fell 7 basis points. Marginally easing fears of crude supply disruptions, together with expectations of major equipment orders in the AI supply chain, temporarily strengthened bullish momentum. Low initial jobless claims and rising manufacturing price indices nevertheless kept restrictive interest-rate constraints firmly in place. Cyclical and value stocks lagged, leaving the rebound's breadth limited.
Easing supply fears lower oil prices as the Treasury yield curve shifts down
The oil market received some positive supply signals. Reuters reported that Saudi Arabia was offering Asian refineries more crude cargoes through ship-to-ship transfers off Sohar, Oman, offsetting physical shortfalls caused by damage to pipelines and Yanbu export facilities. Reports that Saudi Arabia sought to restore some pipeline capacity within days also cooled extreme near-term supply fears. The transfers remained an alternative route, and some European deliveries were still disrupted, but improved supply expectations nevertheless drove oil temporarily lower. Continuous quotations showed Brent closing at $104.08/barrel, down 1.65%, and WTI at $101.05, down 1.35%.
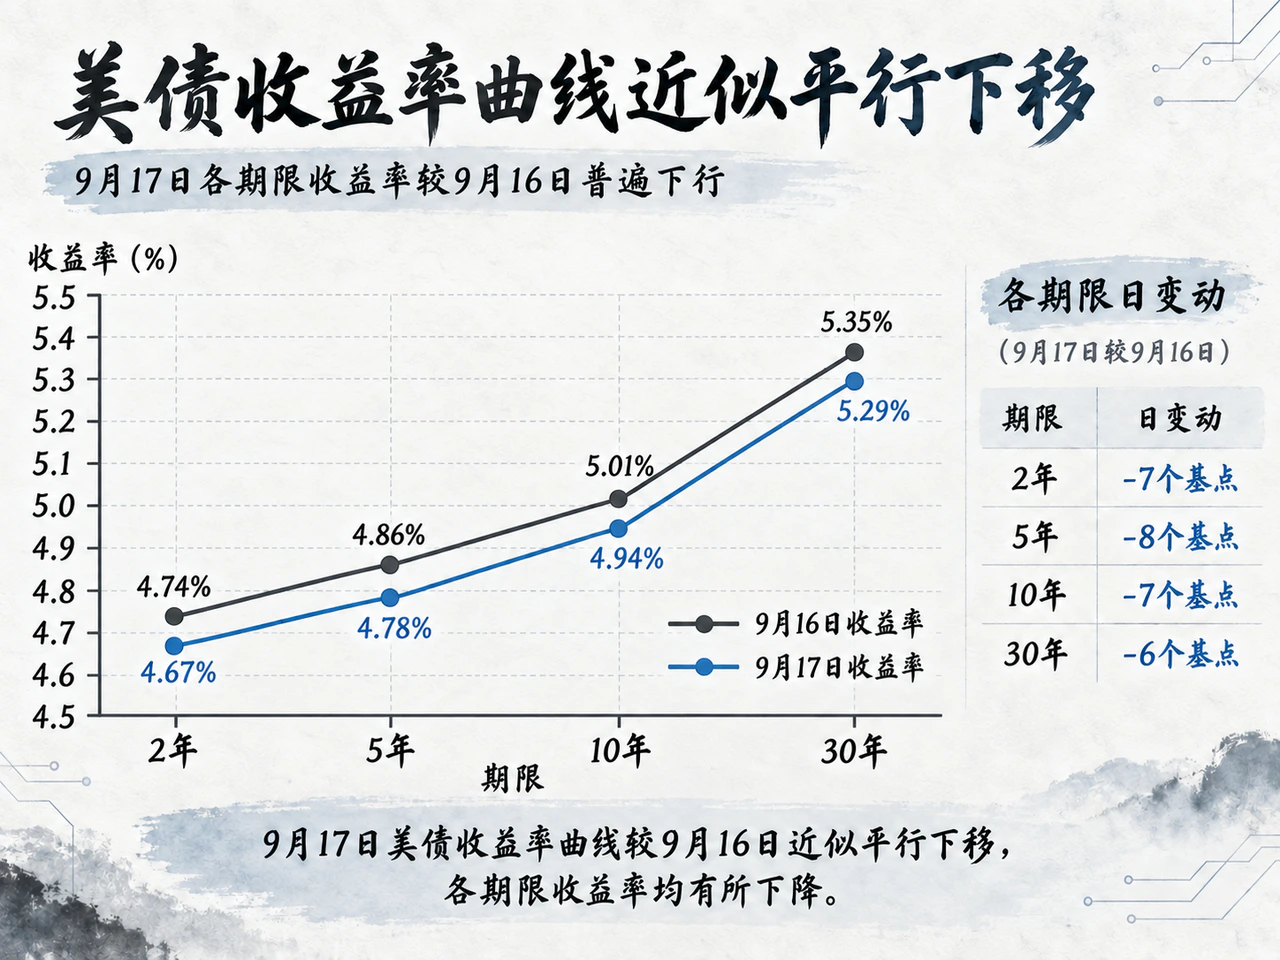
Temporary relief in energy costs reduced near-term inflation-compensation expectations, giving the previously pressured Treasury market room for a technical recovery. Comparable US Treasury daily curves showed an approximately parallel decline across maturities:
| Maturity | September 16 yield | September 17 yield | Daily change |
|---|---|---|---|
| 2-year | 4.74% | 4.67% | -7 basis points |
| 5-year | 4.86% | 4.78% | -8 basis points |
| 10-year | 5.01% | 4.94% | -7 basis points |
| 30-year | 5.35% | 5.29% | -6 basis points |
The 2-year/10-year Treasury spread remained 27 basis points. Short yields mainly reflected a marginal adjustment in policy expectations after the hike, while the long end also benefited from lower inflation premiums. The intraday 5-year breakeven inflation rate fell to 2.322%, versus the prior close of 2.353%. Absolute financial conditions remained restrictive, however: that day's $19 billion reopening of 10-year Treasury Inflation-Protected Securities (TIPS) cleared at a high real yield of 2.653%, with a bid-to-cover ratio of only 2.24. The technical decline in nominal yields did not alter the underlying picture of elevated long-term real funding costs.
Precious metals did not join the simultaneous equity and bond rally. Continuous gold futures closed at $4,382.50/ounce, down 0.11%, while the dollar index slipped 0.07% to 100.236. Slightly lower nominal rates and a weaker dollar improved the cost of holding non-interest-bearing assets, but intraday futures pricing still put the chance of another October hike near 51%. Lower oil prices were insufficient to force a monetary-policy turn, leaving gold caught between evenly balanced buying and selling forces.
Resilient employment supports domestic demand, while high mortgage rates constrain housing
Economic data further challenged the idea that a recession trade was driving Treasuries higher. Initial US jobless claims fell 10,000 to 196,000 in the week ended September 12, well below expectations of 208,000. The four-week average declined to 203,250, smoothing short-term volatility. Labor Day seasonal effects might have amplified the weekly decline and limited trend conclusions, but low layoffs still confirmed basic labor-market stability and supported household consumption.
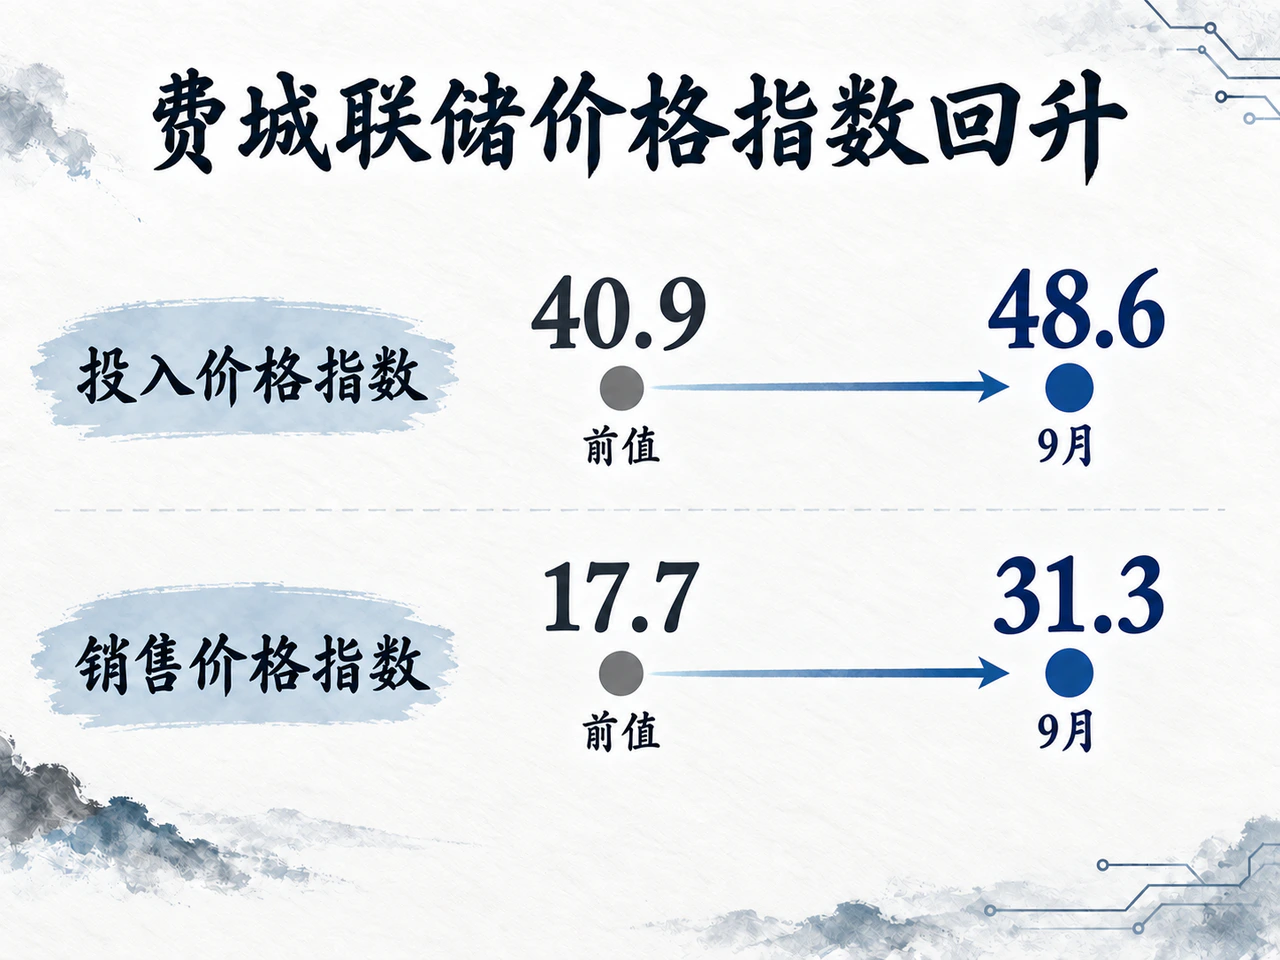
Manufacturing and housing diverged sharply. The Philadelphia Fed's September manufacturing index fell from 47.4 to 37.8 but remained in expansion and above expectations, with new orders at 29.2 and shipments at 27.7. Price indicators rebounded notably: prices paid rose from 40.9 to 48.6 and prices received from 17.7 to 31.3. Regional manufacturing costs therefore remained sticky, and firms' pricing momentum had not faded.
Housing continued facing high-rate pressure. August US housing starts ran at an annualized 1.275 million units, down 2.6% month on month, mainly on weak multifamily construction. Single-family starts rose 7.6%, but the forward-looking single-family permit figure fell 1.8% to 878,000, suggesting limited follow-through. The latest weekly average 30-year fixed mortgage rate jumped from 6.76% to 6.95%, directly raising buyers' financing burdens and developers' promotional costs. Lennar's fiscal third-quarter results illustrated the pressure: new orders fell 9% year on year, gross margin narrowed from 17.5% to 15.8%, and the annual delivery target was reduced. Although Lennar, D.R. Horton and PulteGroup shares recovered 1.1%–1.7% as rates fell, a substantive recovery in industry profitability would take longer.
AI hardware and power orders drive a technology rebound, but market breadth remains limited

Lower rates and industrial orders together allowed growth stocks to lead the US rebound. The S&P 500 closed at 7,637.76 and Nasdaq 100 at 29,446.98. The Dow Jones Industrial Average rose a modest 0.61% to 51,778.04 and the small-cap Russell 2000 only 0.55% to 2,874.63. The VIX fell from 17.71 to 15.44, signaling a clear retreat in short-term risk aversion. The Technology Select Sector ETF (XLK) gained 2.25%, energy ETF XLE rose 0.70%, and financial ETF XLF slipped 0.09%.
Semiconductors and AI infrastructure were especially strong. Nvidia rose 2.5%, AMD 6.4%, semiconductor ETF SOXX around 3.5% and memory-chip ETF DRAM around 4.5%. Expectations of rising memory prices improved upstream chipmakers' earnings prospects. Arm management expressed greater confidence in achieving $2 billion in sales from its first AI chip, while also highlighting continuing capacity constraints.
Computing demand's spillover into supporting infrastructure became more evident. Backup-power equipment supplier Generac disclosed a long-term generator supply agreement with Amazon, expecting $2.4 billion in initial deliveries during 2027–2028. The agreement includes warrant thresholds linked to cumulative purchase payments of up to $8 billion. Generac shares surged around 19% that day. Better order visibility improved the outlook for discounted future cash flows in major technology growth stocks, but downstream cost sharing and stagnant small caps showed that improving demand remained highly uneven.
Asian liquidity responses diverge as offshore and onshore credit financing differ
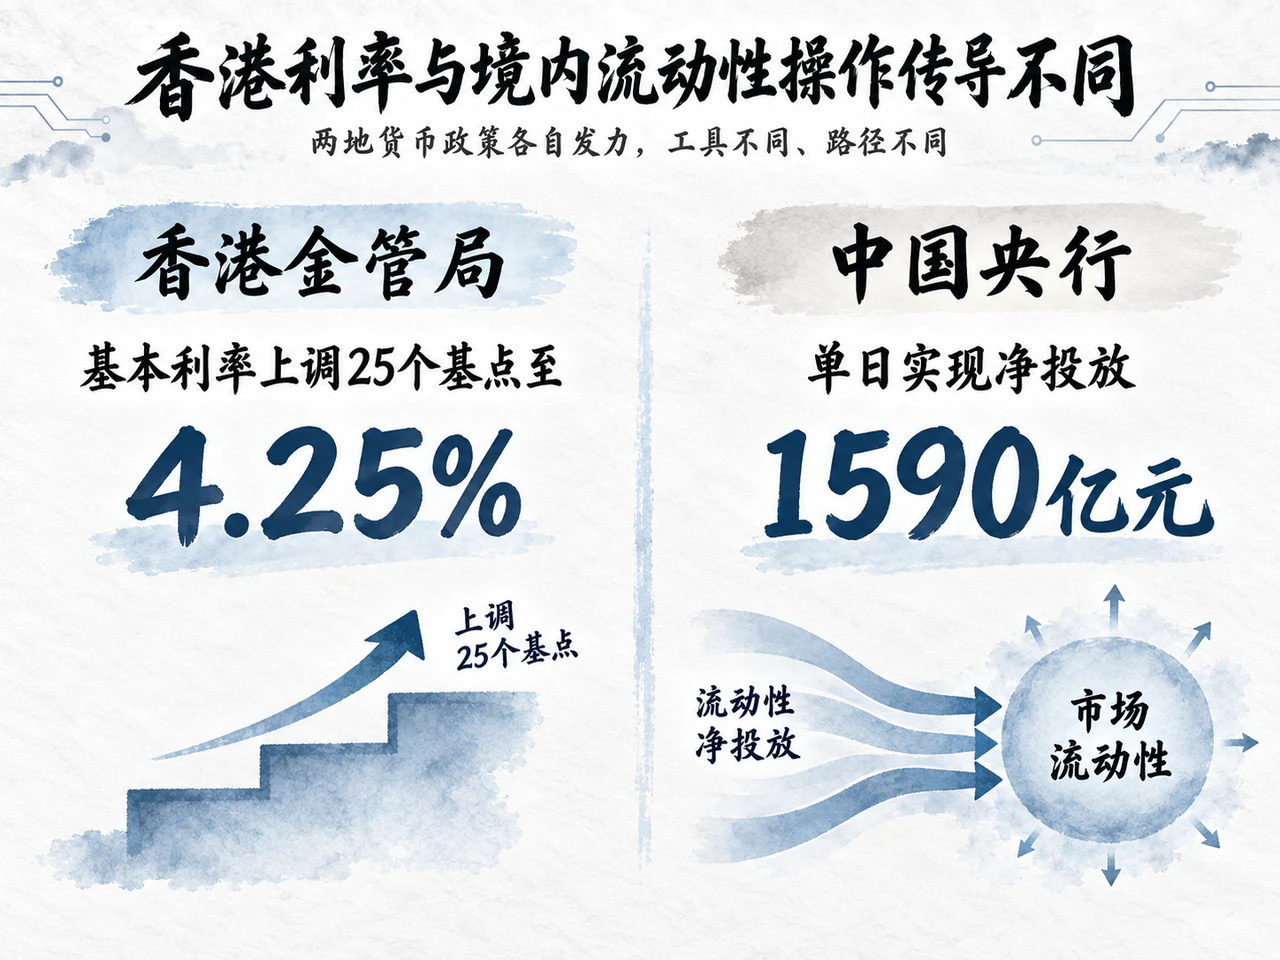
Global rate volatility elicited different policy and funding responses in Asia. Following the Fed's policy-rate adjustment, the Hong Kong Monetary Authority raised its discount-window Base Rate by 25 basis points to 4.25% on September 17. The Hong Kong dollar reached 7.8456 intraday, close to the 7.85 weak-side Convertibility Undertaking, highlighting continuing carry-trade pressure as Hong Kong–US interest-rate differentials widened.
The People's Bank of China focused on smoothing domestic interbank liquidity. On September 17, it conducted RMB 162 billion in 7-day and RMB 600 billion in overnight reverse repos, delivering a net RMB 159 billion injection to offset short-term funding gaps. The Commerce Ministry also detailed measures to promote smart-home consumption, emphasizing fewer barriers to use and replacement purchases.
Chinese corporate financing continued diverging between offshore and onshore markets under the combined constraints of Treasury benchmarks and credit spreads. Offshore, Duration Finance recorded no new Chinese US-dollar bond issue that day. Onshore, financing channels for higher-quality private developers continued advancing: Seazen planned up to RMB 400 million in domestic corporate bonds, while Longfor's RMB 2.73 billion small public-offering project moved to accepted status. Lower benchmark Treasury yields offered some cost relief, but credit-spread differentiation and currency-hedging costs would still determine realized funding conditions.
Geopolitical tariff expectations affect energy trade as Turkey introduces liquidity support

Beyond routine data, markets watched geopolitical policy shifts and localized liquidity risks. The US Congress passed a Russia-related sanctions bill proposing to authorize the president to impose punitive tariffs of up to 100% on countries hosting third-party entities that continued buying Russian oil and gas. The bill still awaited presidential signature. India promptly said it would continue diversifying energy procurement according to market principles.
In transatlantic trade, Canadian Prime Minister Carney told the European Parliament he supported deeper Canada–Europe cooperation across multiple fields and was actively assessing a proposed 'associate member' mechanism. With nearly 70% of Canadian exports dependent on the United States, the desire to diversify markets was strong. Markets nevertheless continued assessing the policy premium while trade arrangements remained undefined and potential US tariff threats had yet to materialize.
In emerging markets, Turkey experienced a localized fund-liquidity run. With some funds facing redemption pressure, the central bank urgently increased its open-market repo limit to TRY 300 billion, while regulators reduced the minimum maintenance collateral ratio for margin financing and securities lending from 35% to 20%. At the time of reporting, the main Turkish equity index had rebounded 2.6% intraday but remained down 6.9% for the week.
A regulatory microstructure development also arrived: the US SEC issued temporary exemptive relief for compliant tokenized-stock trading, permitting a trial of automated market making subject to specified limits, equal-rights protections and synchronized trading-halt requirements. This created a policy observation window for future market-structure development.
The September 17 recovery in global markets rested on the intersection of easing energy-supply concerns, lower Treasury yields and AI-sector orders. Persistent manufacturing costs, the pressure of high rates on final demand and differentiated overseas liquidity nevertheless meant that a sustained asset-price uptrend still required more decisive signals of a turn in inflation and financing conditions.


