Statistical revisions lowered US inflation readings, but rebounding energy prices and elevated core-services increases left actual inflation pressure substantial.
BEA data released September 30 show August 2026 headline PCE prices up 3.4% year on year and core PCE up 3.0%. Annual revisions released with the report lowered July's previously reported 3.3% annual core PCE rate to about 3.0%. The below-expected readings eased pressure for further hikes, but a substantial part of the change came from statistical methods and historical revisions.
On the same revised basis, inflation genuinely cooled during the summer, but turned less favorable again in August. Energy rose anew, increases in medical and other services remained slow to narrow, and consumption stayed resilient. The Fed can therefore slow its hiking pace and give existing policy more time, while a move to cuts requires more sustained improvement.
Historical Revisions Lower Inflation, but Summer Cooling Remains Uneven
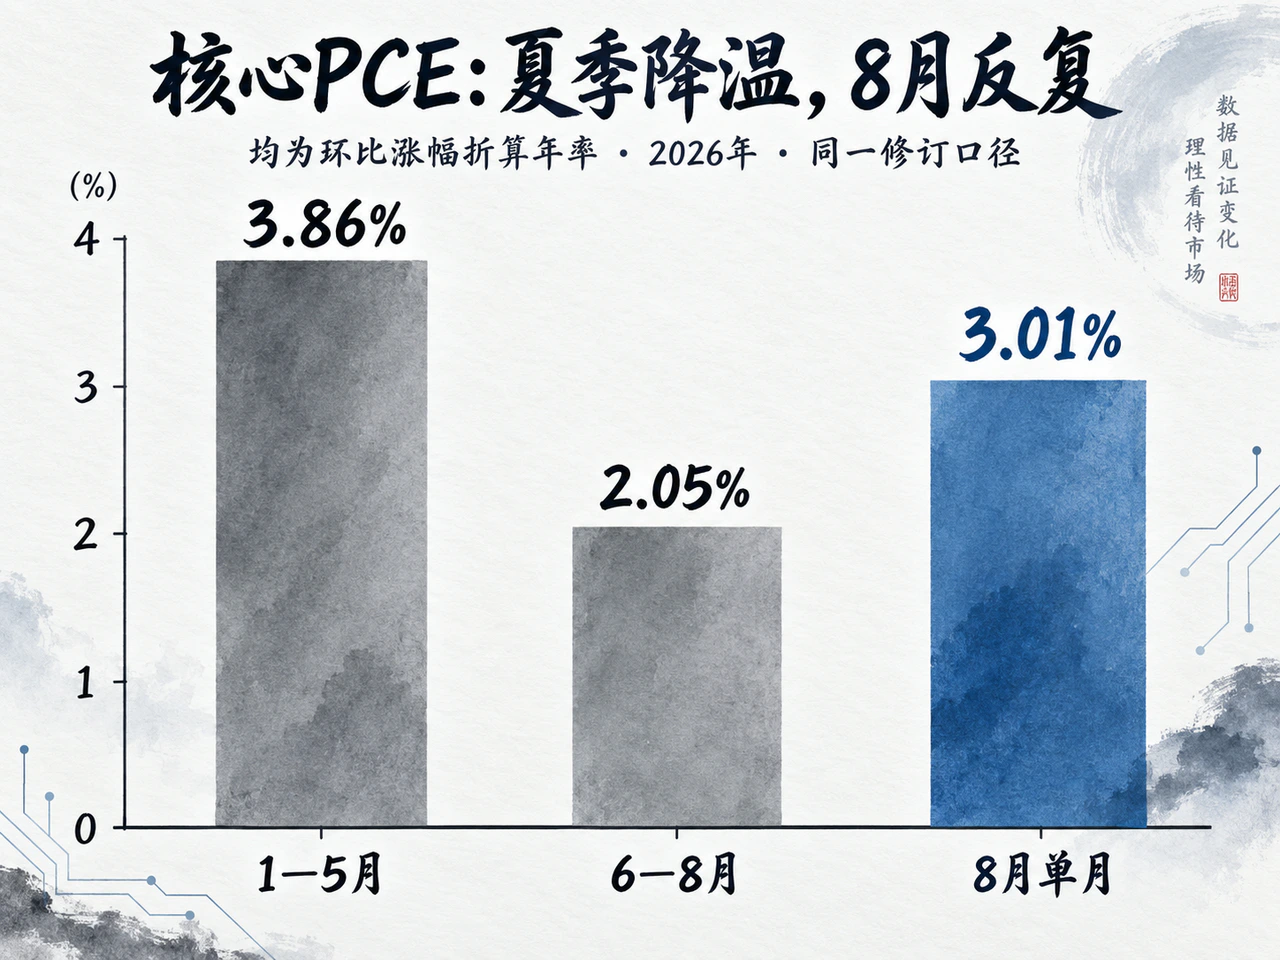
The revisions first changed our estimate of past inflation.
Reuters reported that July's annual core PCE rate was revised down about 0.36 percentage point overall, mainly because of portfolio-management services. The previously reported 3.3% became about 3.0%, with August also near 3.0%. The roughly 0.3-point gap therefore cannot all be treated as new disinflation achieved in August.
The BEA changed three price-calculation methods.
Portfolio management and advisory services previously used the relevant PPI to deflate nominal spending. The new method first estimates service quantity from industry employment, then infers prices using nominal expenditure. From 2024, legal services use a household-consumption-related PPI component instead of the less reliable legal-services CPI. Computer software and accessories no longer rely solely on CPI, adding PPI measures for gaming software, hosting and IT infrastructure services to reflect actual consumption more closely.
The annual update revised data back to 2021. The index reference year remained 2017 and the Fed's 2% target did not change. Better methods improve measurement, but employment and similar measures remain proxies for service quantities, and productivity and business-mix changes may affect estimates. Lower historical readings mean earlier pressure may have been overstated, rather than households' gasoline, airfare and medical bills actually shrinking.
On a consistent revised basis, annual headline PCE rose from 2.73% in January to 3.82% in May before retreating to 3.42% in August. Core PCE varied much less but stayed near 3%, without returning sustainably to 2%.
Recent improvement also matters. January–May's cumulative core PCE increase annualizes to approximately 3.86%, versus 2.05% in June–August and 2.74% over the six months through August. All use the same revised series, showing summer cooling was not entirely statistical.
The problem is that August core PCE rose approximately 0.247% month on month, officially rounded to 0.2% but equivalent to about 3.01% annualized, above June and July. As low June inflation leaves the rolling window, even a September monthly increase of 0.25% would lift the three-month annualized rate to around 2.52%, assuming no further historical revisions. A short-term annualized rate near 2% does not yet establish a sustained return to target.
Demand had not clearly weakened either. August real disposable income was essentially flat, yet real consumption rose 0.6% month on month and the saving rate fell from July's 4.6% to 4.1%. Households were still spending more, giving the Fed reason to await clearer cooling.
Energy Drives This Year's Inflation Increase, but Services Still Contribute Most
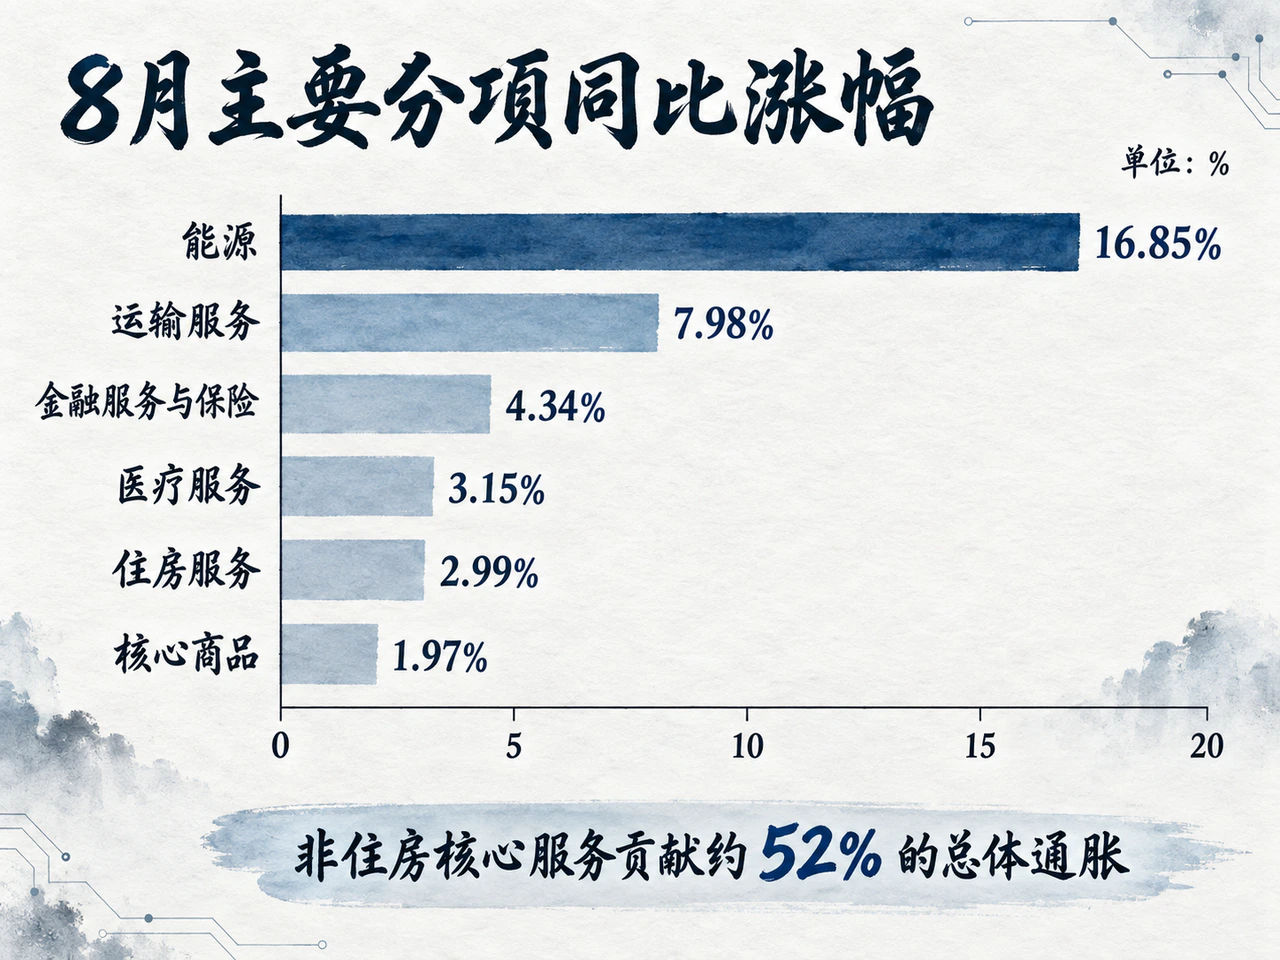
Why inflation rose this year and where its current level mainly comes from are separate questions.
San Francisco Fed decomposition shows annual headline PCE rising about 0.69 percentage point from January to August. Food and energy's contribution increased about 0.62 point, explaining roughly 90% of the net rise. Food was relatively moderate, making energy the main driver.
Services nevertheless contributed most to August's inflation level. Nonhousing core services contributed around 1.78 percentage points to annual headline PCE, about 52% of the total, and approximately 1.99 points to core PCE, roughly two-thirds of core inflation.
| Main component | August expenditure share | January annual inflation | August annual inflation | August monthly inflation |
|---|---|---|---|---|
| Energy goods and services | 3.88% | −0.99% | 16.85% | 2.31% |
| Food and beverages purchased for off-premises consumption | 7.05% | 2.10% | 1.92% | 0.03% |
| Core goods | 21.85% | 1.72% | 1.97% | 0.03% |
| Housing services | 15.64% | 3.18% | 2.99% | 0.19% |
| Health-care services | 17.31% | 3.15% | 3.15% | 0.22% |
| Transportation services | 3.45% | 3.30% | 7.98% | 1.44% |
| Food services and accommodation | 7.12% | 3.13% | 3.26% | 0.48% |
| Financial services and insurance | 8.05% | 5.27% | 4.34% | 0.21% |
Expenditure shares are shares of August nominal consumption, not exact contributions to annual inflation. Core goods exclude food and energy. Food services belong to core services, not the excluded food category. The table does not cover all consumption.
Energy represented less than 4% of consumption but rose 16.85% year on year in August; gasoline and other energy goods rose 27.93%. Falling energy prices helped lower headline inflation in June–July, but August's rebound showed that improvement was not yet secure.
Core goods were much milder, rising only about 0.03% in August and around 0.9% annualized over the latest three months. Under the new method, software and accessories were still up 15.61% year on year but fell 1.53% during August. High annual inflation can coexist with recent declines, so a high annual rate alone does not establish continuing acceleration.
Services also differed substantially. Annual housing inflation had slowed to 2.99%, with the latest three-month annualized rate around 2.70%; medical inflation remained 3.15%, close to its early-year level. Transportation accelerated from 3.30% early in the year to 7.98%, with air transport reaching 19.45%. Food-service inflation slowed from 3.92% to 3.30%. Accommodation rebounded in August after several weaker months. Taken together, these changes establish neither broad service disinflation nor acceleration in every service industry.
Why Core Services Cool Slowly
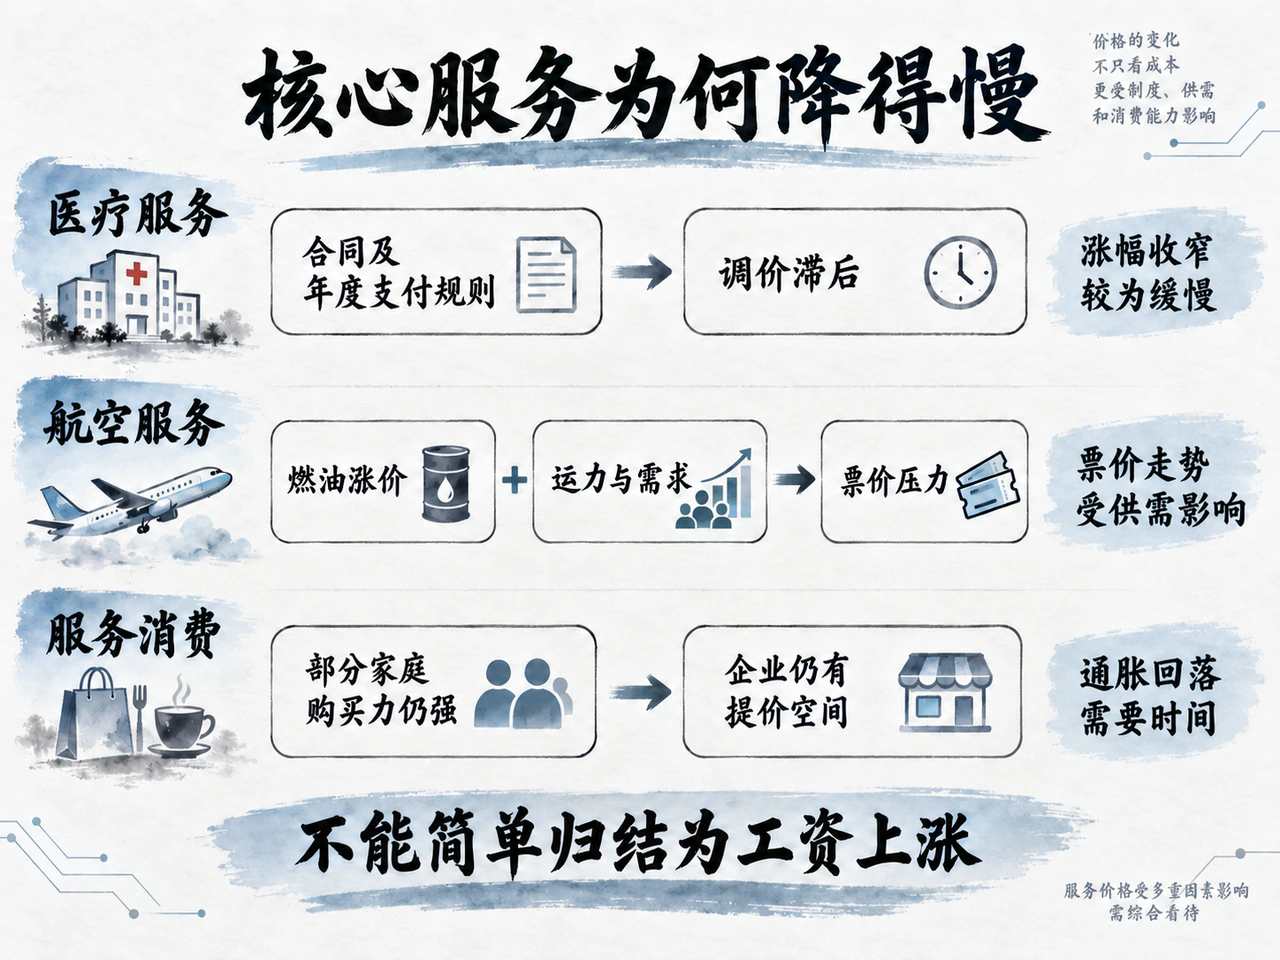
Stubborn core-services inflation cannot simply be attributed to excessive wage growth. Hospitals, airlines, restaurants and financial institutions price differently, with different lags from costs to prices. Medical services depend more on contracts and payment standards; aviation depends on fuel, capacity and demand; financial services include distinctive fee arrangements and statistical estimates.
Housing has improved but adjusts slowly. Changes in new-lease rents enter the broader market gradually as existing leases expire and renew, so measured housing-service prices do not track the latest asking rents immediately. August annual housing inflation had fallen to 2.99%, with roughly 2.70% three-month annualized growth, helping reduce core inflation. Housing accounts for about 16% of consumption, so sustained cooling can materially ease pressure, but normally does so gradually.
Slow medical repricing first reflects charging rules. Hospital revenue depends on commercial-insurer contracts and government payment standards such as Medicare. Commercial contracts are renegotiated periodically, while government rates normally follow annual updates. Hospitals may not immediately raise prices when costs increase, and previously agreed adjustments can still take effect after cost growth slows. Brookings research uses these mechanisms to explain why medical prices often lag other inflation.
The 2026 rules provide an example. CMS set a 2.6% annual outpatient payment-rate update for hospitals meeting relevant quality-reporting requirements, calculated as a 3.3% input-cost market-basket increase less a 0.7-percentage-point productivity adjustment. This is not inflation for the whole medical PCE category, but shows some medical charges follow predetermined rules and are insensitive to that month's interest-rate changes. Medical services account for about 17% of consumption, so even unchanged inflation slows core disinflation if it fails to narrow. Contracts and payment rules explain persistence, but do not establish that all of August's 3.15% medical inflation was delayed pass-through of past costs.
Transportation pressure is more direct and more responsive to supply and demand. Fuel increases airline expenses, but pass-through depends on available seats and willingness to buy tickets. Delta's second-quarter results showed adjusted fuel expense up 77% year on year, with capacity up only about 1%. Adjusted total unit revenue rose 12.4% and premium-cabin revenue 17%. This is one company's experience, and unit revenue reflects cabin and business mix rather than pure fares, but it indicates support from limited capacity growth and strong demand alongside high fuel costs.
It follows that falling oil need not immediately produce an equal airfare decline. Sustained transport disinflation also depends on capacity growth and softer demand. Air-price increases made transportation an important source of service inflation this year, but the data cannot precisely allocate the rise among fuel, capacity and demand.
Financial-service prices do not fully correspond to visible household charges. Some asset managers charge based on assets under management; rising asset prices can increase nominal fees even with unchanged fee rates. PCE must distinguish greater service quantities from higher prices, and the revision changed one such estimate. Revised August portfolio-management and advisory prices still rose 8.60% year on year; financial services and insurance rose 4.34%, below January's 5.27%. This component still contributed inflation without continuing to accelerate. Its entire rise cannot be attributed to stocks or treated as proof of equal wage pressure across national services.
Wages naturally affect labor-intensive industries such as restaurants, but wage growth is not unit labor-cost growth. More output per employee can offset part of a pay increase. Continued price increases also depend on customer acceptance. Food-service inflation slowed from 3.92% early in the year to 3.30%, which does not support renewed acceleration across all labor-intensive services.
On September 29, New York Fed President Williams said there was no evidence that the labor market was adding inflation pressure. San Francisco Fed research using state data from 2009–2021 also found a generally weak relationship between nonhousing core-services inflation and local labor markets, strengthening temporarily early in the pandemic. Historical research cannot explain every component this year, but combined with current data it does not justify describing elevated services inflation as another broad wage-driven wave.
Supported demand also slows disinflation. Williams noted that rising equities supported spending by high-income households and homeowners. August's 0.6% real-consumption increase likewise did not suggest sudden aggregate-demand contraction. This does not mean every household was comfortable; high rates affect groups differently. Consumers with purchasing power still buying services allow some businesses to keep raising prices.
For rate hikes to affect these prices, consumption and orders often must slow first. Firms then find that further increases lose customers and become more cautious about hiring, pay and prices. Hikes do not immediately alter hospital payment contracts or directly reduce jet-fuel costs. Service disinflation therefore needs smaller medical-contract and payment updates, improved transport costs or supply-demand conditions, and demand that no longer supports frequent increases. These changes occur at different speeds, preventing a rapid, one-step disinflation.
Hikes Can Wait, but Views Differ on When They End
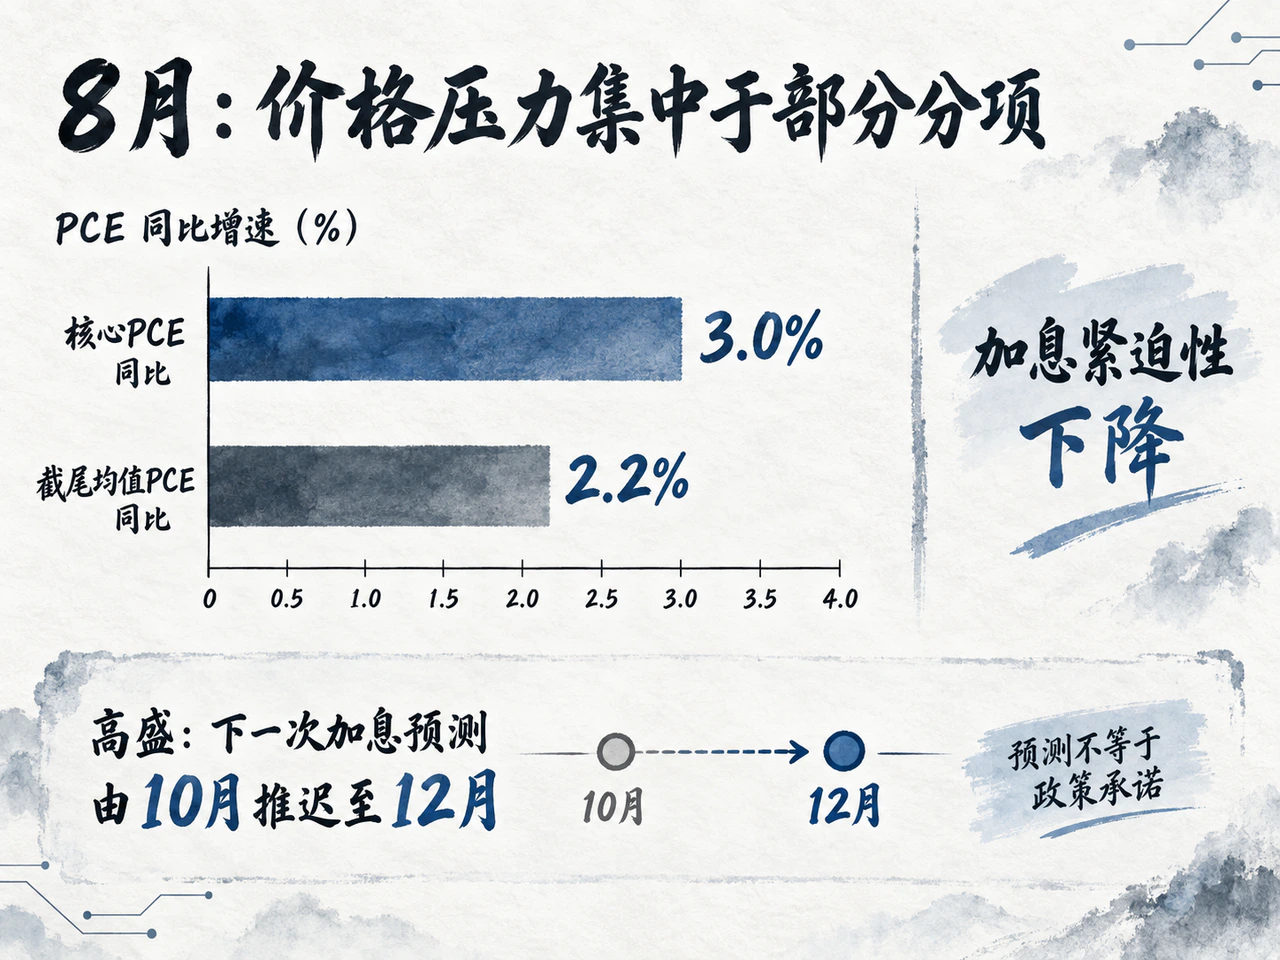
One favorable sign is that pressure has not spread universally. Dallas Fed trimmed-mean PCE excludes both tails of each month's component price changes. August rates were 2.2% year on year, 2.3% annualized over six months and 1.9% annualized for the month, all below ordinary core PCE. Elevated inflation was therefore substantially concentrated in selected components, insufficient to establish broad acceleration. This indicator cannot identify each component's cause, however, and potential spillover still requires monitoring.
Mainstream reporting after the release likewise did not treat lower readings as a solved inflation problem. CNBC emphasized the undershoot while noting revisions to historical data. Barron's pointed out that August did not yet capture September's latest diesel increase. Both distinguish easing immediate hike pressure from disappearing inflation risk.
Banks disagreed on the subsequent policy path.
After the report, Goldman Sachs moved its next-hike forecast from October to December and saw a substantial chance of no further increases. It also cut its fourth-quarter annual core PCE forecast to 3.0%.
BMO argued that October could be skipped, but economic and consumption resilience supported one more hike before year-end. Santander said two months were insufficient to confirm a new trend, particularly with August monthly inflation already rebounding, though little additional tightening might be needed. Citi emphasized high energy costs eroding real income and weighing on future consumption.
In a post-release interview, Wells Fargo strategists expected potentially one hike this year and three next year, chiefly worrying about energy-cost pass-through along supply chains. This was the bank's strategy-team view and illustrated the stronger tightening expectations still present in markets.
JPMorgan Asset Management's David Kelly had argued on September 21, before this release, that differences between PCE and CPI partly reflected shelter weights and measurement of software, finance and motor insurance. He expected more PCE cooling if energy normalized and rents and wages stayed moderate, and forecast one December hike followed by a 4.00%–4.25% range throughout 2027. The revisions supported some of his observations about statistical differences, but his subsequent inflation and rate forecasts still required verification.
Overall, evidence for slowing hikes had increased: recent core goods were moderate, housing was cooling and trimmed-mean inflation was closer to target. Evidence for immediate cuts remained insufficient: medical inflation had not narrowed clearly, transportation was strong and consumption had not materially weakened. My baseline remained limited tightening followed by extended observation, rather than consecutive large hikes or rapid cuts.
The Form of Disinflation Will Determine the Pace of Rate Changes
On September 16, the Fed raised its funds target to 3.75%–4.00%. Its statement described solid activity, employment growing in line with labor supply, little change in unemployment and still-elevated inflation, explicitly linking the hike to a more timely return to 2%. Without substantial employment deterioration, inflation was indeed the main reason to tighten further.
The dual mandate also requires attention to employment. Higher energy raises prices and erodes real income. If high prices and funding costs ultimately weaken consumption, investment and hiring substantially, the balance changes: cuts may begin before annual inflation reaches 2%. Rates restrain demand and second-round pass-through, but cannot directly add refining capacity. Overreacting to a temporary supply shock can impose unnecessary employment costs.
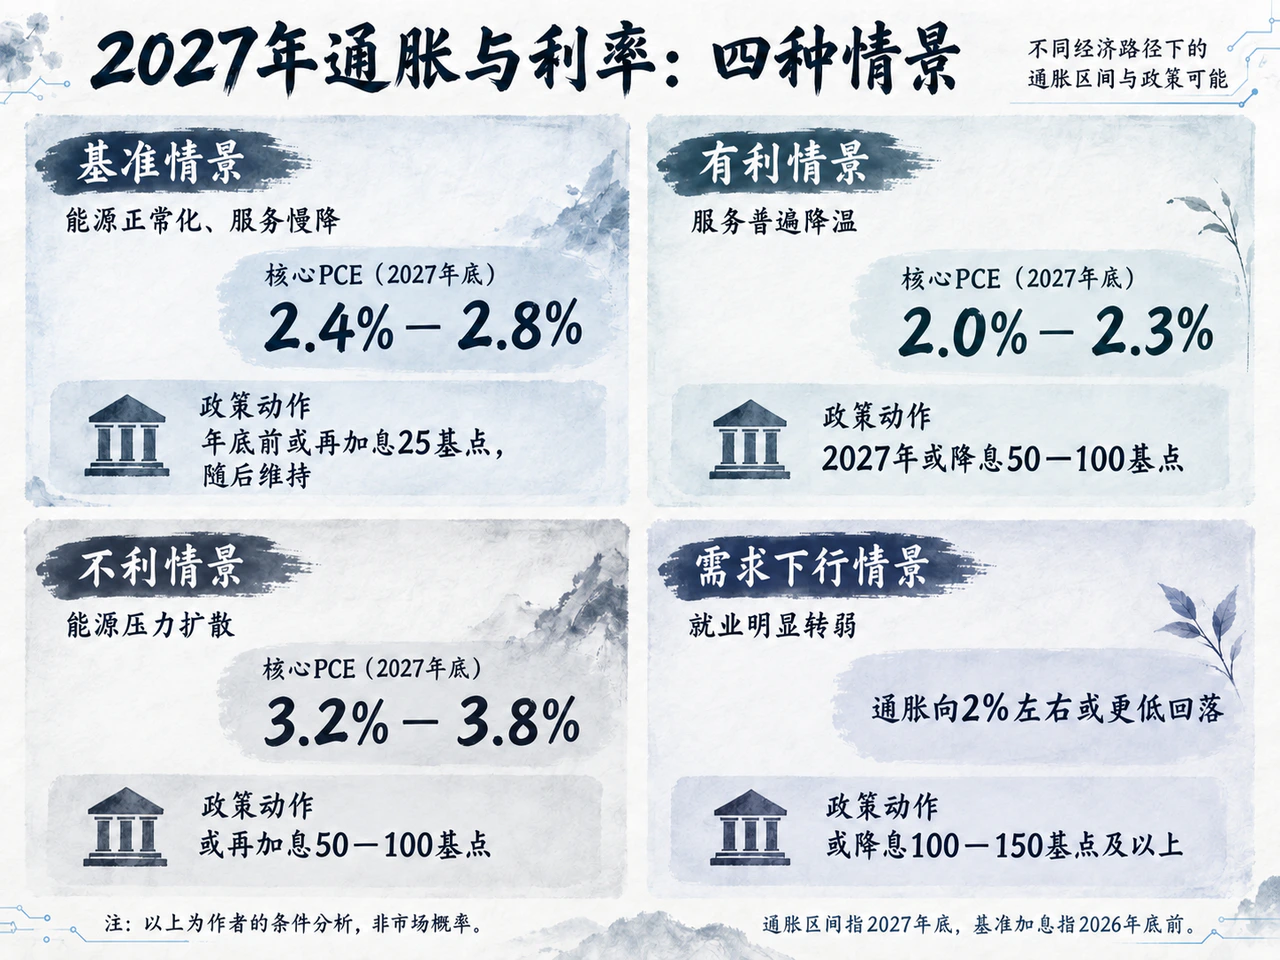
Four scenarios can be considered over the next 12–15 months. The table is this article's conditional analysis, not bank consensus or market-implied probabilities. All rates refer to the federal funds target range.
| Scenario | Inflation path | Possible rate path |
|---|---|---|
| Baseline: energy gradually normalizes and services cool slowly | Housing keeps slowing, transport pressure eases, and demand slows without recession. Annual core PCE is approximately 2.4%–2.8% at end-2027. | A strong case for an October pause; another 25-basis-point hike to 4.00%–4.25% remains possible before year-end, followed by an extended hold. |
| Favorable: more service components cool | Energy falls, core goods stay moderate and nonhousing services slow together. Core PCE is around 2.0%–2.3% at end-2027, with short-term annualized rates also sustainably near 2%. | Further hikes may be unnecessary, followed by gradual cuts of about 50–100 basis points in 2027, depending also on employment and the neutral-rate assessment. |
| Adverse: energy pressure keeps spreading | Transport and other services repeatedly raise prices while demand stays strong or expectations rise. Core PCE remains around 3.2%–3.8% at end-2027, or rises again. | A further 50–100 basis points from current levels: 50 points would mean 4.25%–4.50%, and 100 points 4.75%–5.00%, held high for longer. |
| Demand downturn: employment weakens materially | Real income is squeezed, savings support weakens and hiring deteriorates. Inflation subsequently falls toward 2% or below, though energy may still influence early headline readings. | Hikes stop and cuts may begin before inflation reaches target, totaling 100–150 basis points or more, depending on the severity of the downturn. |
The September dot plot put median rates for both 2026 and 2027 near 4.1%, corresponding to a 4.00%–4.25% target range and close to limited tightening followed by a hold. It predated these annual revisions, however, and used fourth-quarter annual inflation forecasts that cannot be compared directly with August's single-month annual rate. Dots are conditional judgments, not commitments.
The key measures now are whether three- and six-month annualized core PCE decline together, whether medical, transport and restaurant inflation slow persistently, and whether trimmed-mean inflation stays moderate. Ordinary core PCE converging toward the lower trimmed mean would strengthen evidence of cooling; a rising trimmed mean would warn that price increases are spreading. Consumption, wages, hiring and inflation expectations will determine how long the Fed can wait.
The inflation constraint has eased but remains. Revisions reduced previously estimated pressure and genuine cooling occurred over the summer, yet energy and some services leave that improvement insecure. Rates depend first on sustained disinflation, while materially rising employment risks would alter the dual-mandate balance. Only by combining prices and employment can one judge when to wait, when to hike again and when cuts become appropriate.


