From September 28 to October 4, 2026, global markets combined improving near-term policy expectations with tighter long-term financing constraints. Inflation and employment data substantially eased concern about imminent Fed increases, yet long borrowing costs rose: by October 2 the 10-year Treasury yield was up 11 basis points from the previous week-end to 5.28%. The dollar strengthened and gold fell 3.68%. Recovering oil supply pulled crude off its highs without bringing long yields down. Within equities, technology leaders' guidance and capital-return plans helped the Nasdaq 100 rise against the trend, while financials and traditional industries struggled.
These cross-asset moves showed that revised short-term policy expectations had not produced broad financial easing. U.S. consumption remained resilient, payroll and wage growth slowed, and production costs remained under pressure. With long-term funding expensive, companies' ability to absorb interest burdens through genuine earnings growth and steady cash flow became central to divergence in equities, credit and Asian supply chains.
Easing hike expectations fail to restrain long yields: the 10-year rises 11 basis points as credit spreads widen
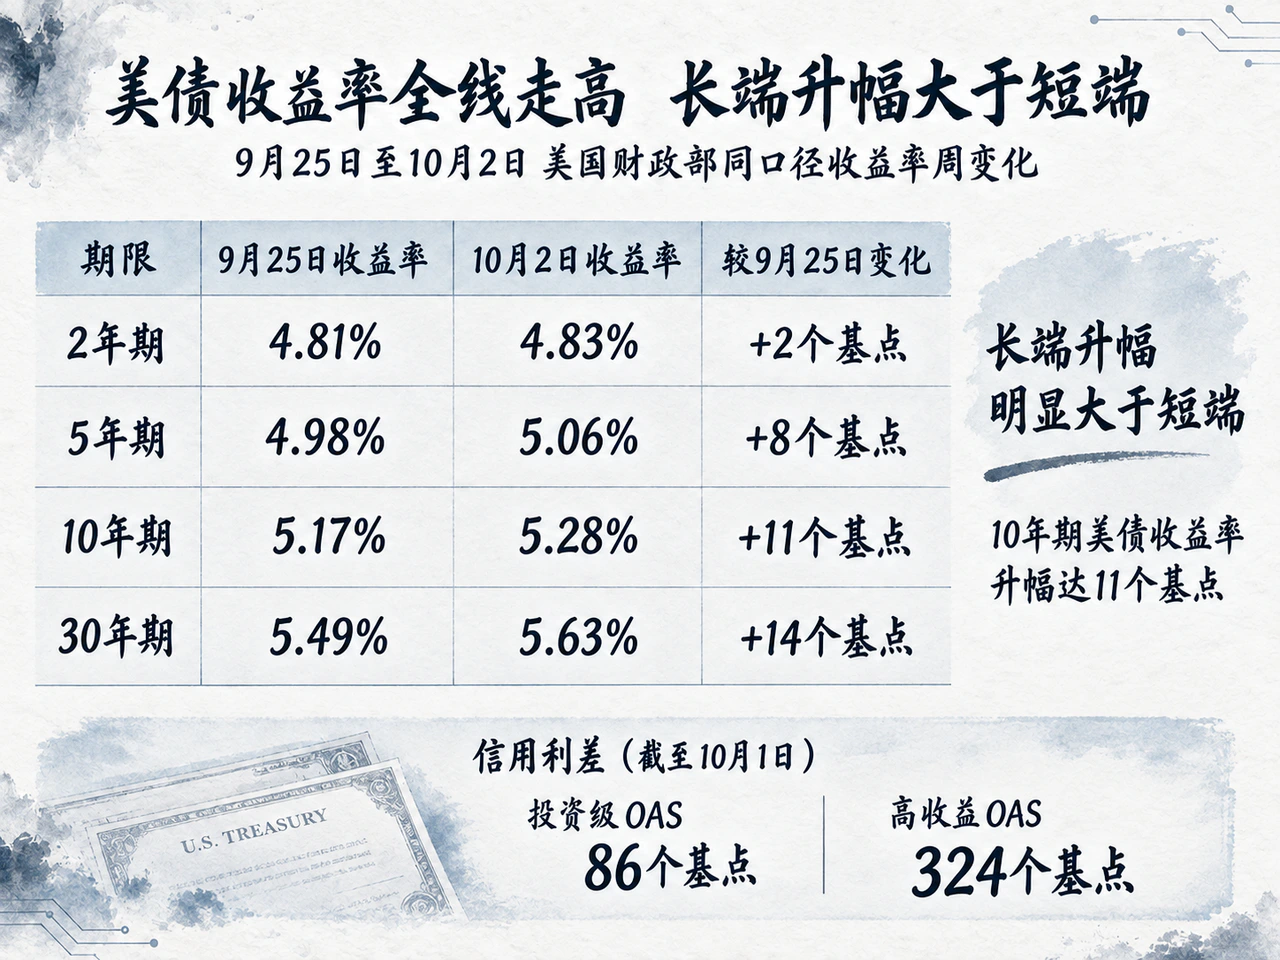
The Treasury's consistent daily yield curves from September 25 to October 2 showed yields rising across maturities, with larger long-end increases producing a bear steepening.
| Maturity | September 25 yield | October 2 yield | Weekly change |
|---|---|---|---|
| 2-year | 4.81% | 4.83% | +2 basis points |
| 5-year | 4.98% | 5.06% | +8 basis points |
| 10-year | 5.17% | 5.28% | +11 basis points |
| 30-year | 5.49% | 5.63% | +14 basis points |
The 2-year yield rose only 2 basis points overall, masking sharp swings: it reached 4.92% on Monday, fell to 4.78% Thursday and closed Friday at 4.83%. Reuters reporting put October hike odds at about 70% at its September 28 observation and about 21% after the October 2 jobs report. The abrupt policy reassessment pulled short yields off their highs in the second half of the week without reversing weakness farther along the curve.
The 10-year yield touched 5.29% Wednesday and still ended at 5.28%, up 11 basis points. The 10-year/2-year spread widened from 36 to 45 basis points. Higher real rates drove the long-end pressure: the Treasury's 10-year real par yield rose 9 basis points from 2.83% to 2.92%. The nominal–real par-yield difference edged up only from 2.34 to 2.36 percentage points. Inflation expectations alone could not explain the long-yield rise; broader funding costs, including risk compensation and liquidity constraints, had increased.
Credit compounded corporate financing constraints. By Thursday, October 1, the ICE BofA U.S. investment-grade corporate option-adjusted spread had widened 5 basis points from September 25 to 86 basis points; the high-yield equivalent widened 31 to 324. Rising risk-free benchmarks and credit premiums squeezed leveraged businesses and those with concentrated refinancing needs.
Concentrated primary issuance directly affected pricing. MarketWatch and Bloomberg Businessweek reported that Paramount Skydance's $5.25 billion, 10-year investment-grade acquisition-financing bond priced at Treasuries plus 262.5 basis points, widening to 278 basis points in secondary trading on October 1. Large issuance, acquisition leverage and rate volatility affected absorption. Deutsche Bank's September 29 research nevertheless argued that resilient fundamentals, insurer demand and attractive all-in yields supported credit. It saw supply-driven spread widening more as temporary overshooting than broad credit deterioration.
Congress's temporary funding bill extended government operations to December 11, removing a shutdown risk at the new fiscal year's start without easing long-term constraints from bond supply. Lower short-term hike fears, rising long real yields and wider credit premiums together formed the macro backdrop for divergent assets.
Demand and consumption remain resilient as payroll growth slows and manufacturing costs stay sticky
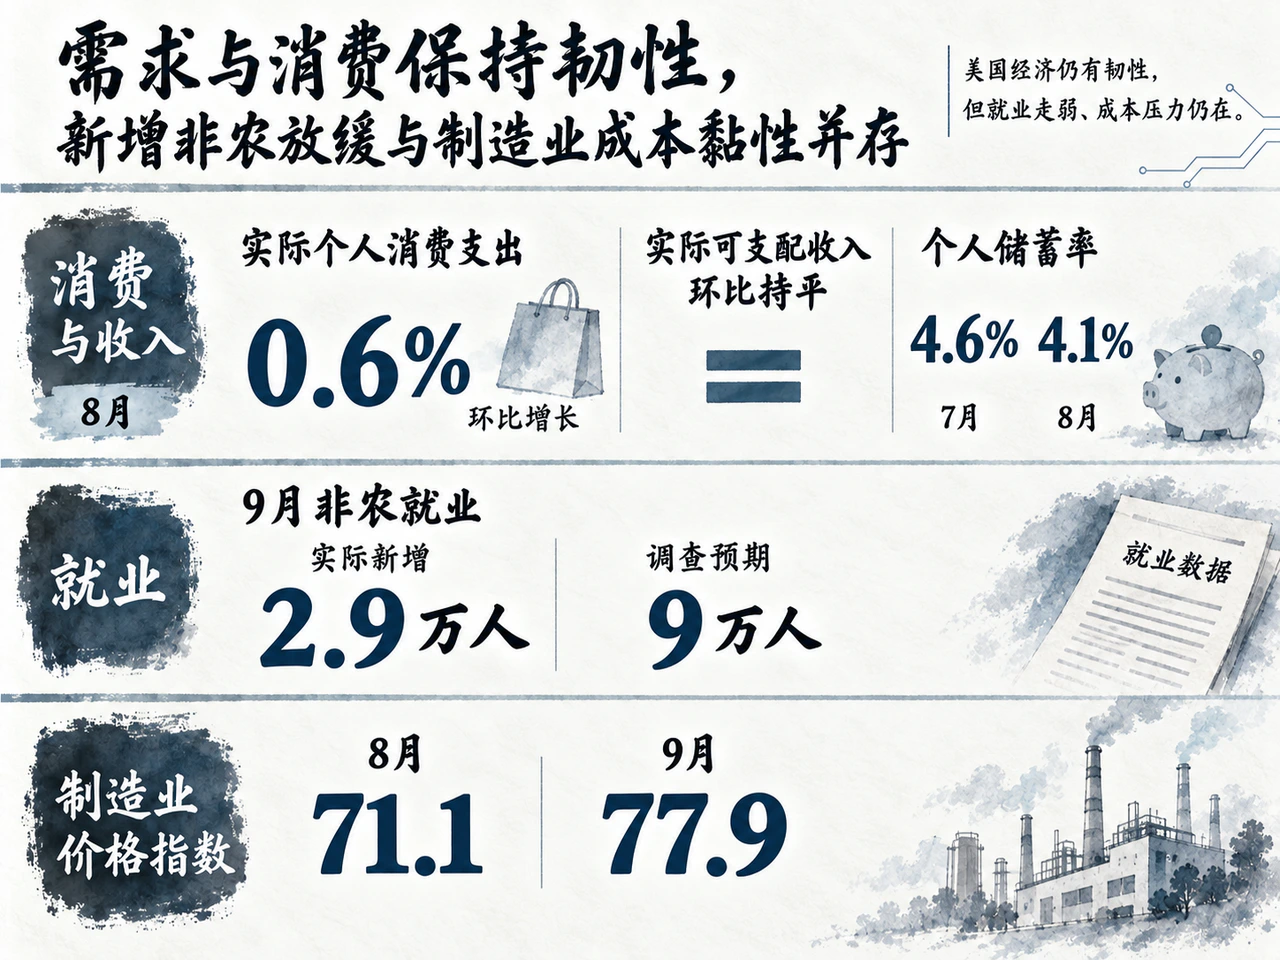
The week's U.S. data were mixed. Final figures released September 30 revised second-quarter annualized real GDP growth sharply from 1.5% to 2.2% and real private domestic final purchases from 4.2% to 4.6%. August real PCE, released the same day, rose 0.6% monthly, confirming resilient end demand. Spending outpaced income, however: real disposable income was flat, and the saving rate declined from July's 4.6% to 4.1%.
Labor data combined weakness with returning labor supply. September payrolls released October 2 rose only 29,000, far below the Reuters consensus of 90,000, while July and August gains were revised down by a combined 60,000. Average hourly earnings rose 0.1% monthly and 3.0% annually, both slower than August. Cooling wages eased wage-inflation pressure but raised concern about future consumption support. The household survey, however, showed employment up 406,000 and the labor force up 485,000, taking participation to 61.8%. Unemployment edged from 4.1% to 4.2%, mainly because new entrants had not been fully absorbed rather than deep layoffs. One weak payroll month did not establish an approaching recession.
Inflation mixed disinflation with pockets of persistence. August headline PCE prices rose 0.3% monthly, below the 0.4% Reuters consensus; core PCE rose 0.2%. Annual headline and core rates were 3.4% and 3.0%, unchanged from revised July figures; annual benchmark revisions had lowered some historical readings. Forward-looking business surveys showed incomplete cost relief. September ISM manufacturing PMI, released October 1, was 54.5 versus August's 54.6. New orders rose from 53.7 to 55.3, indicating continued demand expansion, while the prices index jumped from 71.1 to 77.9, meaning more firms reported rising input prices. Respondents widely cited tariffs, fuel transport costs and constrained materials supply chains. Slower jobs and wages reduced the urgency of an immediate Fed increase, but resilient consumption and rigid production costs limited confidence in sustained smooth disinflation.
Technology guidance supports a 0.65% Nasdaq rebound as hardware competition and demand concerns deepen divergence
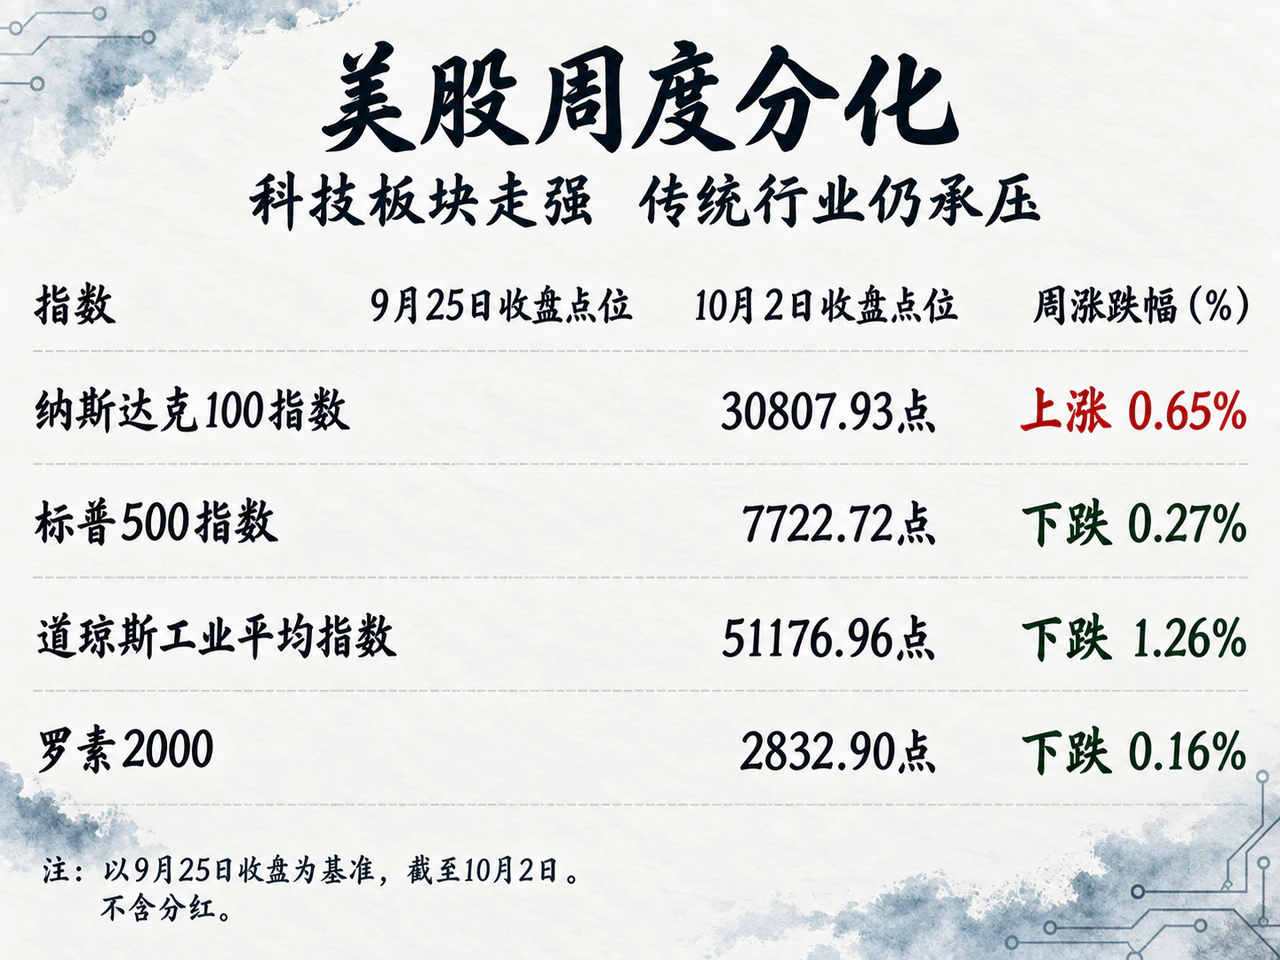
Major U.S. indexes diverged despite rising long yields. From the September 25 close to October 2, the Nasdaq 100 gained 0.65% to 30,807.93, recovering for four consecutive sessions after Monday's low. The S&P 500 fell 0.27% to 7,722.72, the Dow lost 1.26% to 51,176.96 and the Russell 2000 slipped 0.16% to 2,832.90. Their late-week rebounds failed to recover early losses fully. Implied volatility rose modestly: VIX closed at 15.31, up 0.44 from the previous week-end.
Sector ETFs further revealed differences in rate sensitivity and earnings power, using dollar closing prices excluding dividends. XLK gained 1.80%, XLE 1.26%, while XLF, exposed to yield and credit conditions, fell 2.46%. Technology resisted higher real-yield valuation pressure mainly because leaders supplied operating certainty and capital-return commitments.
Nvidia announced an additional $150 billion buyback authorization on September 28, bringing remaining authorization to $235 billion, expected to be completed by fiscal 2028 year-end. Micron gave stronger-than-expected guidance. Reuters reported after September 30 trading that it expected fiscal first-quarter 2027 revenue of $61.5 billion, plus or minus $1.5 billion, above LSEG's $57.02 billion analyst average. Customer financial commitments under long-term supply agreements rose from $22 billion in June to $32 billion, mostly cash deposits, and agreements covered most 2027 HBM output. Micron rose 3% on October 1, reinforcing confidence in actual AI hardware orders.
Competition within AI hardware disrupted broad gains. TrendForce, citing Nikkei, reported Toshiba planned approximately ¥60 billion to expand Philippine facilities and double AI data-center hard-drive capacity during fiscal 2027. Expected supply competition quickly weighed on incumbents. Reuters reported Western Digital and Seagate each fell approximately 10% on October 2, showing strong advanced-memory demand could not be extrapolated to every storage company.
Consumer-facing results supported the slowdown picture. Nike's fiscal first-quarter 2027 results, for the period ending August 31 and released October 1, showed revenue down 4% to approximately $11.2 billion. Gross margin rose 60 basis points to 42.8%, but guidance for a high-single-digit full-year revenue decline sent shares down 3.6% the next day. Breadth deteriorated: on October 2 only 57 Nasdaq stocks hit 52-week highs versus 224 lows, underscoring that an index rebound had not broadly restored risk appetite.
Policy and regulation pulled in both directions. Reuters on September 30 cited a senior FTC official saying an industry inquiry into AI developers including Anthropic and OpenAI would seek records and executive testimony; no penalties had been determined. This added possible compliance costs. Bipartisan senators agreed the same day on energy and infrastructure permitting reform to shorten approvals and ease grid and data-center delays, but a vote would wait until after the midterms. Neither had yet produced a direct, quantifiable short-term earnings effect.
Improving supply lowers oil; higher real yields and a stronger dollar push gold down 3.68%
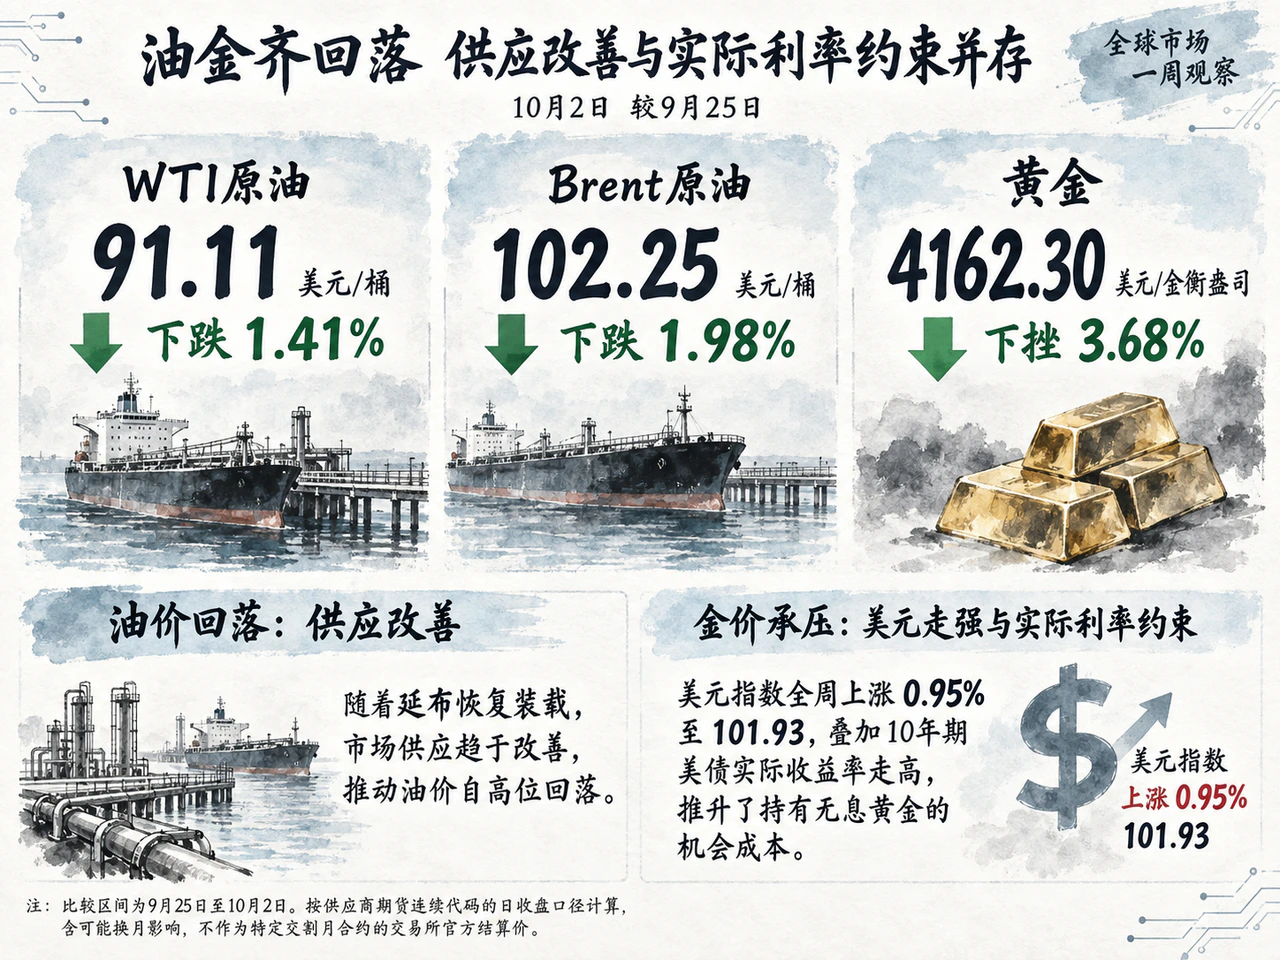
Commodities faced easing supply disruptions and tighter financial conditions. On a provider's continuous-futures daily-close basis, October 2 WTI was $91.11 a barrel, down 1.41% from September 25; Brent was $102.25, down 1.98%; gold was $4,162.30 per troy ounce, down 3.68%. Continuous contracts may roll and these figures are not official exchange settlements for a particular delivery month.
Oil's correction was concentrated early in the week. Brent fell from Monday's $105.28 to Tuesday's $102.59; WTI from $92.60 to $89.38. Reuters on September 29 cited trade sources and shipping data that Yanbu resumed tanker loading after Saudi Arabia's East–West pipeline restarted. Kpler showed Middle Eastern September crude exports recovering to 16.328 million barrels a day, easing fears of regional interruption. Product tightness nevertheless persisted. EIA data for the week ending September 25 showed commercial crude inventories up 900,000 barrels to 427.3 million, while refinery crude runs fell 554,000 barrels a day, potentially contributing to the build. Distillates fell 2.3 million barrels and were approximately 14% below the five-year seasonal average.
On October 2, the G7 announced an IEA-coordinated release of 100 million barrels of strategic reserves over four months, with substantial diesel released in the first 20 days. The arrangement related to March commitments, but country quotas, product detail and overlap with earlier volumes were unclear. Energy Aspects said specific binding implementation commitments remained insufficient. Friday's release expectations cannot explain oil selling that had already occurred early in the week.
Gold faced strong financial tightening. Most weekly losses came Monday; a midweek rebound was followed by another Friday decline. The dollar index rose 0.95% to 101.93, and the 9-basis-point rise in 10-year real Treasury yields raised the opportunity cost of non-yielding gold. Easing hike expectations offered temporary midweek support without removing that constraint. Morgan Stanley strategist Amy Gower said in October 1 reporting that gold's persistence above $4,000 an ounce despite high yields revealed demand beyond rates, so a single rate variable no longer fully explained pricing.
Weekend developments should be separated from the week's price moves. On October 4, seven OPEC+ members including Saudi Arabia and Russia kept November output targets at levels set in September. U.S. Energy Secretary Wright said the same day that diplomatic and military options toward Iran remained active. These subsequent developments concerned future navigation and production but cannot retroactively explain the preceding trading week.
Semiconductors lift Nikkei 2.93%; China's targeted support depends on orders and credit delivery
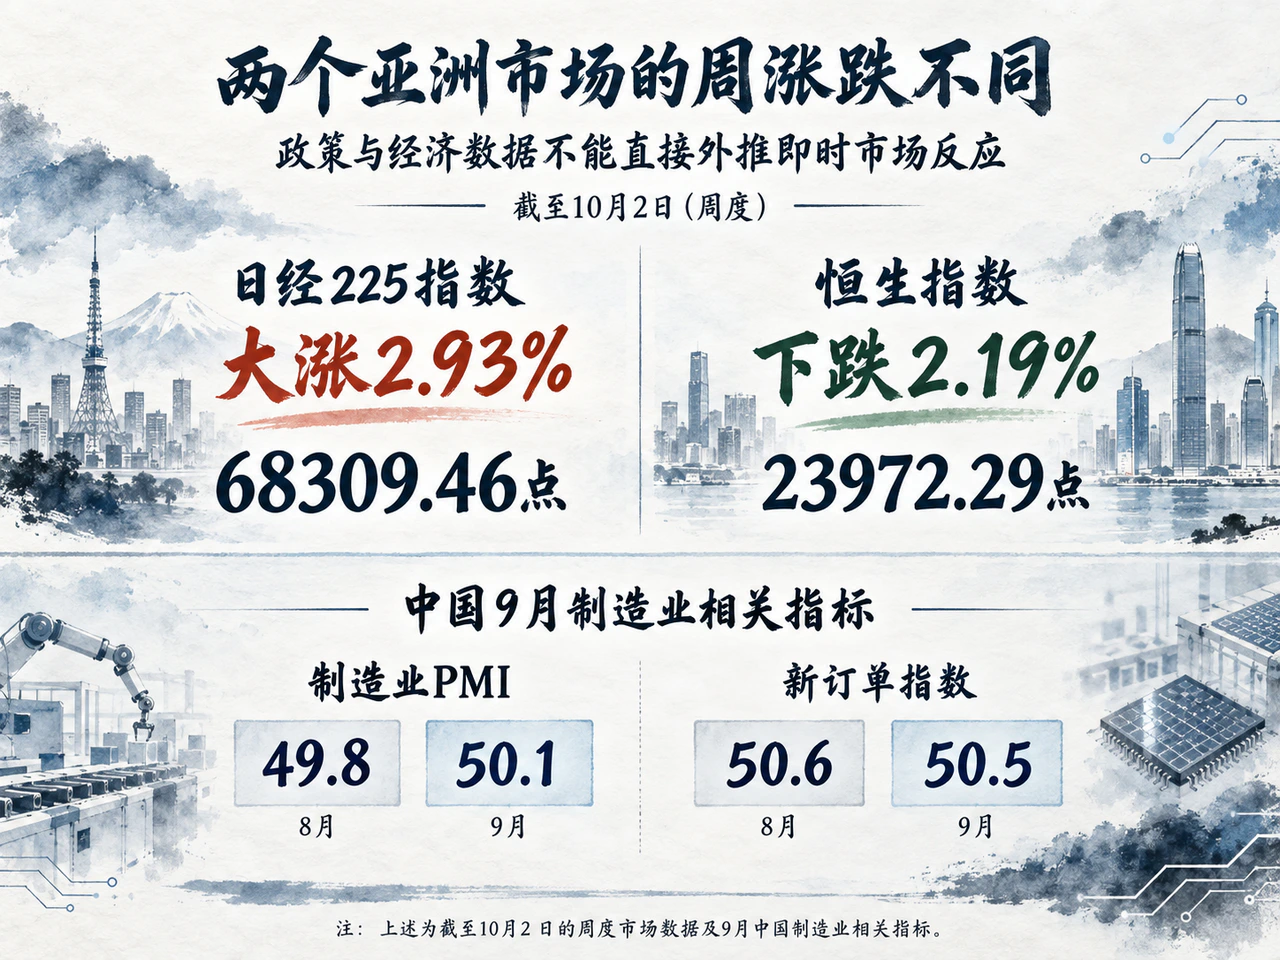
U.S. technology strength and higher global funding costs transmitted differently across Asia. Japan's semiconductor-linked market saw the Nikkei 225 gain 2.93% to 68,309.46 in the week ending October 2. It rose about 3.3% on October 1 versus TOPIX's 0.57%. Reuters reported Micron guidance helped Lasertec, Advantest and Kioxia surge 11.14%, 9.78% and 5.55%. Gains were highly concentrated: 108 Nikkei constituents rose and 116 fell that day. USD/JPY declined over the week from 158.811 to 157.927, meaning a stronger yen and ruling out passive gains from currency depreciation as the explanation.
Hong Kong faced high dollar rates' restraint on valuations and offshore liquidity, with the Hang Seng down 2.19% to 23,972.29. Although equities faced valuation limits, high-rated offshore borrowers retained access. The HKMA announced September 29 that its fourth multicurrency digital green-bond offering priced the previous day at approximately HK$20 billion equivalent. It included $200 million of three-year dollar bonds yielding 5.023%, demonstrating institutional demand for quality short-dated assets.
Mainland policy focused on targeted financing-cost relief and effective demand. September official manufacturing PMI rose from 49.8 to 50.1, above the expansion threshold; nonmanufacturing activity rose from 49.0 to 50.2. Production increased from 50.4 to 51.7, but new orders edged from 50.6 to 50.5 and employment fell to 48.4. Production recovery had yet to receive equally strong new-order and employment support.
Financial measures arrived near quarter-end. A first-home mortgage interest subsidy announced September 29 and effective October 1 targeted new commercial loans for first homes no larger than 120 square meters or more expensive than RMB 1.5 million. Eligible principal was capped at RMB 1 million per household, with an annual subsidy of 1 percentage point for up to five years; refinancing existing loans was excluded. The same day, the central bank cut the one-year PSL rate from 1.75% to 1.50%, adding RMB 200 billion to technology-innovation and upgrading relending and RMB 500 billion to agricultural and small-business relending. Reuters on September 28 also reported that China and the United States each proposed tariff-preference lists for nonsensitive goods worth about $30 billion on 2024 import values, with cuts and timing undecided. Xinhua Finance's October 4 weekly report said the fourth RMB 62.5 billion consumer trade-in allocation completed the full RMB 250 billion annual allocation. These measures offered targeted funding and cost buffers; macro stabilization still depended on actual credit delivery and household consumption.
Easing near-term tightening expectations enabled technical recoveries in some risk assets, but high medium- and long-term real rates and wider credit premiums remained a financing ceiling for the real economy. From diverging AI hardware and traditional industries to product margins versus crude stocks and Asian policy support versus order conversion, markets were moving beyond immediate hike expectations toward a fuller test of microeconomic earnings and cash flow.


