In the third quarter of 2026, U.S. PMI readings and growth expectations rose again. S&P Global's composite PMI reached 58.4, a 62-month high; its historical relationship implied annualized real GDP growth of about 4% for the quarter and about 5% for September alone. ISM manufacturing PMI expanded for nine consecutive months and services for 27, corresponding under ISM's conversion method to annualized real GDP growth of roughly 2.4% and 2.1%, respectively. On September 30, BEA revised second-quarter real GDP growth sharply upward from 1.5% to 2.2%, with real final sales to private domestic purchasers growing 4.6%. The Atlanta Fed's October 1 GDPNow reading pointed to third-quarter growth of 3.7%. Despite three headwinds—the Middle East war's energy-supply shock, tariffs raising input costs and the Fed's first rate increase in three years—the economy has strengthened from quarter to quarter. This article examines the structure, quality and causes of that strength through PMI and GDP data.
1. PMI readings rise and remain in expansion
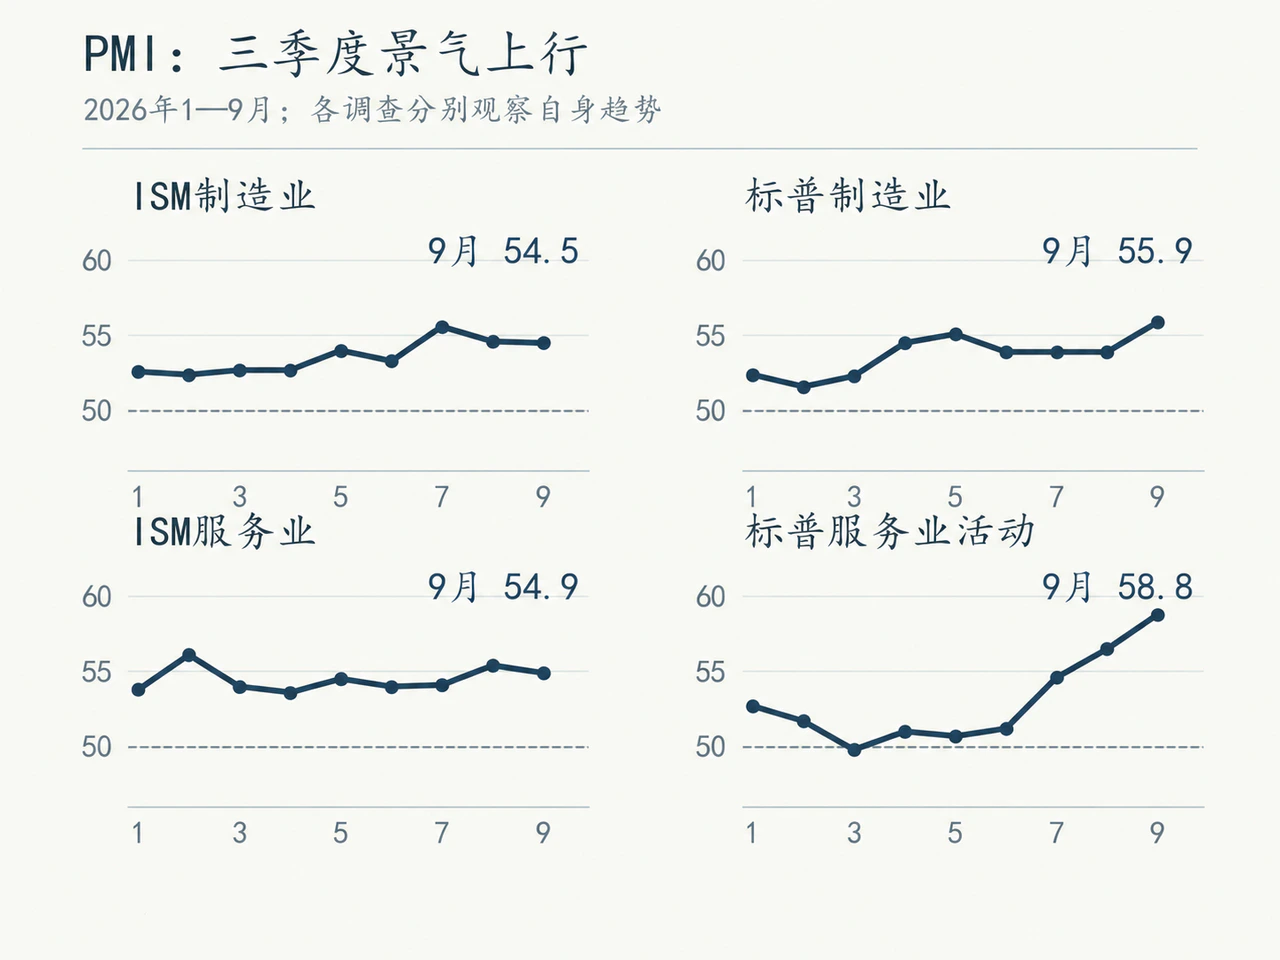
ISM and S&P Global PMIs have remained in expansion during 2026. September's ISM manufacturing PMI was 54.5, and S&P's was 55.9. Services improved markedly in the second half: S&P's services business-activity index rose from 49.8 in March and 51.2 in June to 54.6 in July, 56.5 in August and 58.8 in September. ISM services PMI stayed above the 50 expansion threshold throughout the year, reaching 54.9 in September. Comparing the surveys, S&P activity expansion continued accelerating, while ISM production and business-activity components slowed from August's highs.
| 2026 | ISM manufacturing | S&P manufacturing | ISM services | S&P services activity |
|---|---|---|---|---|
| January | 52.6 | 52.4 | 53.8 | 52.7 |
| February | 52.4 | 51.6 | 56.1 | 51.7 |
| March | 52.7 | 52.3 | 54.0 | 49.8 |
| April | 52.7 | 54.5 | 53.6 | 51.0 |
| May | 54.0 | 55.1 | 54.5 | 50.7 |
| June | 53.3 | 53.9 | 54.0 | 51.2 |
| July | 55.6 | 53.9 | 54.1 | 54.6 |
| August | 54.6 | 53.9 | 55.4 | 56.5 |
| September | 54.5 | 55.9 | 54.9 | 58.8 |
Manufacturing: domestic demand supports orders while export demand remains weak
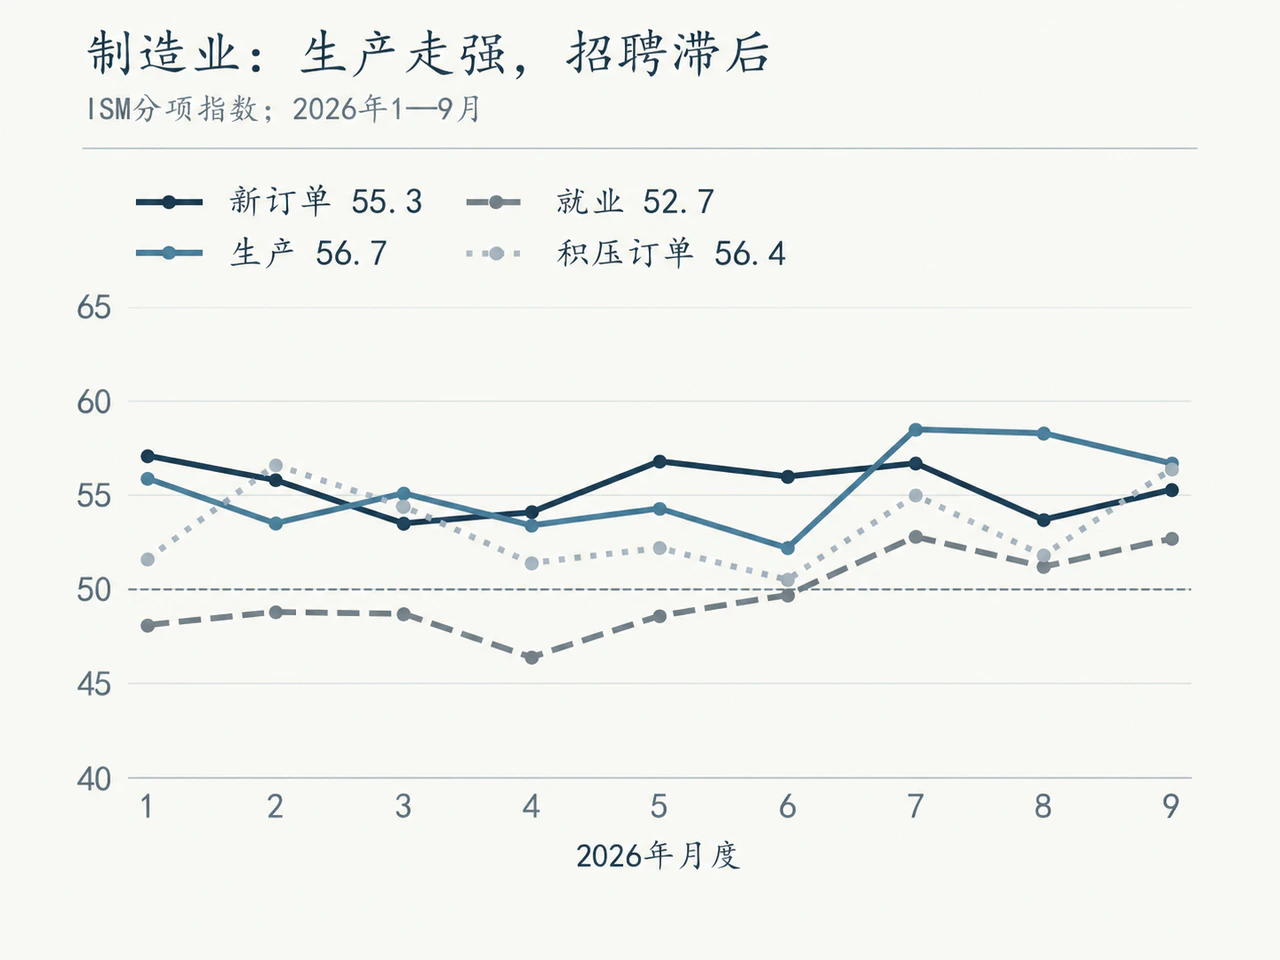
Among the components, ISM manufacturing new orders have remained above the 50 threshold for nine consecutive months. The third-quarter production index was substantially higher on average than in the second quarter, while employment entered expansion only in July.
| 2026 | New orders | Production | Employment | Order backlogs | Prices paid |
|---|---|---|---|---|---|
| January | 57.1 | 55.9 | 48.1 | 51.6 | 59.0 |
| February | 55.8 | 53.5 | 48.8 | 56.6 | 70.5 |
| March | 53.5 | 55.1 | 48.7 | 54.4 | 78.3 |
| April | 54.1 | 53.4 | 46.4 | 51.4 | 84.6 |
| May | 56.8 | 54.3 | 48.6 | 52.2 | 82.1 |
| June | 56.0 | 52.2 | 49.7 | 50.5 | 73.0 |
| July | 56.7 | 58.5 | 52.8 | 55.0 | 71.1 |
| August | 53.7 | 58.3 | 51.2 | 51.8 | 71.1 |
| September | 55.3 | 56.7 | 52.7 | 56.4 | 77.9 |
Current manufacturing expansion is driven mainly by domestic demand. ISM new export orders slipped into contraction several times in the first half; after a third-quarter rebound, they fell back to 50.9 in September. S&P's September new export orders contracted for a 15th consecutive month, even as total manufacturing orders grew significantly. Both surveys show that order expansion came chiefly from domestic demand rather than a global recovery. Increases were attributed mainly to the domestic market, including government and technology-sector support and equipment demand from AI-related spending.
This closely matches the strength in equipment and software investment in first-half GDP. Against weak foreign demand, domestic corporate equipment and technology capital expenditure offset the external drag and directly supported orders for equipment manufacturing, electronic components and related supply chains. Equipment and technology capital spending underpinned momentum, leaving manufacturing more dependent on domestic capital projects.
Manufacturing production and backlogs rose together in the third quarter. ISM's production index climbed from 52.2 in June to 58.5 in July and 58.3 in August; September's decline to 56.7 still left it in strong expansion. Backlogs rose from 50.5 in June to 56.4 in September. S&P's September survey similarly showed new orders, output and outstanding work increasing together. Even higher production did not fully absorb new workloads at some firms, reflecting concentrated demand and localized supply constraints in equipment, raw materials and appropriately skilled labor.
September's ISM manufacturing headline edged lower, but new orders rebounded from 53.7 to 55.3 and backlogs rose from 51.8 to 56.4. Production expansion slowed while underlying order demand remained resilient. Backlogs provide a reserve of support for future output. Given previously cautious expansion and hiring, continuing orders put pressure on firms to add capacity and staff, although actual commitments depend on expectations about demand persistence.
New orders include significant precautionary advance purchasing. S&P's June survey already reported customers ordering ahead to avoid price increases, and in September some firms continued adding safety stocks because of price and supply concerns. ISM chemical companies also partly attributed September's improvement to customers' precautionary purchases. Long-term capital spending and equipment replacement can generate sustained orders; buying ahead to avoid increases or shortages borrows from future demand. It can lift short-term order readings without raising the long-term demand baseline.
On inventories, S&P reported active stocking, while ISM's September raw-material inventory index fell to 48.6. Customer inventories were 41.6, indicating respondents continued to consider them too low. This is consistent with some firms replenishing while production use and delivery constraints keep stocks tight. Low customer inventories allow room for further orders, but do not show that a broad industrywide cyclical restocking has begun. Further output expansion still depends on actual final sales.
Services: third-quarter orders recover, with diverging September signals
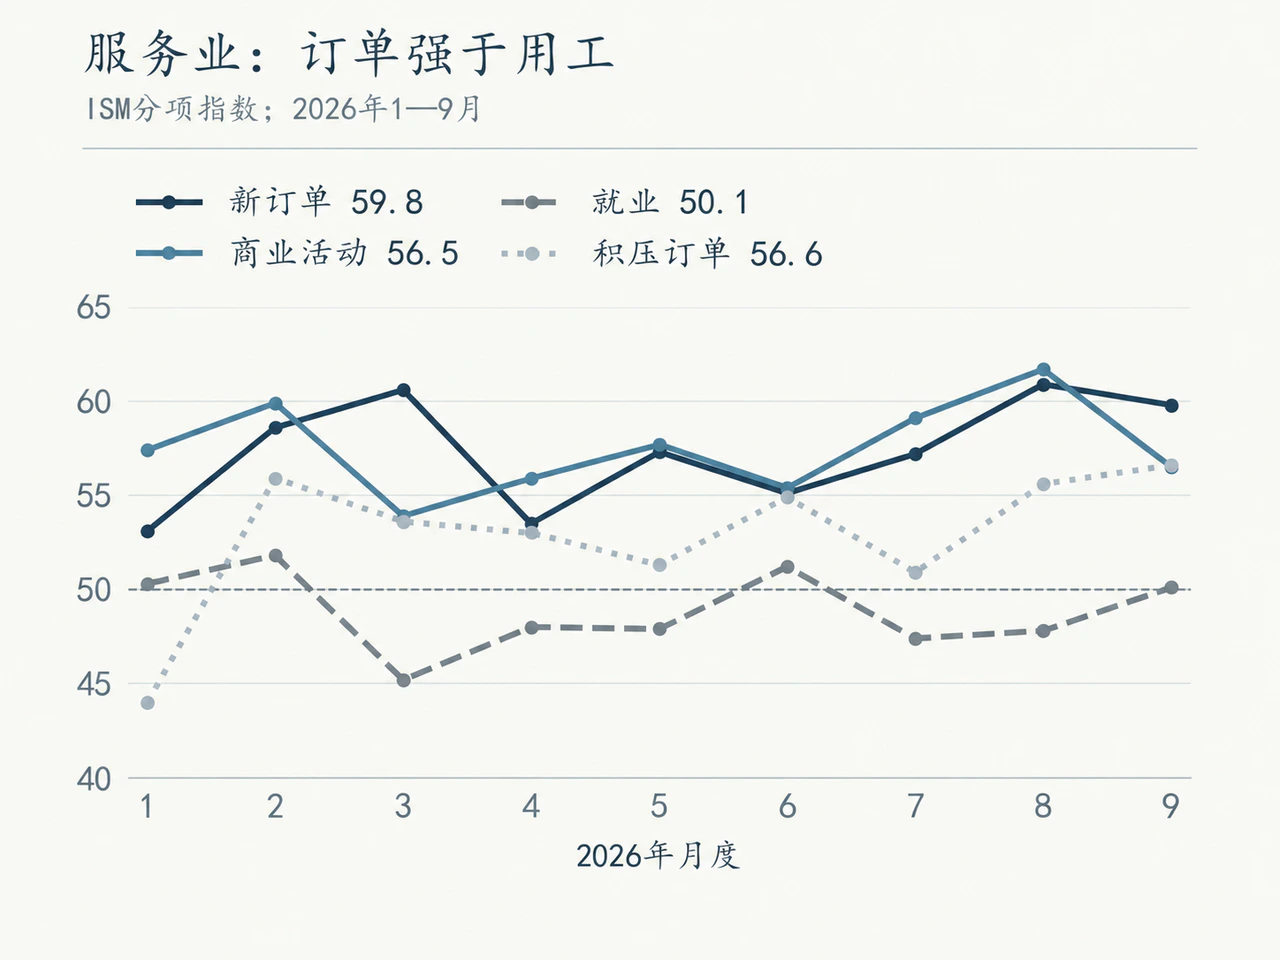
| 2026 | Business activity | New orders | Employment | Order backlogs | Prices paid |
|---|---|---|---|---|---|
| January | 57.4 | 53.1 | 50.3 | 44.0 | 66.6 |
| February | 59.9 | 58.6 | 51.8 | 55.9 | 63.0 |
| March | 53.9 | 60.6 | 45.2 | 53.6 | 70.7 |
| April | 55.9 | 53.5 | 48.0 | 53.0 | 70.7 |
| May | 57.7 | 57.3 | 47.9 | 51.3 | 71.3 |
| June | 55.4 | 55.1 | 51.2 | 54.9 | 67.7 |
| July | 59.1 | 57.2 | 47.4 | 50.9 | 70.3 |
| August | 61.7 | 60.9 | 47.8 | 55.6 | 72.6 |
| September | 56.5 | 59.8 | 50.1 | 56.6 | 74.0 |
Both services surveys indicated demand pressure in the spring. S&P's business-activity index contracted in March at 49.8; firms reported higher energy prices burdening households and undermining confidence, especially in consumer services. ISM services PMI was still 54.0, but business activity fell from February's 59.9 to 53.9, employment dropped from 51.8 to 45.2, and prices paid rose from 63.0 to 70.7.
Rising costs squeezed purchasing power, profits and hiring intentions, while orders in some industries retained support. This matched the first quarter's weak consumption and strong investment in GDP.
The third-quarter services recovery appeared in both orders and operations. ISM services new orders rose from 55.1 in June to 57.2 in July and 60.9 in August, remaining high at 59.8 in September. S&P reported a temporary July boost to consumer services from major sporting events and festivals. By September, new-order expansion had spread across all five broad services sectors it covers, led by information and communication. Improving demand had broadened from a short-lived sports and entertainment pulse to technology services leading and consumer services following at the margin.
The surveys diverged on September's direction: ISM business activity fell from August's 61.7 high to 56.5, while S&P services activity rose from 56.5 to 58.8. ISM's still-elevated new orders and rising backlogs indicated slowing expansion at a high level rather than a reversal in demand.
Industries diverged. ISM's September survey showed both business activity and new orders falling in construction, with respondents explicitly citing high interest rates constraining clients' purchasing and procurement capacity. Wholesalers and utilities reported strong demand, material shortages and delayed deliveries. This fits strong equipment and technology projects alongside weak property and traditional construction. Combined with GDP equipment investment, domestic data-center construction and residential investment, the industry feedback shows how differences in customer demand, expected returns and funding sources direct spending under the same interest-rate environment.
Order growth has not produced a broad hiring acceleration
In the first half, ISM manufacturing production expanded while employment contracted for six consecutive months. S&P's June survey likewise showed a marked staff reduction, mainly in response to rising energy and raw-material costs. September's S&P survey showed hiring recovering, and ISM employment rose to 52.7. This was closer to some firms adding staff after sustained order growth than to a labor market leading expansion.
Services employment was more volatile. After recovering to 51.2 in June, ISM employment fell back into contraction at 47.4 and 47.8 in July and August, then edged up to only 50.1 in September, contrasting with persistently strong new orders. S&P showed faster services hiring in September, but ISM respondents revealed structural differences: some merely replaced natural retirements or internal transfers; others reorganized staffing after adopting AI tools. Similar business growth can therefore produce different hiring decisions.
Official data confirmed a subdued labor market. September nonfarm payrolls rose only 29,000; with July down 10,000 and August up 133,000, third-quarter gains averaged approximately 51,000 a month. September unemployment was 4.2%. Manufacturing employment also diverged: only two of ISM's six major manufacturing industries reported net job growth in September. Stronger business conditions and localized staffing additions had yet to become broad job creation.
Low hiring also reflects slower labor-supply growth. Lower net immigration and population aging reduce the job gains needed to stabilize unemployment. In March, the St. Louis Fed estimated the 2026 requirement at roughly 15,000–87,000 jobs per month under different immigration scenarios, rather than a fixed threshold. The Fed's July report also noted slow labor-supply and demand growth and a then-current layoff rate of about 1.1%. A third-quarter monthly average near 51,000 therefore neither mechanically indicates recession by past standards nor proves large-scale AI labor substitution. Deteriorating demand requires confirmation from unemployment, layoffs and real income.
Weak hiring has not reduced aggregate compensation. BLS September data showed private aggregate hours up approximately 1.1% year on year and aggregate weekly payrolls up about 4.2%. Monthly hours were broadly unchanged and weekly payrolls rose about 0.2%. Stable existing employment, actual hours and hourly wages supported nominal household income, so marginal job additions alone cannot explain consumption resilience. Weekly payrolls are nominal; September CPI had not yet been released, leaving real purchasing power to be tested. Relatively subdued hours and employment momentum also cannot independently support a sharp consumption acceleration.
Cost shocks and localized demand jointly lift prices
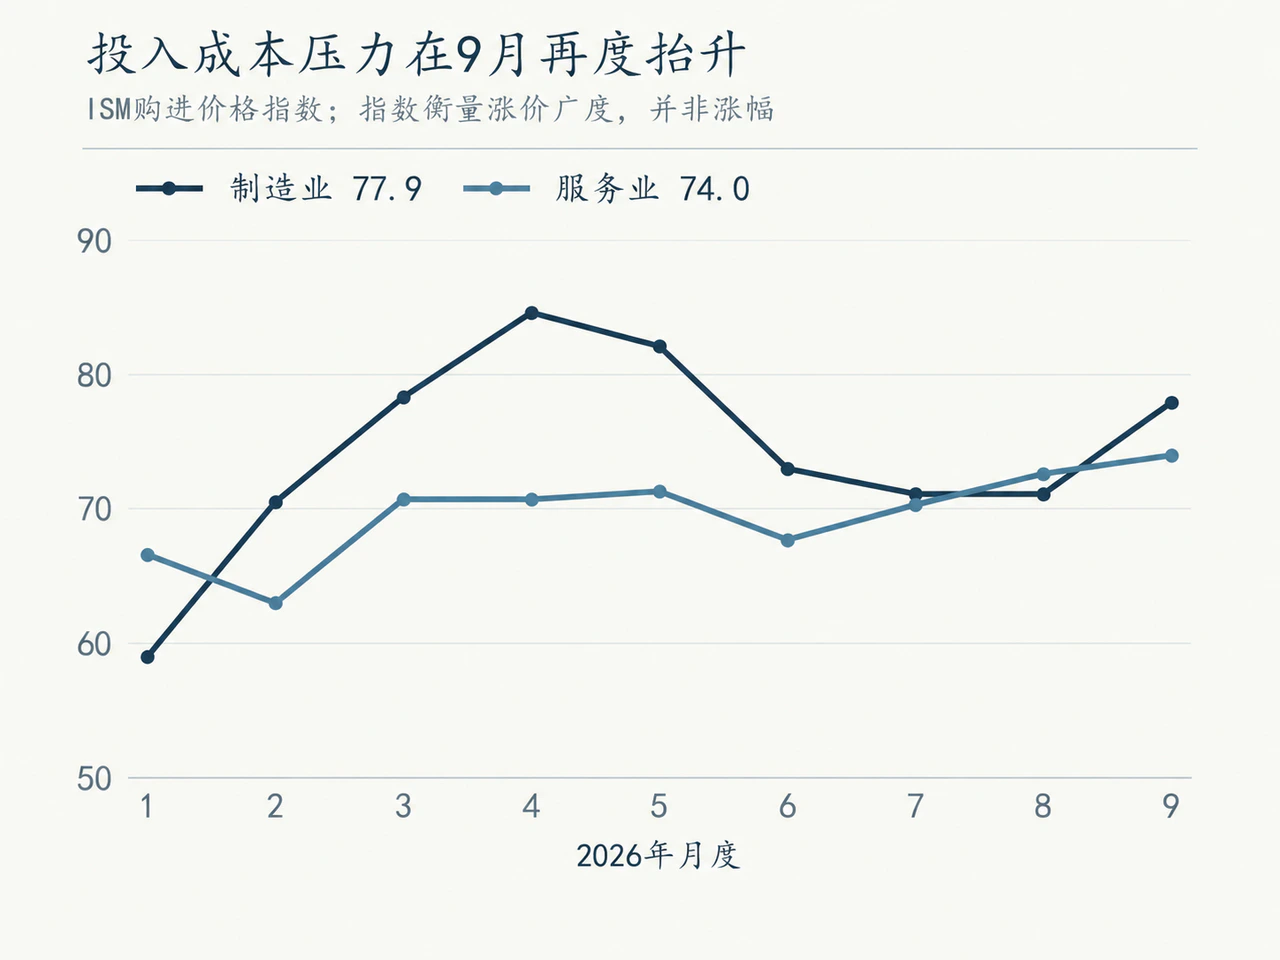
ISM manufacturing prices paid rose from 59.0 in January to 84.6 in April, eased briefly in summer and rebounded to 77.9 in September. Services prices paid rose from 67.7 in June to 74.0 in September. These diffusion indices measure the breadth, rather than the magnitude, of price increases.
Energy, tariffs, transport capacity and localized raw-material shortages jointly raised input costs. S&P's September manufacturing survey showed faster raw-material inflation but the slowest selling-price increase since February, indicating substantial resistance to downstream pass-through. Services input costs and final selling prices accelerated together, showing differing pass-through capacity across the sectors. Some downstream firms stocked ahead, while others reduced hiring or delayed projects in response.
Longer delivery times also do not necessarily mean booming demand. Material shortages, logistics bottlenecks and customs delays all lengthen deliveries. Precautionary orders prompted by fears of price increases and shortages add to supply-chain burdens and can simultaneously lift orders, purchases and quotations in the short run, without an equivalent increase in actual final consumption.
Technology capital spending transmits with a lag. Early data-center and computing-infrastructure construction mainly drives electricity and energy, specific construction work, electrical and mechanical equipment, and related materials and engineering inputs. Productivity benefits depend on deployment, commercial use and organizational adjustment. Rapid capital-expenditure growth, uneven job creation and localized input inflation therefore coexist. With external supply shocks from energy and tariffs as well, higher price indices cannot be attributed solely to aggregate-demand overheating.
Equipment orders rise in August while real manufacturing output falls
Third-quarter hard data confirmed expanding equipment-investment demand without showing a broad acceleration in actual manufacturing production. August core capital-goods orders—nondefense excluding aircraft—rose 1.6% month on month and shipments 0.5%. Real manufacturing output nevertheless fell 0.3%, ending seven consecutive monthly increases.
| Released third-quarter real-economy indicators | Latest performance | Economic condition indicated |
|---|---|---|
| August core capital-goods orders and shipments | Nominal monthly increases of 1.6% and 0.5%, respectively | Equipment demand and deliveries retain support |
| August manufacturing output | Real output down 0.3% month on month, up 0.9% year on year | Overall production has not kept accelerating |
| August output in selected high-tech industries and manufacturing excluding high tech | Real annual increases of 12.5% and 0.5%, respectively | Growth remains concentrated in selected industries |
| August manufacturing capacity utilization | 75.7%, 2.5 percentage points below its long-run average | Manufacturing overall still has spare capacity |
| August capacity utilization in machinery and electrical equipment | 83.4% and 85.8%, respectively, 5.2 and 4.1 percentage points above their own long-run averages | Some equipment-supply segments are tight |
Tight supply and demand in machinery and electrical equipment alongside low overall manufacturing utilization likewise reflect divergence between technology-driven advanced industries and traditional industries. Technology-intensive capital expenditure has locally increased backlogs, delivery times and quotations in specific supply chains.
Household consumption provides another substantive source of aggregate-demand support. Real personal consumption expenditures rose 0.1% month on month in July and 0.6% in August. August's acceleration came mainly from goods, up 1.3%, while services edged up only 0.2%, slowing from July's 0.3%.
Strong third-quarter growth expectations include important inventory and consumption carryover effects
GDPNow's October 1 forecast put third-quarter real GDP growth at 3.7%. Real consumption and private fixed investment together were expected to grow about 4.4%, indicating strong private domestic demand. Inventories were expected to contribute about 2.04 percentage points and net exports to subtract roughly 2.59 points. Final sales of domestic product excluding inventory investment were projected to grow only about 1.6%.
| GDPNow third-quarter forecast, October 1 vintage | Contribution to annualized real GDP growth, percentage points |
|---|---|
| Personal consumption | 2.21 |
| Private fixed investment | 1.57 |
| Government consumption and investment | 0.45 |
| Inventory investment | 2.04 |
| Net exports | -2.59 |
| Forecast real GDP growth | 3.68% (published rounded figure: 3.7%) |
The forecast has support from actual consumption data. Using monthly real PCE levels through August aligned with the late-September revisions, consumption would still grow about 3.27% at an annualized quarterly rate if September were unchanged from August, close to the model's 3.3%. July and August spending already exceeded the second-quarter average. A September monthly decline of 0.5% or increase of 0.5% would produce quarterly growth of about 2.58% or 3.96%, respectively, under the same calculation.
2. Growth drivers in 2024–2026 GDP components
Consumption anchors growth while trade and inventories amplify quarterly swings
Annualized real GDP growth in the first half of 2026 relative to end-2025 was about 2.35%, above the roughly 2.1% potential annual growth for 2026–2030 projected by CBO in February.
| Real quarter-on-quarter annualized growth, % | Q1: November 2025 forecast | Q1: September 30 estimate | Q2: November 2025 forecast | Q2: September 30 estimate |
|---|---|---|---|---|
| GDP | 1.6 | 2.5 | 1.7 | 2.2 |
| Personal consumption | 1.3 | 0.7 | 2.1 | 3.8 |
| Nonresidential fixed investment | 2.0 | 9.9 | 2.3 | 9.0 |
Against the Philadelphia Fed's November 17, 2025 forecast, actual 2026 growth exceeded expectations, most strikingly in corporate investment. Forecast first- and second-quarter nonresidential fixed-investment growth of 2.0% and 2.3% is now estimated at 9.9% and 9.0%. Consumption was weaker than expected in the first quarter and stronger in the second. This year's GDP estimates were also revised up: first-quarter growth was initially reported at 2.0% on April 30, and second-quarter growth at 1.5% on July 30; the September 30 vintage raised them to 2.5% and 2.2%.
| Quarter | GDP growth (%) | Consumption | Nonresidential investment | Residential investment | Inventories | Net exports | Government |
|---|---|---|---|---|---|---|---|
| 2024Q1 | 1.4 | 1.18 | 0.41 | 0.39 | -1.04 | -0.10 | 0.60 |
| 2024Q2 | 3.6 | 2.62 | 0.36 | -0.12 | 1.21 | -1.13 | 0.63 |
| 2024Q3 | 3.2 | 2.48 | 0.82 | -0.18 | -0.06 | -0.78 | 0.89 |
| 2024Q4 | 2.4 | 2.84 | -0.09 | 0.11 | -0.91 | -0.15 | 0.61 |
| 2025Q1 | 0.1 | 0.44 | 1.43 | -0.11 | 2.54 | -4.04 | -0.12 |
| 2025Q2 | 4.0 | 1.43 | 1.05 | -0.17 | -3.17 | 4.49 | 0.40 |
| 2025Q3 | 3.9 | 2.45 | 0.54 | -0.25 | -0.14 | 1.00 | 0.28 |
| 2025Q4 | 0.2 | 1.28 | 0.30 | -0.07 | -0.04 | -0.25 | -1.01 |
| 2026Q1 | 2.5 | 0.49 | 1.36 | -0.29 | 0.18 | -0.04 | 0.80 |
| 2026Q2 | 2.2 | 2.51 | 1.25 | 0.10 | -0.53 | -1.10 | -0.01 |
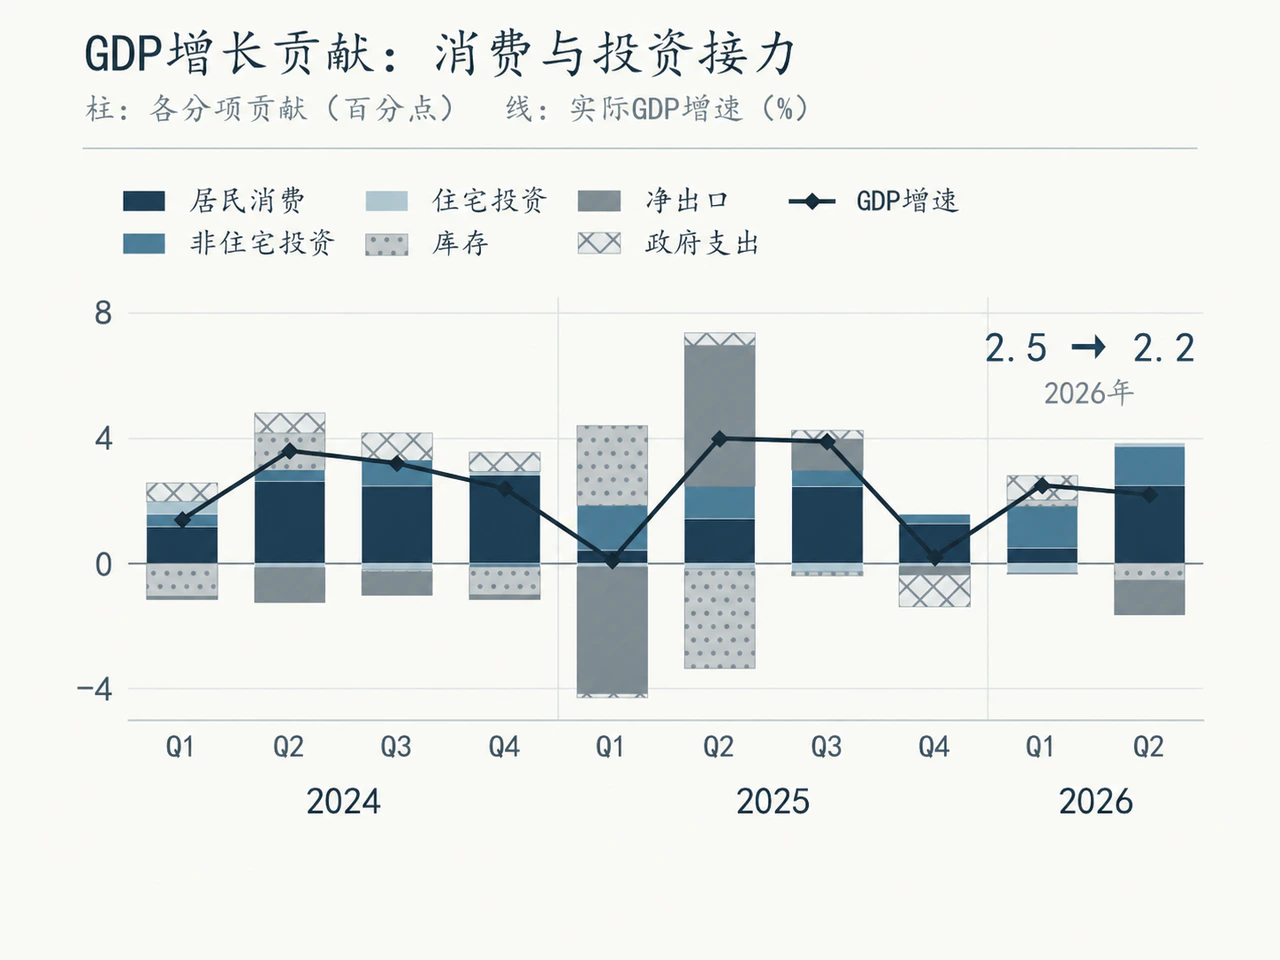
The historical components reveal three features of 2024–2025 growth. First, consumption provided a foundation but fluctuated markedly: it contributed about 2.5–2.8 percentage points per quarter in the final three quarters of 2024, fell to 0.44 points in the first quarter of 2025, recovered to 2.45 in the third and fell again to 1.28 in the fourth. Second, corporate nonresidential investment provided stronger support than in most 2024 quarters, while residential investment dragged in all four quarters of 2025 and the first quarter of 2026, showing continued high-rate pressure on financing-sensitive demand. Finally, trade and inventories amplified GDP swings: in the first quarter of 2025 net exports subtracted 4.04 points and inventories added 2.54; in the second, net exports added 4.49 and inventories subtracted 3.17. Exports contributed negatively in that second quarter; the positive net-export contribution mainly reflected sharply lower imports rather than expanding foreign demand.
Consumption has remained the pillar of aggregate growth, with corporate investment providing more support than in 2024. Trade and inventory swings must be understood alongside import timing. When firms import early to avoid tariffs, import deductions and inventory accumulation may occur together; subsequent declines in imports and inventory adjustment can reverse both contributions. A one-quarter GDP rebound therefore need not mean a simultaneous jump in private final demand.
First quarter: nonresidential investment leads, while government spending turns from drag to support
Real GDP grew at a 2.5% annualized rate in the first quarter of 2026, up from 0.2% in the fourth quarter of 2025, without a corresponding consumption acceleration. Corporate nonresidential fixed investment grew 9.9% in real terms and contributed 1.36 percentage points, substantially above private consumption's 0.49 and government spending's 0.80, making it the leading driver.
Equipment investment grew 15.5% in real terms and contributed 0.82 percentage points; intellectual-property products rose 15.6% and contributed 0.83. Nonresidential structures fell 9.4%, subtracting 0.29 points. Computers and peripherals contributed 0.62 points and software 0.60, directly reflecting digital-infrastructure and technology-hardware procurement. These expenditures include non-AI uses, however, and imported equipment is deducted through net exports, so they do not wholly represent AI's net contribution to domestic value added.
Combining information-processing equipment, software and research and development into a technology-investment basket, its direct contribution to GDP growth rose from 0.02–0.57 percentage points across 2024 quarters to 0.63–1.31 in 2025, then reached 1.61 in the first quarter of 2026, above the 1.36 points from all nonresidential fixed investment. Technology-related investment has strengthened its aggregate-demand contribution significantly relative to 2024.
| Contribution to real quarter-on-quarter annualized GDP growth, percentage points | 2025Q4 | 2026Q1 | 2026Q2 |
|---|---|---|---|
| Information-processing equipment | 0.67 | 0.79 | 0.19 |
| Software | 0.05 | 0.60 | 0.33 |
| Research and development | 0.21 | 0.22 | 0.17 |
| Total of the three categories | 0.93 | 1.61 | 0.69 |
Government spending's contribution reversed from -1.01 percentage points in the fourth quarter of 2025 to +0.80 in the first quarter, an increase of 1.81 points that materially supported the growth rebound. Nonresidential investment's contribution increased 1.06 points, while consumption's fell 0.79. BEA explained that the government rebound partly reflected the end of the earlier federal shutdown, with federal nondefense items such as employee compensation returning to normal. This was a one-off spending recovery rather than sustained fiscal expansion.
First-quarter real consumption grew only 0.7%, while residential investment fell 7.6%. Consumption and private fixed investment combined grew 1.8% in real terms, unchanged from the fourth quarter of 2025. GDP's acceleration from 0.2% to 2.5% therefore did not accompany a broad pickup in private final spending. Technology and equipment investment provided the main support, while household spending remained weak.
Second quarter: consumption contributes more, while net exports and inventories drag on GDP
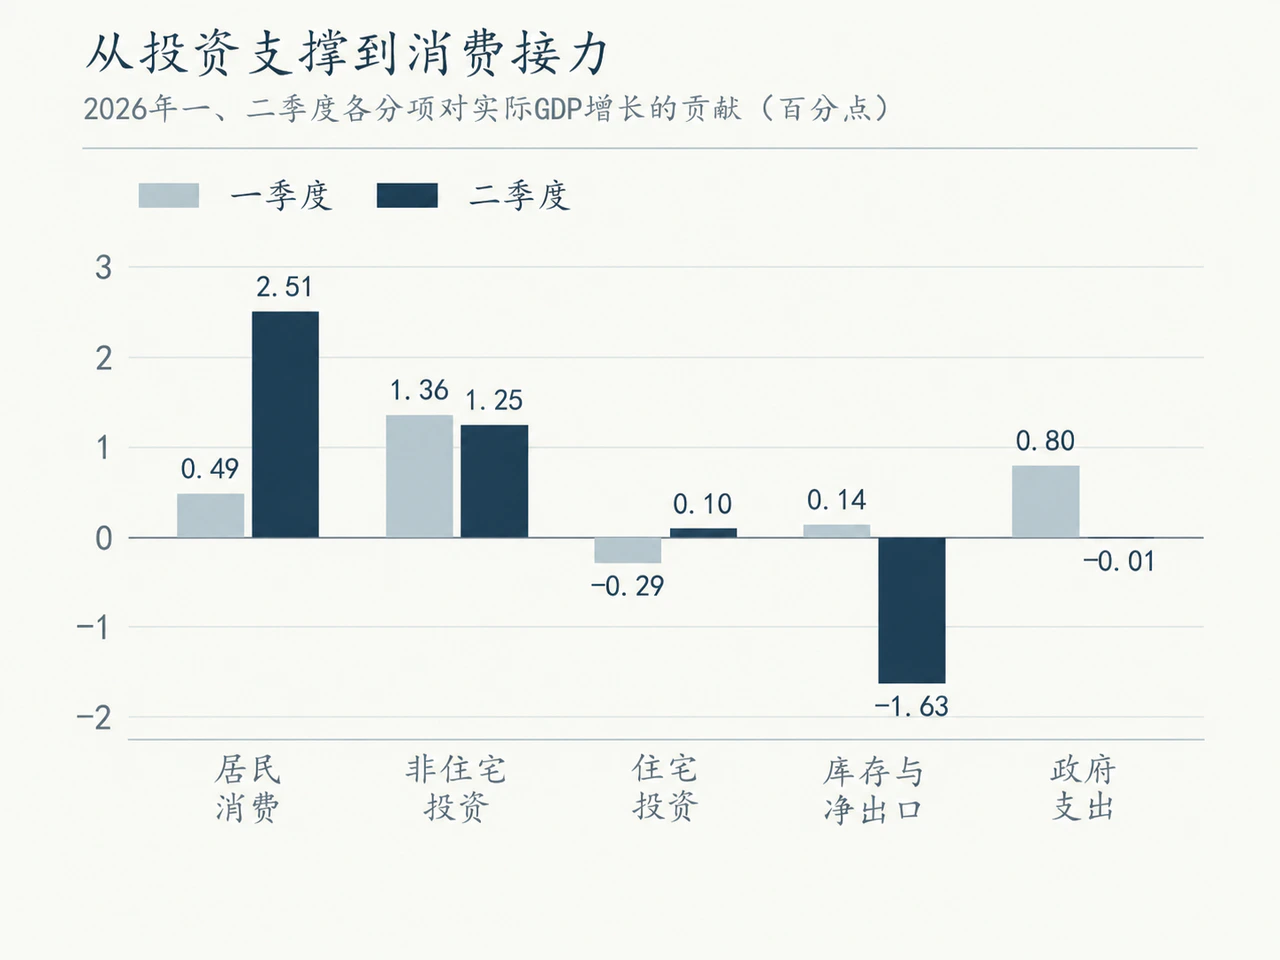
Although annualized real GDP growth slowed to 2.2% in the second quarter, private final demand accelerated substantially. Real consumption growth rose from 0.7% to 3.8%, and its GDP contribution jumped from 0.49 to 2.51 percentage points, an increase of 2.02 points, making it the leading source of demand improvement. Corporate nonresidential investment grew 9.0% and contributed 1.25 points; residential investment's contribution turned from -0.29 to +0.10.
Within second-quarter consumption, goods contributed 0.94 percentage points and services 1.57. Health-care services alone added 0.79 points, compared with nearly zero in the first quarter, accounting for about 39% of the 2.02-point increase in consumption's contribution. The other 61% came from non-health-care-service items, including cars, furniture, dining and entertainment as well as medicines.
| Consumption-component contributions to GDP growth, percentage points | First quarter | Second quarter | Change in contribution |
|---|---|---|---|
| Health-care services | 0.00 | 0.79 | +0.79 |
| Goods consumption | 0.17 | 0.94 | +0.77 |
| Of which: motor vehicles and parts | 0.06 | 0.26 | +0.20 |
| Of which: furnishings and durable household equipment | 0.04 | 0.17 | +0.13 |
| Of which: recreational goods and vehicles | -0.05 | 0.09 | +0.14 |
| Recreation services | -0.05 | 0.27 | +0.32 |
| Food services and accommodation | -0.14 | 0.18 | +0.32 |
| Final consumption by nonprofit institutions serving households | 0.38 | 0.00 | -0.38 |
| Other services, calculated as total less the above items | 0.13 | 0.33 | +0.20 |
| Total personal consumption | 0.49 | 2.51 | +2.02 |
Beyond health-care services, the goods contribution rose 0.77 percentage points and other services increased a net 0.46. Food services and accommodation and recreation services each added 0.32 points, partly offset by a decline in nonprofit consumption's contribution. In BEA's detailed decomposition of real PCE growth, health-care services' contribution rose 1.19 points from the first quarter and medicines and other medical products added 0.47. Together, approximately 1.66 points represented about 54% of the 3.1-point consumption acceleration from 0.7% to 3.8%. Around half of the second-quarter consumption acceleration came from health-related expenditure.
The health-care recovery was concentrated in hospital and outpatient services. Annualized real health-care consumption growth rose from nearly zero in the first quarter to 7.0% in the second. Hospital-services growth accelerated from 1.2% to 9.4%, outpatient care turned from -1.7% to 5.3%, and dental care went from 2.4% to -8.9%. Hospital and nursing services accounted for about 64% of health care's contribution to consumption, and outpatient care about 36%. Annualized health-care price growth slowed from 3.7% to 2.9%, showing that stronger real consumption was not caused by medical-price inflation.
Corporate investment remained firm in the second quarter and broadened by category. Equipment investment contributed 0.74 percentage points to GDP; computers and peripherals turned negative at -0.09, while industrial and transport equipment added 0.28 and 0.24, and software contributed a steady 0.33. Relative to the first quarter, industrial equipment's contribution rose 0.22 points and transport equipment moved from -0.13 to +0.24, offsetting slower computer-hardware purchases. Overall, real nonresidential investment grew 9.0%, while total private fixed investment including housing grew 7.7%.
The technology basket of information-processing equipment, software and R&D contributed 0.69 percentage points in the second quarter, down 0.92 from 1.61 in the first. Industrial and transport equipment's combined contribution rose from -0.07 to 0.52, an increase of 0.59. The absolute level of technology spending continued growing, but its marginal growth contribution slowed. Consumption taking over was the key to faster second-quarter private domestic demand.
After four consecutive quarterly declines, nonresidential structures investment grew just 0.1% in real terms in the second quarter, indicating only tentative stabilization.
Monthly real health-care consumption growth had eased from 0.9% in April and 1.0% in May to 0.3% in July and 0.2% in August. Slower growth implies a potentially smaller additional contribution in subsequent quarters.
Corporate investment becomes a growth pillar, with a clear AI supply-chain effect
Measured by private nonresidential fixed investment, corporate investment's contribution to GDP growth rose from -0.09 to 0.82 percentage points per quarter in 2024 to 0.30–1.43 in 2025, and remained at 1.36 and 1.25 in the first two quarters of 2026. Against quarterly GDP growth of 2.5% and 2.2%, these expenditure contributions represented approximately 54% and 57% of growth, respectively.
All entries below are contributions to real quarter-on-quarter annualized GDP growth, in percentage points. Information-processing equipment, software and R&D form the broad technology basket; industrial and transport equipment are separate. Other items equal total nonresidential investment less those two groups and include structures and other equipment and intellectual-property products.
| Quarter | Corporate nonresidential investment contribution | Information-processing equipment, software and R&D | Industrial and transport equipment | Other nonresidential investment |
|---|---|---|---|---|
| 2024Q1 | 0.41 | 0.33 | 0.00 | 0.08 |
| 2024Q2 | 0.36 | 0.28 | 0.19 | -0.11 |
| 2024Q3 | 0.82 | 0.57 | 0.18 | 0.07 |
| 2024Q4 | -0.09 | 0.02 | -0.01 | -0.10 |
| 2025Q1 | 1.43 | 1.31 | 0.10 | 0.02 |
| 2025Q2 | 1.05 | 1.23 | 0.10 | -0.28 |
| 2025Q3 | 0.54 | 0.63 | 0.07 | -0.16 |
| 2025Q4 | 0.30 | 0.93 | -0.27 | -0.36 |
| 2026Q1 | 1.36 | 1.61 | -0.07 | -0.18 |
| 2026Q2 | 1.25 | 0.69 | 0.52 | 0.04 |
Technology-related investment has been the main source of stronger corporate-investment support over the past two years, but technology-related is not synonymous with pure AI infrastructure. The first-quarter broad technology contribution of 1.61 percentage points represented about 118% of total corporate investment's 1.36 points, because other investment collectively subtracted 0.25 points. In the second quarter, that ratio fell to about 55%, while industrial and transport equipment contributed 0.52 points, or approximately 42% of corporate investment's contribution. Relative to GDP growth, the broad technology basket's 1.61 and 0.69 points represented about 64% and 31%.
Precisely measuring the full AI and data-center chain also requires avoiding double counting. Final investment prices for servers and facilities already include value added in domestic equipment, construction and upstream services; supplier revenue cannot be added again at every level. Imported chips and equipment represent foreign output. Operating-stage cloud services, electricity and upstream value added must be accounted for by final use separately from construction investment. Wealth-driven consumption and future productivity benefits are further transmission effects.
Even after import adjustment, technology investment retains a substantial domestic growth contribution. On August 20, ING used computers and peripherals, software and data-center investment, deducting price-deflated related hardware net imports, to estimate that this proxy explained about 36% of then-estimated second-quarter real GDP year-on-year growth and an average 37% over the preceding four quarters—roughly one-third.
AI-related construction has become an important incremental source of corporate investment. A PwC study commissioned by the data-center industry association estimated that all U.S. data centers generated approximately $927 billion in direct, indirect and income-induced value added in 2024, about 3.2% of that year's revised nominal GDP. This is a historical economic-impact estimate covering the entire existing data-center stock and associated activity, including ordinary cloud business and induced consumption. It is neither a measured 2026 share nor a pure-AI industry share. It shows that the chain is economically significant, but cannot be added to server procurement, cloud-provider revenue or GDP investment contributions. Another common scale measure—approximately $581 billion in domestic U.S. AI investment in 2026, equal to about 1.8% of forecast nominal GDP—is an annual investment-spending estimate that still includes imports.
Private demand accelerates while net exports and inventories weigh on GDP
Second-quarter real GDP growth eased from 2.5% to 2.2%, while real final sales to private domestic purchasers jumped from 1.8% to 4.6%. Private domestic demand clearly accelerated, but a larger drag from trade and inventory adjustment left domestic output growing more slowly than private final demand.
| Quarter | Combined real growth in consumption and private fixed investment (%) |
|---|---|
| 2024Q1 | 2.3 |
| 2024Q2 | 3.4 |
| 2024Q3 | 3.7 |
| 2024Q4 | 3.4 |
| 2025Q1 | 2.1 |
| 2025Q2 | 2.7 |
| 2025Q3 | 3.2 |
| 2025Q4 | 1.8 |
| 2026Q1 | 1.8 |
| 2026Q2 | 4.6 |
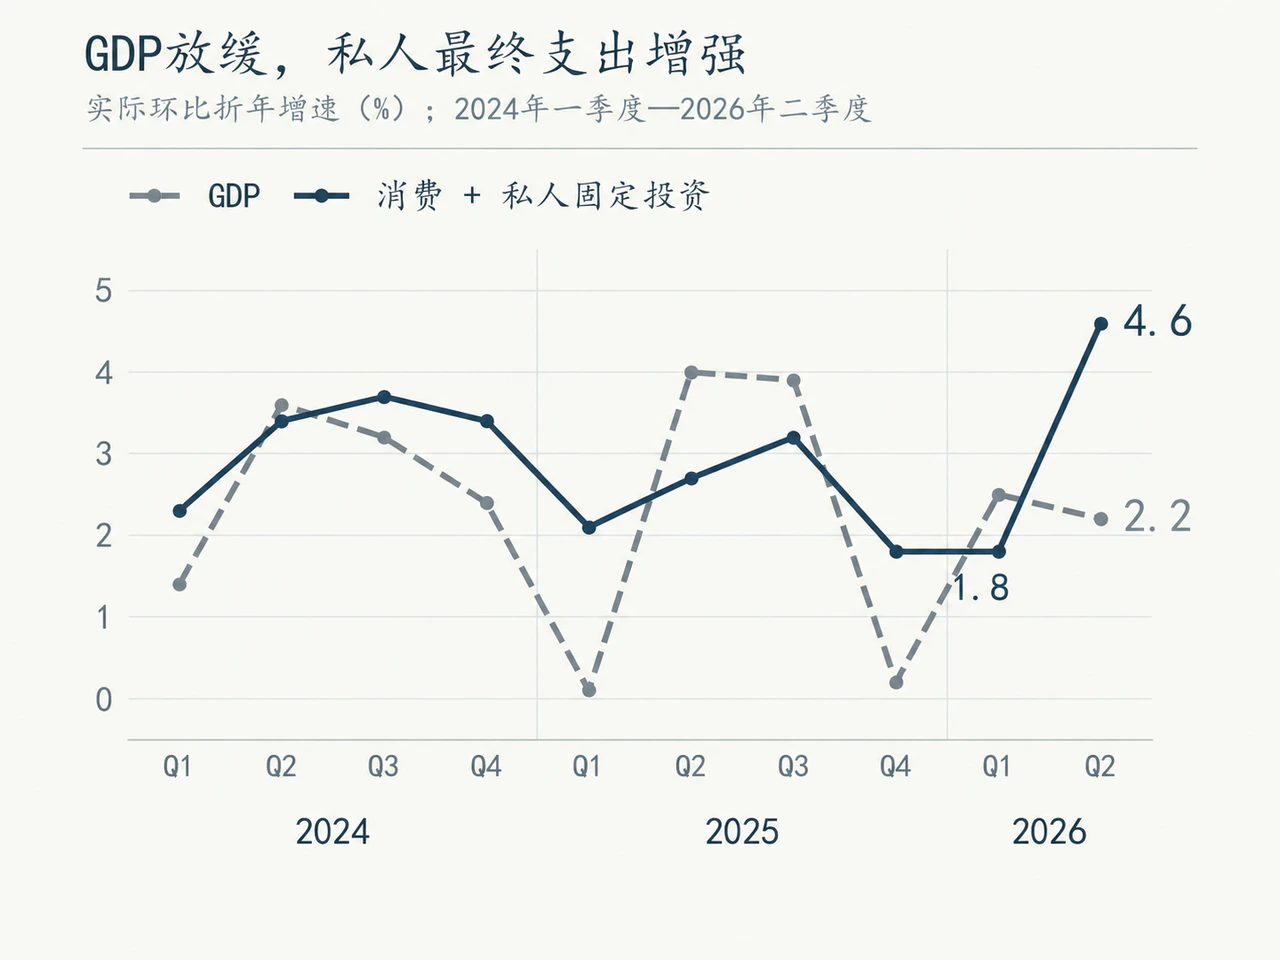
The details illustrate this divergence. First-quarter real final sales to private domestic purchasers grew 1.8% and contributed 1.56 percentage points to GDP, with government adding another 0.80. In the second quarter, this spending grew 4.6% and its contribution expanded to 3.86 points. Inventories and net exports, however, jointly subtracted 1.63 points and government's contribution fell to -0.01, leaving final real GDP growth of 2.2%.
Over a longer period, real final sales to private domestic purchasers grew above 3% in most quarters of 2024, then fell to 1.8% in both the fourth quarter of 2025 and first quarter of 2026 before rebounding to 4.6% in the second. Private domestic demand recovered in the second quarter rather than remaining consistently strong from the start of the year. Late-September official revisions raised second-quarter growth in this measure from 4.2% to 4.6%, confirming greater resilience in private final spending than previously estimated.
Income data also confirmed real expansion: second-quarter real GDI grew at an annualized 2.6%, and average real GDP and GDI growth reached 2.4%. Nominal GDP, however, grew at an annualized 8.5%, well above real output's 2.2%.
Consumption accelerates faster than real income
Nominal household income increased overall in the second quarter, with employee compensation, business and property income, and transfers all rising. After taxes and contributions, however, the increase in nominal disposable income was smaller than the increase in consumer spending.
| Income and expenditure item | Second-quarter change from the first quarter |
|---|---|
| Employee compensation | +1864 |
| Business and property income, including rent, interest and dividends | +884 |
| Transfer income | +633 |
| Effect on disposable income of increased social-insurance contributions | -234 |
| Effect on disposable income of increased current personal taxes | -345 |
| Net increase in disposable income | +2802 |
| Increase in personal consumption expenditures | +4672 |
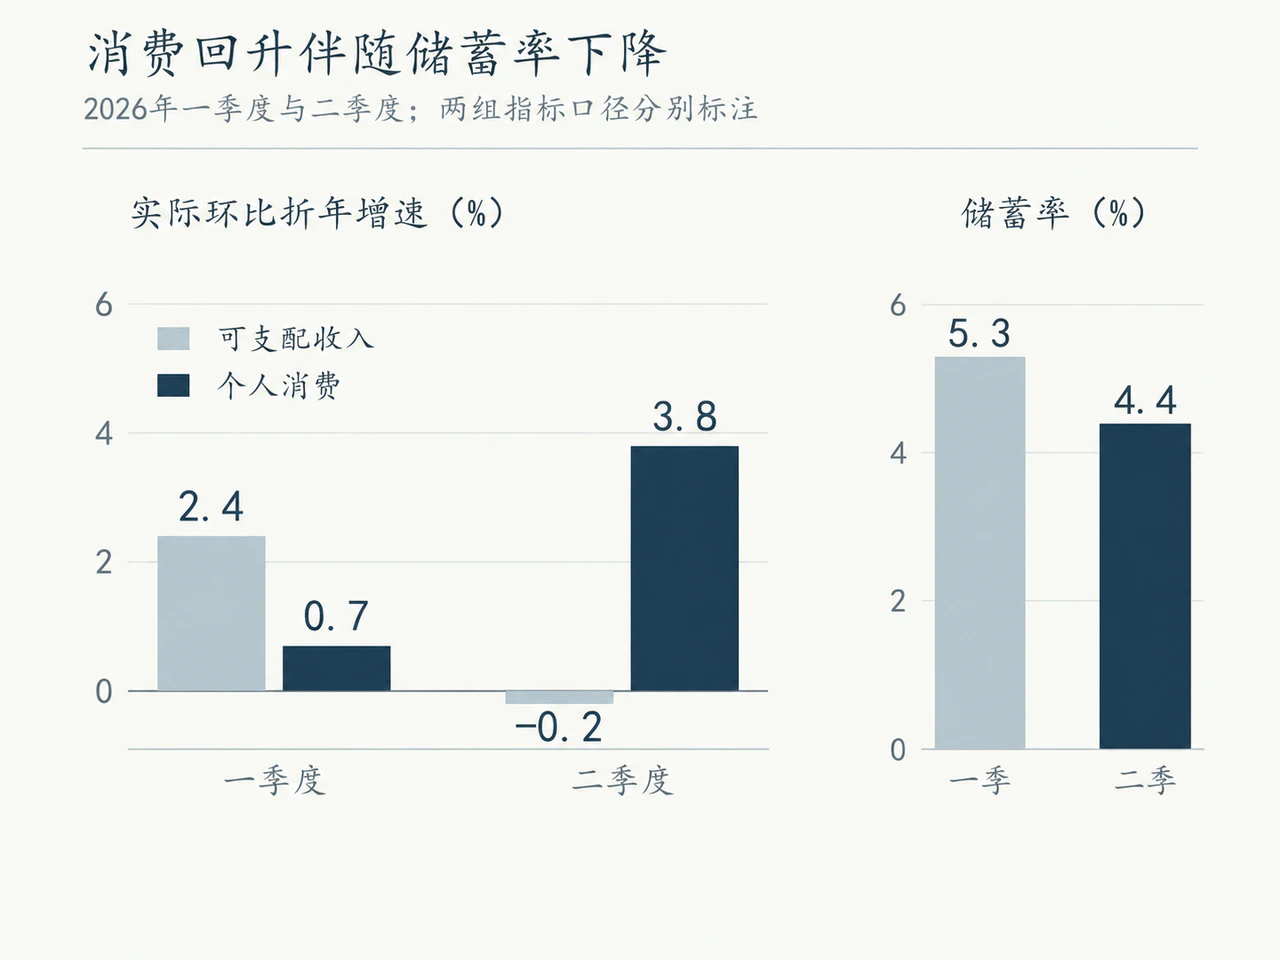
Second-quarter nominal disposable income grew at an annualized quarterly rate of about 4.8%, below PCE price inflation of 5.0%, causing real disposable income to fall 0.2%. Nominal aggregate wages and salaries grew about 4.5%; deflated by overall consumer prices, purchasing power likewise declined approximately 0.5%. Existing labor income supported spending, but shrinking real purchasing power at the margin means additional labor income alone cannot explain real consumption growth of 3.8%.
Consumption and other personal outlays grew faster than disposable income in the second quarter, reducing annualized saving by about $207.3 billion and lowering the saving rate from 5.3% to 4.4%.
The energy shock has already reached household bills. Combined expenditure on energy goods such as gasoline and on electricity and gas rose from 3.33% of disposable income in the fourth quarter of 2025 and 3.37% in the first quarter to 3.66% in the second. Nominal energy spending increased approximately $80.8 billion from the first quarter, measured as the difference between seasonally adjusted annual-rate levels, or about 17.3% of the increase in nominal consumption.
Overall, nonresidential investment supported the economy throughout the first half. Consumption became the main source of accelerating private demand after a weak first quarter, while resumed government operations explained much of the first-quarter GDP rebound. The second-quarter consumption recovery lacks a sustainable real-income growth driver, a potential concern for future slowing.
3. The underlying sources of U.S. growth in 2026
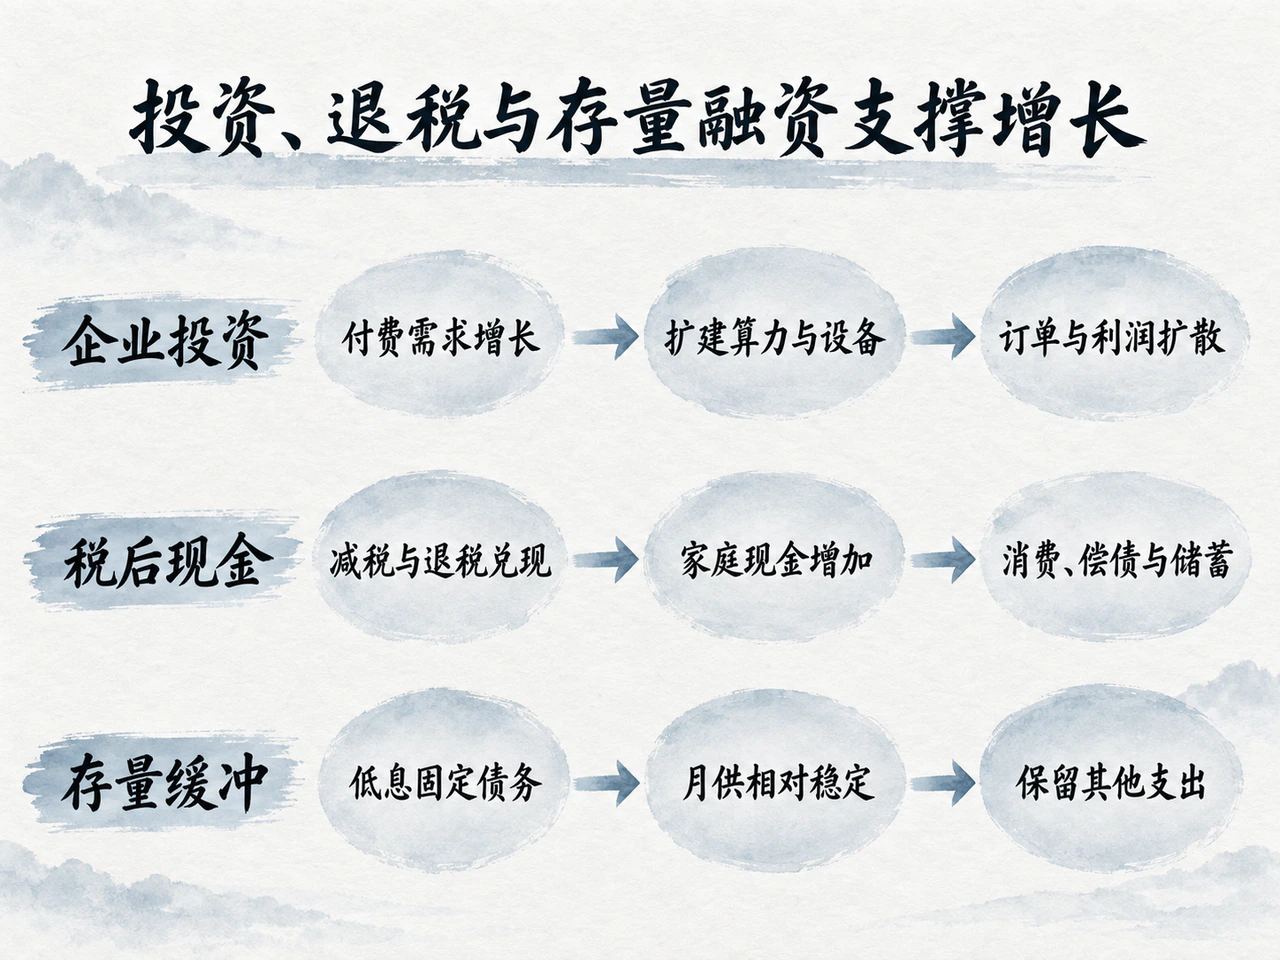
1. Corporate demand and technology investment create a positive loop of asset appreciation, profits and wealth effects
This year's strong final demand does not come solely from a handful of frontier model companies. Microsoft, for example, had more than 30 million paid Microsoft 365 Copilot seats at end-June 2026. Nearly 90% of all Microsoft Cloud revenue in fiscal 2026 came from customers other than frontier-model companies; excluding OpenAI, commercial remaining performance obligations still rose 25% year on year. Paid applications and ordinary enterprise orders demonstrate a broader customer base for cloud expansion. The 90% figure describes the customer mix of total cloud revenue, not incremental AI revenue; contracts are also fulfilled over time rather than representing current-quarter sales or cash receipts. In the quarter ended June, Azure and other cloud-services revenue rose 43% year on year; Microsoft Cloud revenue reached $59.3 billion, up 27%, and operating profit rose 18%. Operating cash flow was $55.4 billion and free cash flow $19.6 billion. Existing business cash flow and emerging customer revenue support further procurement and capital spending.
Against this backdrop, nominal data-center construction at annualized rates rose from a monthly average of $57.23 billion in the first quarter to $66.75 billion in the second and $81.98 billion in July–August. August construction was up 73.2% year on year. Total private nonresidential construction nevertheless fell 1.0% year on year, or 5.9% excluding data centers. Goldman Sachs estimated in August that domestic U.S. AI investment would total approximately $581 billion this year.
Capital expenditure also influences equity prices through supplier revenue and expected future profits; the S&P 500's forward price/earnings ratio declined from about 22 times at the start of the year to 19. Household and nonprofit net worth rose $12.8 trillion in the second quarter to $195.9 trillion, including a $10.7 trillion increase in directly and indirectly held equities. For equity-owning households, greater wealth increases expected available resources and may reduce additional saving needed to meet a wealth target. An Atlanta Fed September model, holding other conditions constant and assuming 3.5% inflation, estimated that a single year's nominal equity return 10 percentage points above baseline could raise that year's real consumption growth by about 0.9 percentage points. Investment, earnings and wealth-driven consumption thus form a positive loop, with corporate expansion, supplier profits and equity-owning households' spending reinforcing each other.
2. Concentrated spring tax refunds support household cash flow
Tax policy became a major macroeconomic variable this year. The One Big Beautiful Bill Act, or OBBBA, signed on July 4, 2025, extended core 2017 personal-income-tax arrangements that were due to expire and generated substantive tax relief this year. The Brookings Hutchins Center's September 30 fiscal-impact model estimated that tax provisions in the law supported annualized first- and second-quarter GDP growth by 0.52 and 0.51 percentage points, respectively, broadly unchanged between quarters.
The incremental tax cuts came from new provisions: the maximum child tax credit rose from $2,000 to $2,200; the 2025 state and local tax, or SALT, deduction cap increased sharply from $10,000 to $40,000, subject to income thresholds; and new deductions were introduced for eligible seniors, tips and overtime pay. A disconnect between retroactive tax relief and withholding concentrated the benefit in spring 2026. In August 2025, the IRS said personal-income-tax withholding tables would not be adjusted for the new law that year, so employers continued existing procedures. Eligible households did not immediately have less tax withheld; the accumulated difference became larger refunds or smaller balances due in the following filing season. Through April 17, 2026, IRS cumulative refunds reached $296.067 billion, up $42.951 billion, or 17.0%, year on year. The average refund rose from $2,942 to $3,275, an 11.3% increase.
Treasury modified-cash records show first-quarter personal refunds rising from $190.751 billion a year earlier to $216.392 billion, an increase of $25.641 billion. Second-quarter refunds rose from $111.393 billion to $143.064 billion, up $31.671 billion. Their real-economy effect is neither immediate nor one-for-one. Bank of America's May analysis around clients' refund-receipt windows showed only about 20% initially going directly to consumption, while 47% stayed in bank deposits, 26% repaid existing debt and 7% went to investments. Retained funds may be released gradually in later months, and debt repayment improves future household cash flow.
This liquidity injection broadly matches the widening second-quarter consumption improvement at the micro level. Bank of America's May–July card-spending data showed lower-income customers' seasonally adjusted nominal annual spending growth, on a three-month moving average, recovering from 3.1% in April to 4.8% in June. Higher-income customers' growth edged from 4.9% to 5.8%, narrowing the gap. June per-person card spending excluding gasoline still grew a resilient 5.6% year on year, with broad recovery in discretionary categories including dining, entertainment and optional retail purchases.
Looking ahead, structural tax relief lasts, but the growth impulse from concentrated refunds will fade. Some deductions legally run from 2025 through 2028. As households adjust W-4 withholding in 2026, benefits will increasingly enter regular paychecks, and future incremental refunds will depend on withholding rebalancing. The Hutchins Center model projects the tax channel's GDP contribution narrowing to about 0.29 and 0.28 percentage points in the third and fourth quarters. A persistently lower tax burden supports existing spending levels, but continuously raising growth still requires endogenous gains in employment and wages or stronger underlying willingness to consume.
3. Existing low-rate balance sheets buffer external shocks, while productivity strengthens supply flexibility
The economy's current resilience reflects its substantial capacity to absorb adverse oil, tariff and interest-rate shocks.
Tariffs raised price levels, but their aggregate negative impact did not intensify continuously in the first half. An April Fed estimate showed that tariffs imposed in 2025 had cumulatively raised core-goods PCE prices about 3.1% and core PCE prices about 0.8% through February. After some emergency-authority tariffs were removed in February, replacement measures offset only part of the decline. The effective tariff rate calculated by the St. Louis Fed from duties collected and import values fell from about 11% at end-2025 to below 7% in May. The Fed's July report likewise showed lower tariff-inclusive nonfuel import costs in the first half and exemptions for many high-tech imports. Strong corporate investment therefore also benefited substantially from temporarily reduced tariff resistance and exemptions for certain key equipment.
Interest-rate transmission likewise distinguishes existing burdens from new ones. The Fed raised its target range to 3.75%–4.00% only on September 16. First-half real activity mainly faced the existing high cost of earlier policy and markets' advance pricing of the tightening endpoint after the geopolitical conflict. The new increase's additional restraint will emerge gradually in subsequent quarters. High rates have already constrained new home demand and borrowers rolling short-term financing. Policy transmission exists, with a significant lag.
Households' large stock of low-rate mortgages forms a substantive defensive barrier. The Fed's July report noted that most outstanding U.S. mortgages remained locked below 4%, sharply below roughly 6.4% on newly originated 30-year fixed mortgages. Households unwilling to move or refinance do not have monthly payments repriced at current rates, preserving other consumption budgets. The large rate gap suppresses home turnover and residential investment while sheltering consumption. Debt-service ratios published September 22, before the late-September income revisions, showed required household principal and interest payments falling slightly from 11.16% of disposable income in the first quarter to 11.11% in the second, still below 11.73% in the fourth quarter of 2019. Aggregate debt service thus had not jumped with new-loan rates.
Lower aggregate leverage and accumulated wealth reinforce the buffer. Household debt was approximately 0.90 times disposable income in the second quarter, remaining near historical lows since the late 1990s. Aggregates nevertheless conceal imbalances: recent homebuyers, revolving credit-card borrowers and households with floating-rate debt face greater repayment pressure. Existing low-cost financing and accumulated savings cushion consumption against rate increases and slower hiring.
The corporate sector is similarly stratified. Ample operating cash flow and long-duration fixed-rate debt substantially delay increases in large firms' average interest costs, allowing strategic projects to proceed. Firms heavily reliant on short-term floating-rate borrowing and external refinancing face more immediate constraints. The Fed's July Senior Loan Officer Opinion Survey confirmed this divide: in the second quarter, 26.8% of surveyed banks narrowed loan spreads over funding costs for large and medium firms, 16.1% reported stronger loan demand from them, and approval standards were broadly steady. Competition from banks and nonbanks was the main reason for easier terms.
The same survey showed subdued small-business credit demand, weak mortgage demand and marginally tighter credit-card standards. This financial divergence closely matches resilient corporate investment and persistently weak residential investment at the macro level. Firms with broad funding access and ample internal cash keep supporting expenditure, while high rates continue squeezing marginal borrowers.
Systematic productivity improvements have sharply reduced growth's dependence on additional hours. BLS data released September 3 showed second-quarter nonfarm business output up 2.5% year on year but total hours up only 0.2%, lifting labor productivity 2.2% and unit labor costs a moderate 1.4%. This may partly explain output expansion alongside weak hiring. With slower labor-supply growth, weaker payroll additions cannot all be labeled collapsing final demand. Productivity lets firms expand output with limited hiring and eases unit labor costs, supporting continued expansion. Since the fourth quarter of 2019, productivity has grown about 2.1% annually, above the previous business cycle's 1.5%. Annual growth did ease from 2.9% in the first quarter to 2.2% in the second, but rapid AI development leaves considerable scope for future productivity gains.
Whether resilience lasts depends on a smooth handover among growth supports. AI and data-center construction have generated equipment and engineering demand; the next test is whether new computing capacity converts into sustained customer payments and whether revenue increasingly covers depreciation, energy, leasing and financing costs. Verified commercial returns give firms stronger grounds to continue expanding. For consumption, refunds, asset appreciation and earlier savings have provided room to spend, but as the concentrated refund boost fades, growth will rely more on employment, wages and real disposable income. With weak hiring, wages outpacing prices will determine whether recovery spreads to more income groups. Energy inflation continues eroding purchasing power, while refinancing maturing low-rate debt will gradually raise interest burdens and test household and corporate cash reserves. Productivity helps unit labor costs but cannot replace income growth or fully offset energy and financing increases. If new investment earns stable returns, real income takes over in supporting consumption and cost pressures stay manageable, the expansion can continue. If project receipts disappoint, households keep cutting savings to maintain spending, and energy and refinancing costs keep rising, existing buffers will weaken and growth face clearer slowing pressure.


