Three consecutive Maextro V800 test vehicles suffered fractured brake-pedal brackets during full-force braking tests from 100 kilometers per hour, on the third, fourth and second attempts, respectively. According to Economic Information Daily's report on Dongchedi's October 8 test, the testing party told media that peak force reached 1,612 newtons. After the mechanical support failed, the driver used emergency braking to slow down. Maextro responded that its braking system had been validated above national and industry standards, called the test an extreme nonstandard condition, said delivered vehicles had shown no similar failures, and promised structural optimization and free upgrades.
Mechanical failure at the same location in several vehicles under the same test brought a longstanding industry question to the fore: as launch schedules accelerate, are engineering tests and defect correction being squeezed?
Automakers' development clocks are indeed changing dramatically. McKinsey's 2025 automotive research found that some emerging Chinese EV makers take about 24 months from concept definition to production launch, including complete vehicle-platform development, compared with 40–50 months for comparable multinational projects—a reduction of 40%–52%. Determining whether this is rushed development at the expense of validation requires examining the engineering chain: which waiting periods have been eliminated, whether physical tests have hard limits, and whether R&D budgets around RMB 10 billion can support parallel validation across multiple product lines.
1. Traditional automakers' development cycles and validation processes
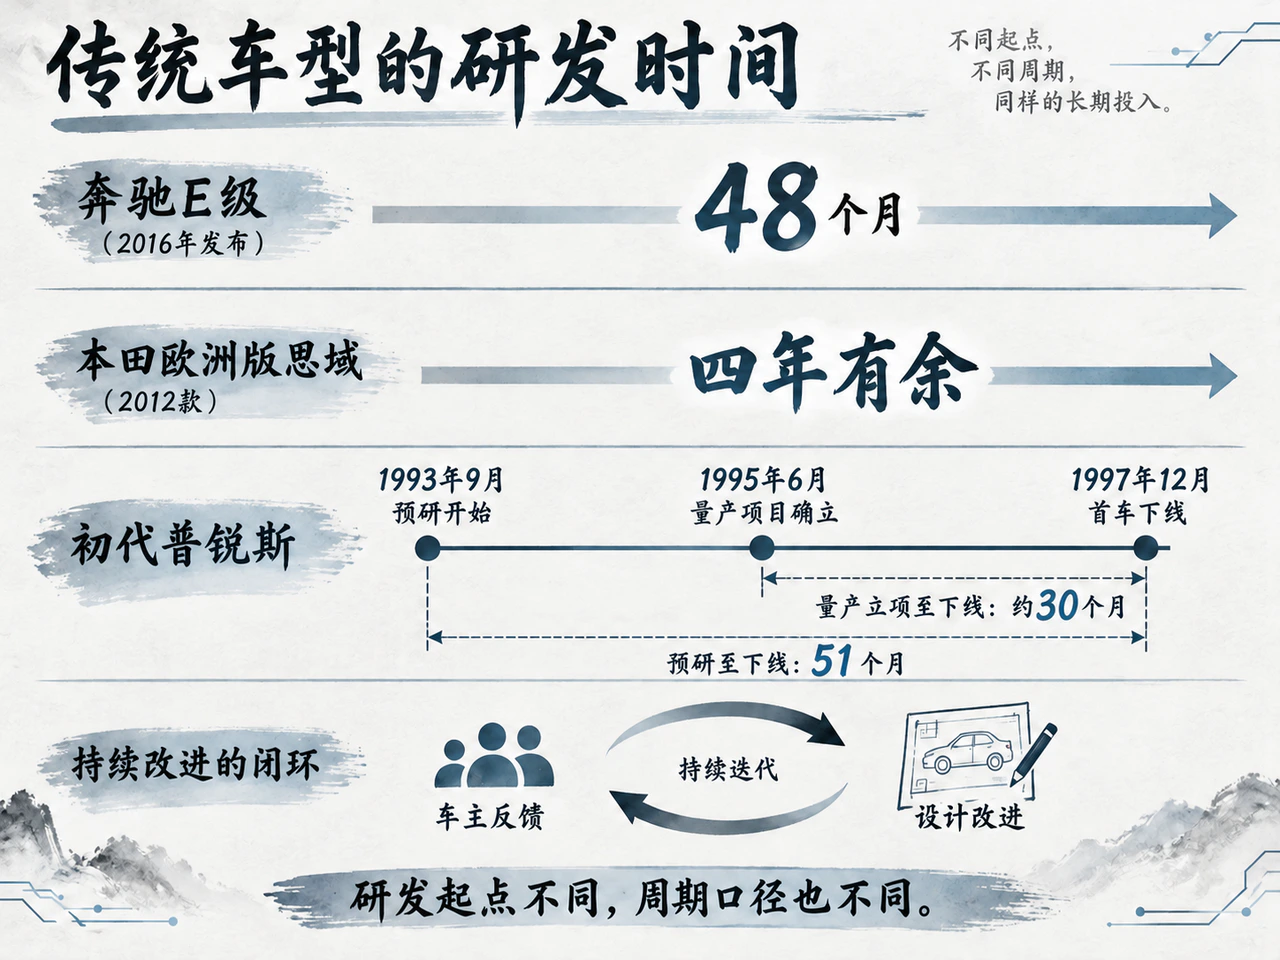
Vehicle development is systems engineering with tightly coupled components. Product definition, component modeling, prototype building, bench testing, engineering changes and production-process validation are interconnected. A small upstream change can create cascading effects: moving suspension hardpoints can cause wheel-envelope interference, while changing structural materials requires reassessing stamping dies, joining processes and fatigue life.
Representative models illustrate the time required. Honda's European five-door 2012 Civic took more than four years, with almost every part redeveloped or improved. When Mercedes-Benz unveiled the W213 E-Class in 2016, it disclosed approximately 1,200 engineers working over a full 48 months.
Pioneering an underlying technology can require much longer preliminary exploration. Toyota's first Prius took 51 months from the G21 concept study's launch in September 1993 to the first car leaving the line in December 1997. Counting only from formal approval of the production project in June 1995 narrows the cycle to around 30 months. The 21-month difference reflects different starting definitions. Comparing month counts without considering technical maturity at project approval often distorts development comparisons.
An established model line benefits from accumulated failure data. Honda used owner, dealer and media feedback on visibility, suspension noise, comfort and material feel to improve the Civic. But historical evidence has strict limits. It supports proven structures under the same loading patterns; new lightweight materials, changed load-bearing topology or altered stamping processes prevent direct reuse of fatigue-life data and require fresh physical validation. When Mercedes-Benz introduced steer-by-wire to the EQS in 2026, it still completed more than 1 million kilometers of dedicated bench, proving-ground and road testing. Brand experience cannot directly guarantee the life of an entirely new part.
2. How vehicle development accelerates, and where its limits lie
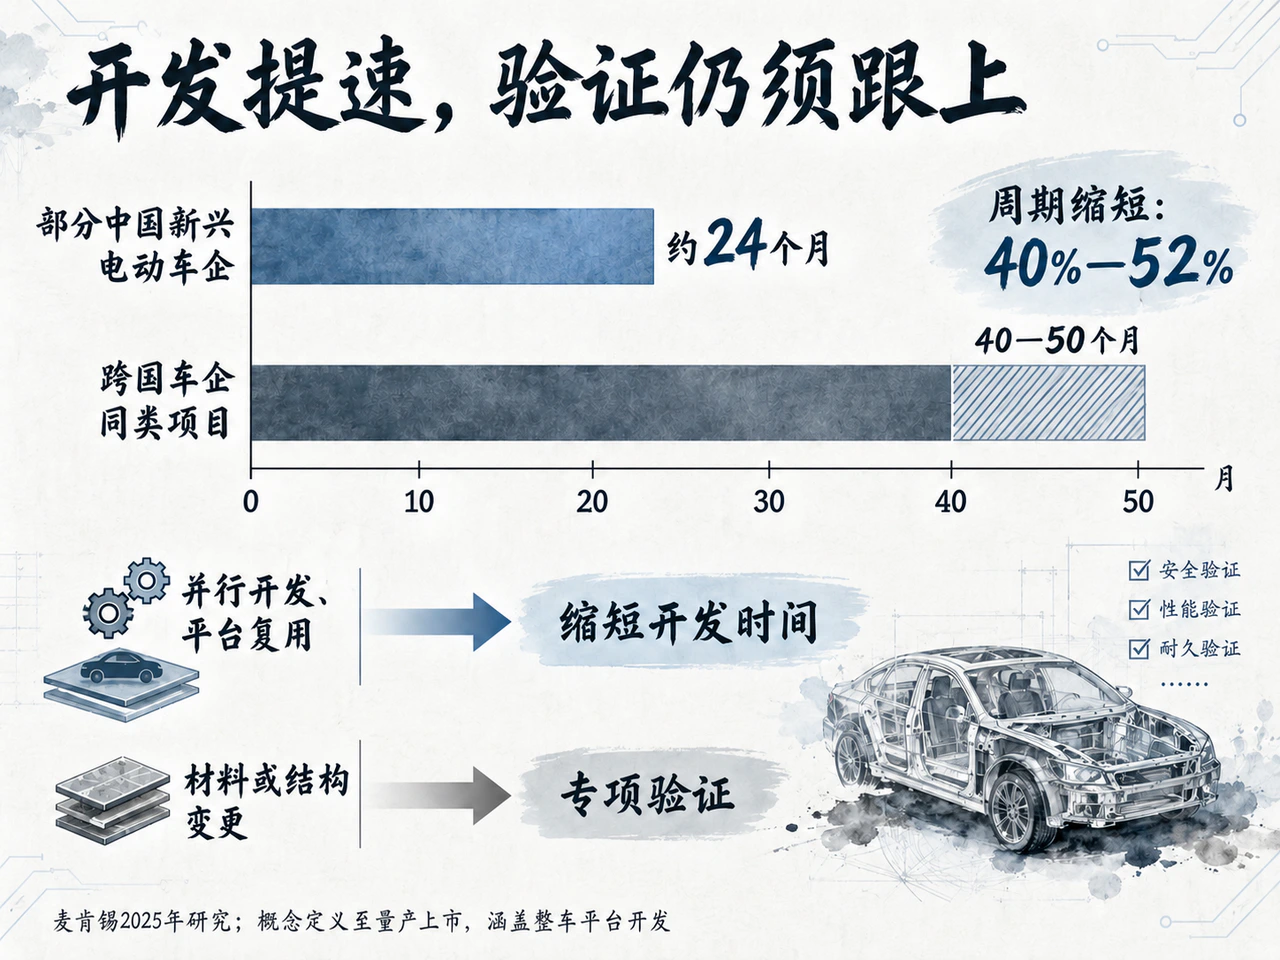
The first breakthrough behind some newcomers' 24-month cycles is removing sequential waits between departments. In a traditional linear process, manufacturing and procurement review production feasibility only after design drawings freeze. Stamping or assembly problems may emerge late in prototyping, forcing extensive rework. Digital collaboration and concurrent engineering bring manufacturing and supply-chain specialists in during early styling and design, resolving many conflicts in digital models. Calendar compression comes mainly from reorganizing work rather than mechanically cutting tests.
The second is extensive platform reuse. When XPeng introduced its SEPA2.0 architecture, it disclosed 80% module compatibility with subsequent models and planned a 20% reduction in later development cycles. Platforms allow early validation of chassis, electrical/electronic architecture and powertrains to be shared across models. Multinationals are adopting this approach: the Volkswagen–XPeng ID.UNYX 08 entered production in March 2026, with Volkswagen reporting 24 months to production maturity. Xiaomi took about three years from announcing its car project to launching its first production vehicle. Mature supply chains and experienced teams underpin faster development.
Sharing a platform does not mean load-bearing components are unchanged. A longer wheelbase, greater curb weight or a different battery layout alters dynamic loads on chassis parts. Cockpit and driver-assistance software can be iterated over the air, but stiffness or fatigue defects in mechanical load-bearing parts such as chassis and brakes generally require physical remedies including replacement hardware.
Automakers commonly use intensified accelerated tests to improve engineering turnaround. XPeng disclosed that P7 development used a four-post road simulator, collecting loads from 13 severe road types and running almost 300 hours continuously, which the company equated to 400,000 kilometers of fatigue damage. Before the 2017 Chrysler Pacifica launched, it underwent more than 5.47 million kilometers of road tests and several months of accelerated corrosion testing to simulate ten years of harsh-condition corrosion. The crucial condition is that the artificial load spectrum accurately maps real failure mechanisms.
Material fatigue has time-sequence characteristics that must be validated. An authoritative 2017 automotive-engineering study of a particular engine thermal-fatigue test involved at least 8,500 hot-cold cycles lasting seven minutes each, around 1,000 cumulative bench hours and at least eight weeks of bench occupancy. Engineers in the case believed key fatigue information emerged mainly in the second half. The proposed acceleration method was to use interim data to start downstream preparations earlier, rather than truncate physical testing.
Whole-vehicle durability mileage also cannot fully cover dedicated destructive limits for critical parts. Xiaomi used 576 test vehicles and accumulated 5.4 million kilometers before the SU7 launch. NIO's early ES8 and ES6 each underwent more than 3 million kilometers of road tests. Aggregate mileage demonstrates resource commitment, but whether a brake-pedal bracket withstands transient peak loads from hard or off-axis applications still requires deep, dedicated destructive-limit bench testing.
The real engineering trade-off often arises when testing exposes a defect. A 2004 concurrent-engineering management model showed that later upstream information changes increase downstream rework costs. If an automaker refuses any movement in a fixed launch date, the window to redesign a structure, remake tooling and repeat bench validation faces a systemic risk of severe compression.
3. The scale and evolution of R&D spending in China and overseas
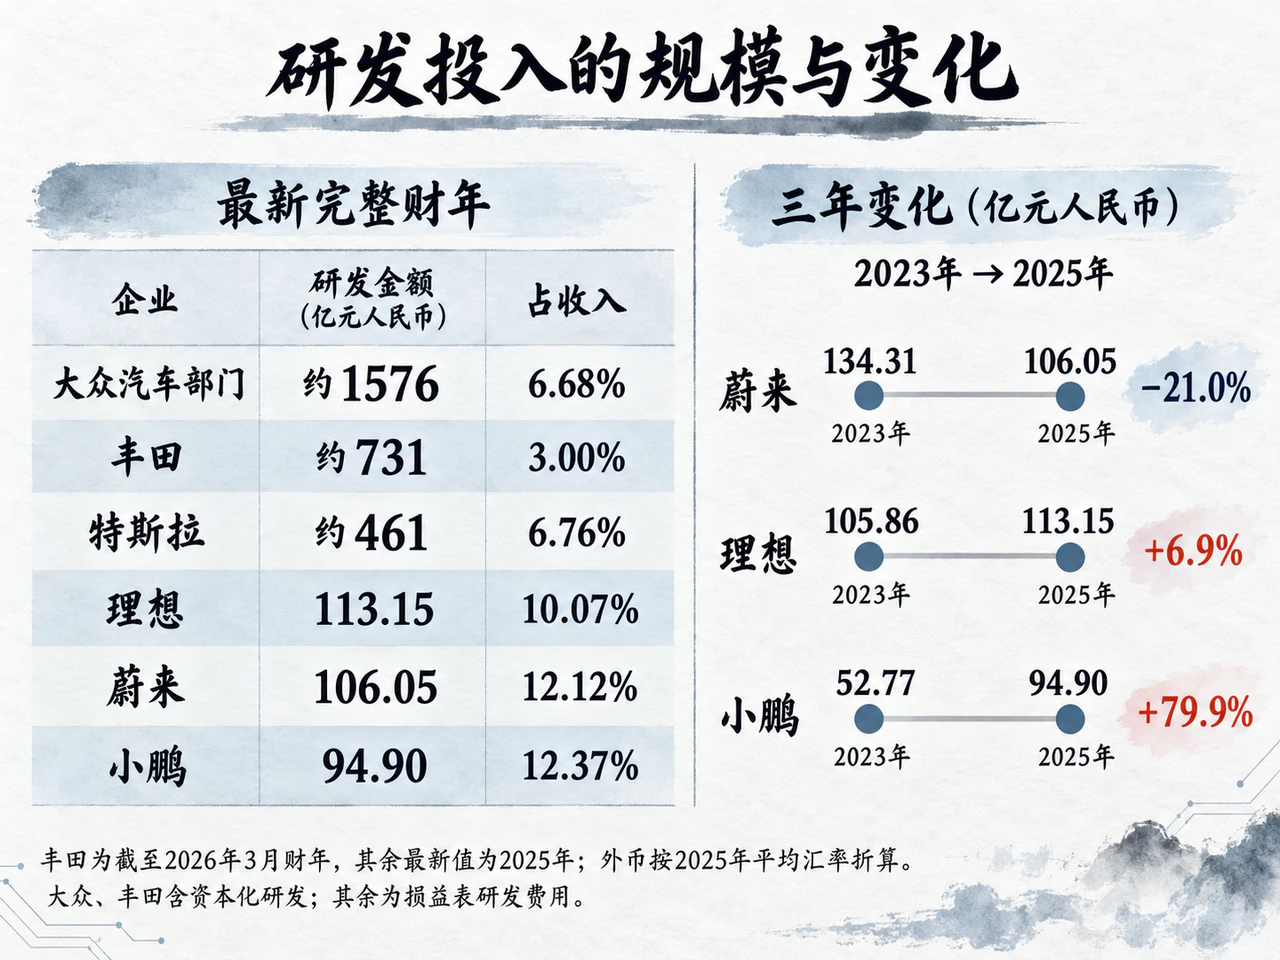
Ample funding supports the test matrix, but accounting R&D spending is not equivalent to one model's safety-validation budget. Platform research, vehicle projects, assisted-driving chips, cockpit ecosystems and capital-intensive test benches all draw from the same pool.
The latest complete fiscal-year accounts show marked differences in spending structure and intensity. European and Japanese automakers disclose total current R&D investment including capitalized amounts; Tesla and Chinese newcomers are presented using income-statement R&D expense.
| Company and scope | R&D amount (original currency) | Equivalent RMB (hundreds of millions) | R&D as a share of revenue |
|---|---|---|---|
| Mercedes-Benz Group | €9.680 billion | Approximately 786 | 7.32% |
| Volkswagen Automotive Division | €19.412 billion | Approximately 1,576 | 6.68% |
| Stellantis Group, including Chrysler and other brands | €6.098 billion | Approximately 495 | 3.97% |
| Toyota Group | ¥1.523 trillion | Approximately 731 | 3.00% |
| Honda Group | ¥1.175 trillion | Approximately 564 | 5.39% |
| Tesla Group, including energy, AI and other activities | $6.411 billion | Approximately 461 | 6.76% |
| NIO Group | RMB 10.605 billion | 106.05 | 12.12% |
| Li Auto Group | RMB 11.315 billion | 113.15 | 10.07% |
| XPeng Group | RMB 9.490 billion | 94.90 | 12.37% |
| Xiaomi Group, all businesses | RMB 33.132 billion | 331.32 | 7.25% |
Note: Foreign currencies are converted using the ECB's average 2025 reference rates. Toyota and Honda cover the fiscal year ending March 31, 2026; the others cover calendar 2025. Xiaomi Group does not disclose separate automotive R&D.
NIO, Li Auto and XPeng maintained high R&D expense ratios of 10%–12.4%, well above Toyota's 3.00% and Volkswagen's 6.68%, reflecting an aggressive emphasis on technological iteration. In absolute size, however, each newcomer's annual spending of around RMB 10 billion amounted to only 21%–25% of Tesla's and 6.0%–7.2% of Volkswagen's Automotive Division spending.
Expense ratios are also heavily affected by current revenue. XPeng's 2025 R&D expense grew 47.0%, but revenue rose 87.7%, diluting the ratio from 15.8% to 12.4%. Li Auto moved the other way: R&D rose only 2.2%, yet lower revenue pushed the ratio from 7.66% to 10.07%. Holding 2024 R&D spending fixed and changing only revenue shows that the denominator contributed 2.19 percentage points of the increase. This did not mean physical engineering resources grew by a third.
Accounting differences also affect comparability. Stellantis' 2025 income-statement R&D cost was €11.145 billion, but included amortization of earlier projects and €6.193 billion in impairments and write-offs. Adjusting these items and adding current capitalized development gives current investment of €6.098 billion. Stock-based compensation represented 20.8% of Tesla's R&D. Accounting totals cannot be translated linearly into test-bench or vehicle-testing hours.
Three-year trends make capital-allocation priorities clearer:
| Company and unit | 2023 (first year) | 2024 (second year) | 2025 (final year) | Final-year change from first year |
|---|---|---|---|---|
| Toyota (trillions of yen) | 1.202 | 1.326 | 1.523 | +26.7% |
| Honda (trillions of yen) | 0.976 | 1.211 | 1.175 | +20.3% |
| Tesla (hundreds of millions of dollars) | 39.69 | 45.40 | 64.11 | +61.5% |
| NIO (hundreds of millions of RMB) | 134.31 | 130.37 | 106.05 | −21.0% |
| Li Auto (hundreds of millions of RMB) | 105.86 | 110.71 | 113.15 | +6.9% |
| XPeng (hundreds of millions of RMB) | 52.77 | 64.57 | 94.90 | +79.9% |
Note: Chinese automakers and Tesla cover calendar years 2023–2025. Japanese automakers cover complete fiscal years ending in March of the following year.
Over three years, XPeng and Tesla expanded R&D rapidly, Li Auto maintained modest steady growth, and NIO retreated rationally from earlier highs. Cumulatively, however, NIO still spent RMB 37.1 billion, above Li Auto's approximately RMB 33 billion and XPeng's approximately RMB 21.2 billion. Past spending builds chassis and algorithm assets, but the match between current budgets and newly approved models determines validation resources per vehicle.
Cash-flow health directly determines the R&D safety buffer. In 2025, inventory and supplier-payment timing changes helped turn Li Auto's operating cash flow from a RMB 15.933 billion inflow the previous year to an RMB 8.611 billion outflow; year-end cash and equivalents were RMB 56.692 billion. XPeng moved from a RMB 2.01 billion operating outflow to an approximately RMB 8.26 billion inflow, with year-end cash and equivalents of RMB 17.330 billion.
These finite resources risk dilution across multiple fronts. In 2025, NIO simultaneously supported its differently positioned NIO, Onvo and Firefly brands. Li Auto committed fully to battery-EV development alongside its extended-range lineup. Tesla's two mature models, the Model 3 and Model Y, delivered a combined 1.585 million vehicles, 96.9% of its total, distributing R&D over a much larger scale. If newcomers' model and derivative-project counts grow faster than budgets, engineering staff and bench-validation resources per vehicle inevitably face pressure.
4. In-house and contract manufacturing among new automakers
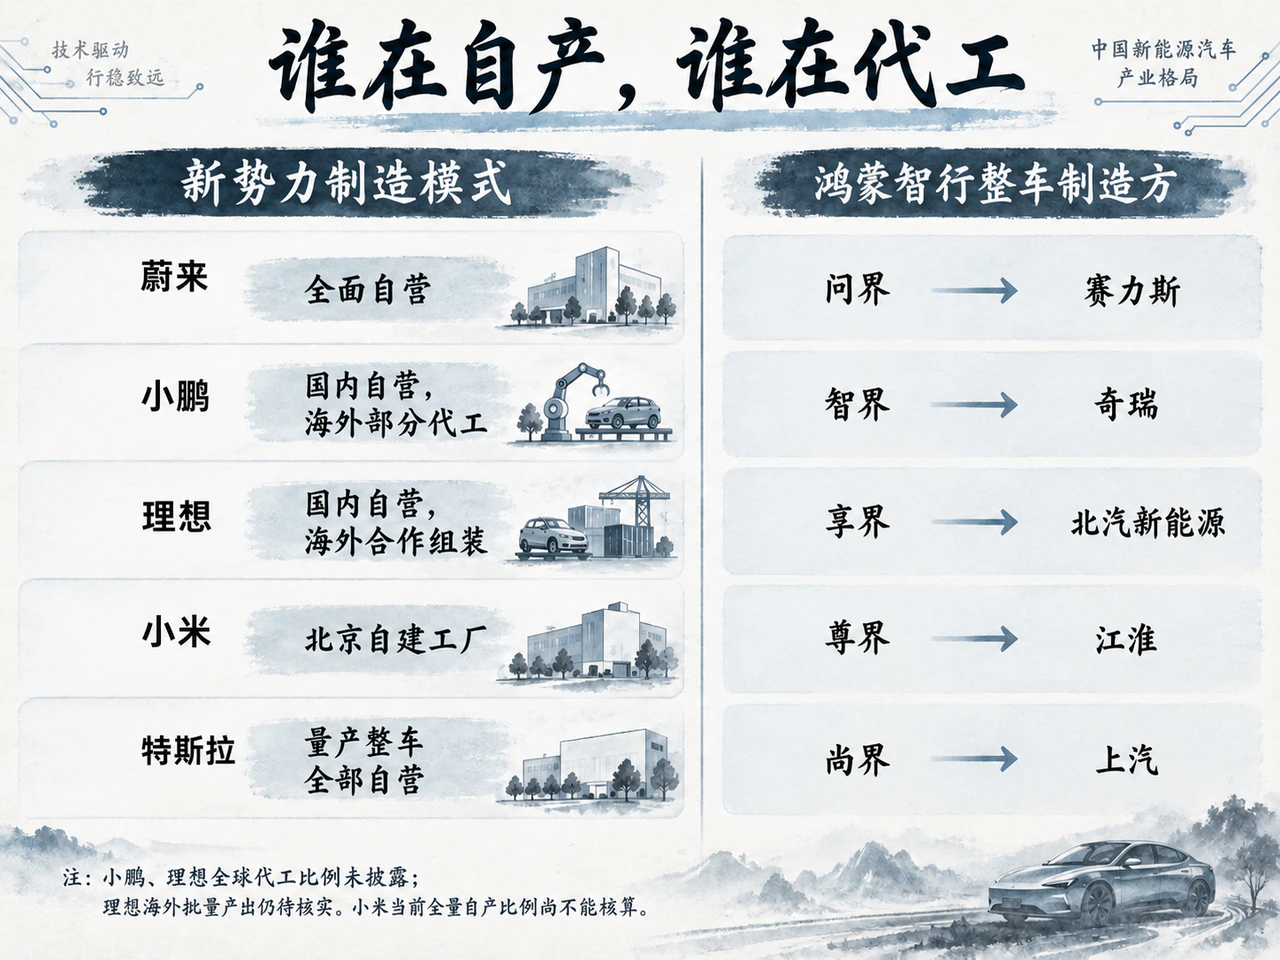
As development accelerates, production organization is diverging. Asset acquisitions have moved NIO entirely into independent in-house manufacturing. XPeng combines domestic in-house operations with some asset-light overseas contract production. Xiaomi's own Beijing factory overturns the contract-manufacturing perception, while Huawei's partnership ecosystem keeps whole-vehicle manufacturing outside Huawei.
| Company | Current manufacturing model | Actual facilities and production entities |
|---|---|---|
| NIO, including Onvo and Firefly | Entirely in-house | Operates F1, F2 and F3 facilities in Anhui; acquired JAC partnership assets at end-2023 and moved fully to independent manufacturing in early 2024 |
| XPeng | Domestic in-house production; some overseas contract manufacturing | Own facilities including Zhaoqing and Guangzhou; Magna in Austria manufactures G6/G9/P7+, EPMB subsidiary PJVM assembles G6 in Malaysia, and XPeng owns 90.1% of Indonesia's EIDO; global contract-production share not disclosed |
| Li Auto | Domestic in-house production; overseas assembly partnerships | Owns Changzhou factory and operates a leased Shunyi factory in Beijing; pursuing SKD assembly with Kazakhstan's Allur; global contract-production share not disclosed |
| Xiaomi | In-house manufacturing confirmed; current share of total output made in-house cannot yet be calculated | Manufactured at Xiaomi's own Beijing Yizhuang factory by Xiaomi EV Technology Co., Ltd.; early filings used BAIC's qualifications |
| Tesla | All current mass-produced complete vehicles made in-house | Relies on its own gigafactories in California and Texas, Shanghai and Berlin, among others; no third-party contract manufacturing |
In XPeng's overseas network, the X9 was assembled at Indonesia's Handal factory in 2025. In May 2026 XPeng acquired 90.1% of local manufacturing entity EIDO, a capital investment in the manufacturer; detailed production-line operation and quality-control responsibilities have not been fully disclosed. Li Auto's localization partnership with Kazakhstan's Allur has been disclosed, but as of autumn 2026 consistent evidence of commercial volume output was still needed. For Xiaomi, a February 2025 People's Daily factory visit and origin filings confirmed that models then on sale came from Xiaomi's own Beijing factory. Its earlier use of BAIC off-road-vehicle qualifications in filings became history after independent production approval.
The five HIMA partnership brands have clearly identified whole-vehicle manufacturers:
| Brand | Whole-vehicle manufacturer |
|---|---|
| Aito | Seres |
| Luxeed | Chery Automobile |
| Stelato | BAIC BluePark |
| Maextro | JAC Motors |
| Shangjie | SAIC Motor |
Huawei explicitly positions itself as an incremental components supplier and sales-service provider, with complete vehicles manufactured by traditional automakers. Under JAC's 2023 cooperation announcement, JAC has overall responsibility for product development and builds production facilities, while Huawei or a designated third party supplies sales services; later agreements define detailed development responsibilities. The V800's production on a JAC line is established. But for a critical load-bearing safety part such as the brake-pedal bracket, more detailed development agreements and engineering procedures are needed to establish which engineering authority ultimately closes the loop on mechanical specifications, supplier admission and bench-durability approval.
Contract manufacturing has never inherently meant poor quality. Magna Steyr has built the Mercedes-Benz G-Class since 1979, surpassing 500,000 cumulative units in 2023. In-house production facilitates immediate feedback between design and production processes, while contract manufacturing quickly reuses existing plants and skilled labor. The model alone cannot determine quality. What matters is enforcement of quality gates and engineering authority to stop the line and correct tolerance deviations.
5. Development speed and quality risk in recall cases
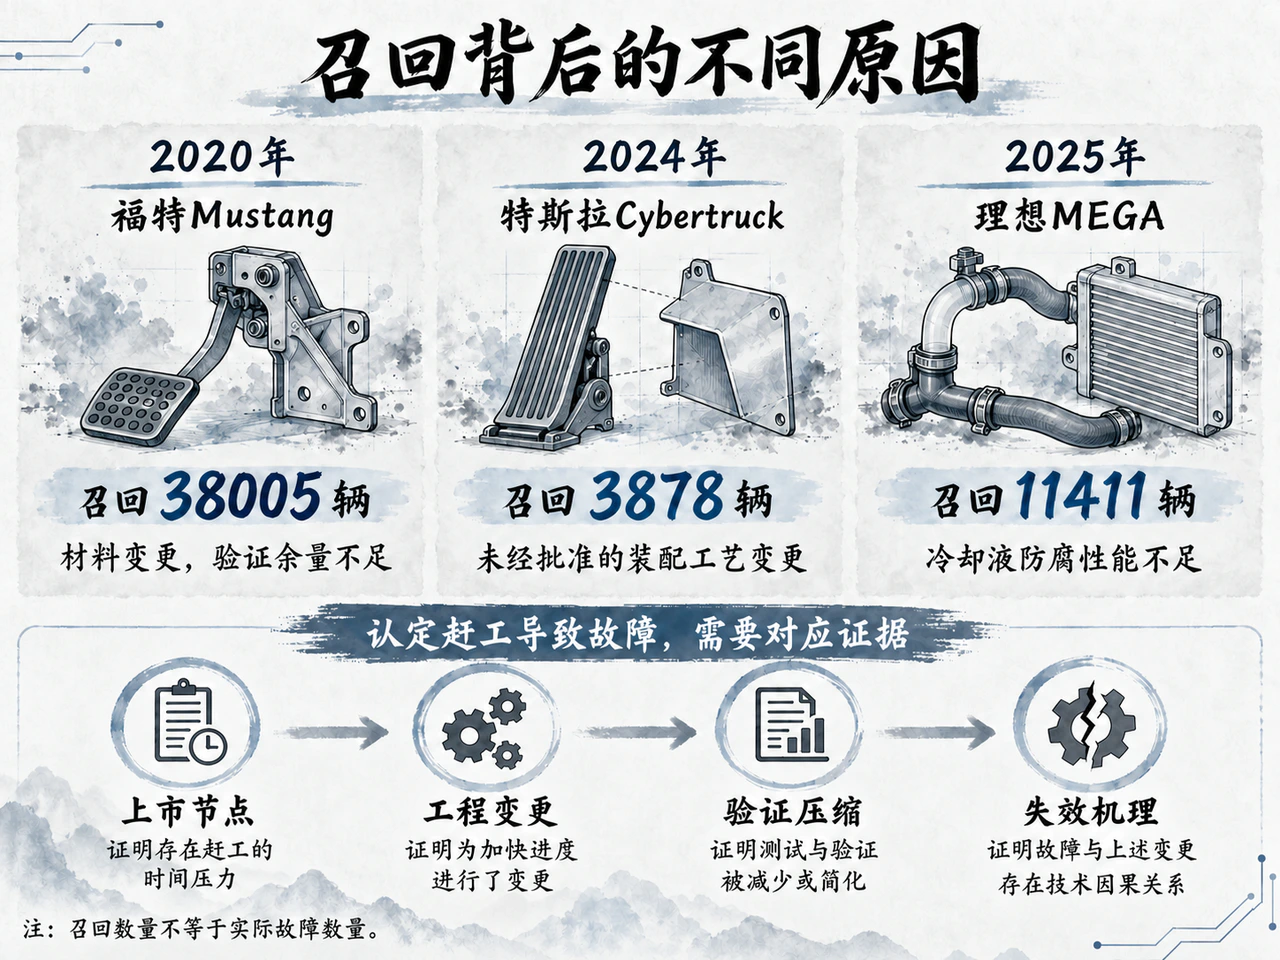
Regulatory scrutiny of excessive development speed has become substantive. On September 11, 2026, the Ministry of Industry and Information Technology warned that some manufacturers focused one-sidedly on cost cutting and installed inadequately tested technologies or designs, creating systemic safety hazards. On October 10, four departments sought public comment on vehicle innovation, design and R&D testing and validation management. These actions give a clear regulatory direction, but broad requirements cannot simply classify a particular failure in one test.
Historical recalls reveal different engineering causes behind failures in structural and safety parts:
- Ford Mustang: insufficient validation after a material change. In 2020 Ford recalled 38,005 automatic-transmission 2020 Mustangs because brake-pedal brackets could fracture. Changing bracket material from polyamide (PA) to polypropylene (PP) weakened robustness under hard braking. Ford's recall report identified insufficient specification and design-validation margins. Even a century-old automaker's mature model can develop a fatal hazard if one material change is not thoroughly revalidated.
- Li Auto MEGA: inadequate coolant corrosion protection. In October 2025 Li Auto recalled 11,411 model-year 2024 MEGAs. The regulator said insufficient coolant corrosion protection could, under specific long-term conditions, corrode and cause leaks in cooling aluminum plates in the battery pack and front-drive motor controller, with thermal-runaway risk in extreme cases. The failure involved coolant protection and corrosion under particular prolonged conditions.
- Tesla Cybertruck: an unapproved assembly-process change. In 2024 Tesla recalled 3,878 Cybertrucks because the accelerator pedal cover could slip and jam. Investigation found that an unapproved soap lubricant had been introduced during assembly. Residual lubricant reduced pedal-pad retention. The defect involved an unauthorized production-process change.
Recall counts define the population isolated for risk, not the number actually damaged. None of these failures alone establishes that a company deliberately skipped tests to rush a launch. Demonstrating an inevitable link between a mechanical fracture and accelerated development requires a rigorous causal chain: an exact launch deadline exerting pressure, an engineering change or cost concession affecting the part, substantive compression or omission of validation, and the specific physical failure mechanism.
The data describe a clear industry reality. Research finds that some emerging Chinese automakers have vehicle development cycles 40%–50% shorter than those of other automakers. Yet behind R&D ratios above 10% at NIO, Li Auto and XPeng, per-model funding and test benches face severe competition across product lines. Speed reshapes competition, but material mechanics and fatigue aging obey irreversible physical laws.
For the Maextro V800 fracture controversy, companies and the industry most need a transparent engineering account rather than an exculpatory description of an extreme nonstandard test: what ultimate-load margin was specified for the bracket, why original validation missed this failure mode, and what retesting conditions the optimized structure passed. That is the only answer that can resolve anxiety over faster vehicle development.
As of the afternoon of October 11, 2026, Beijing time. This article analyzes public financial statements and engineering-test reports and does not constitute investment advice.


