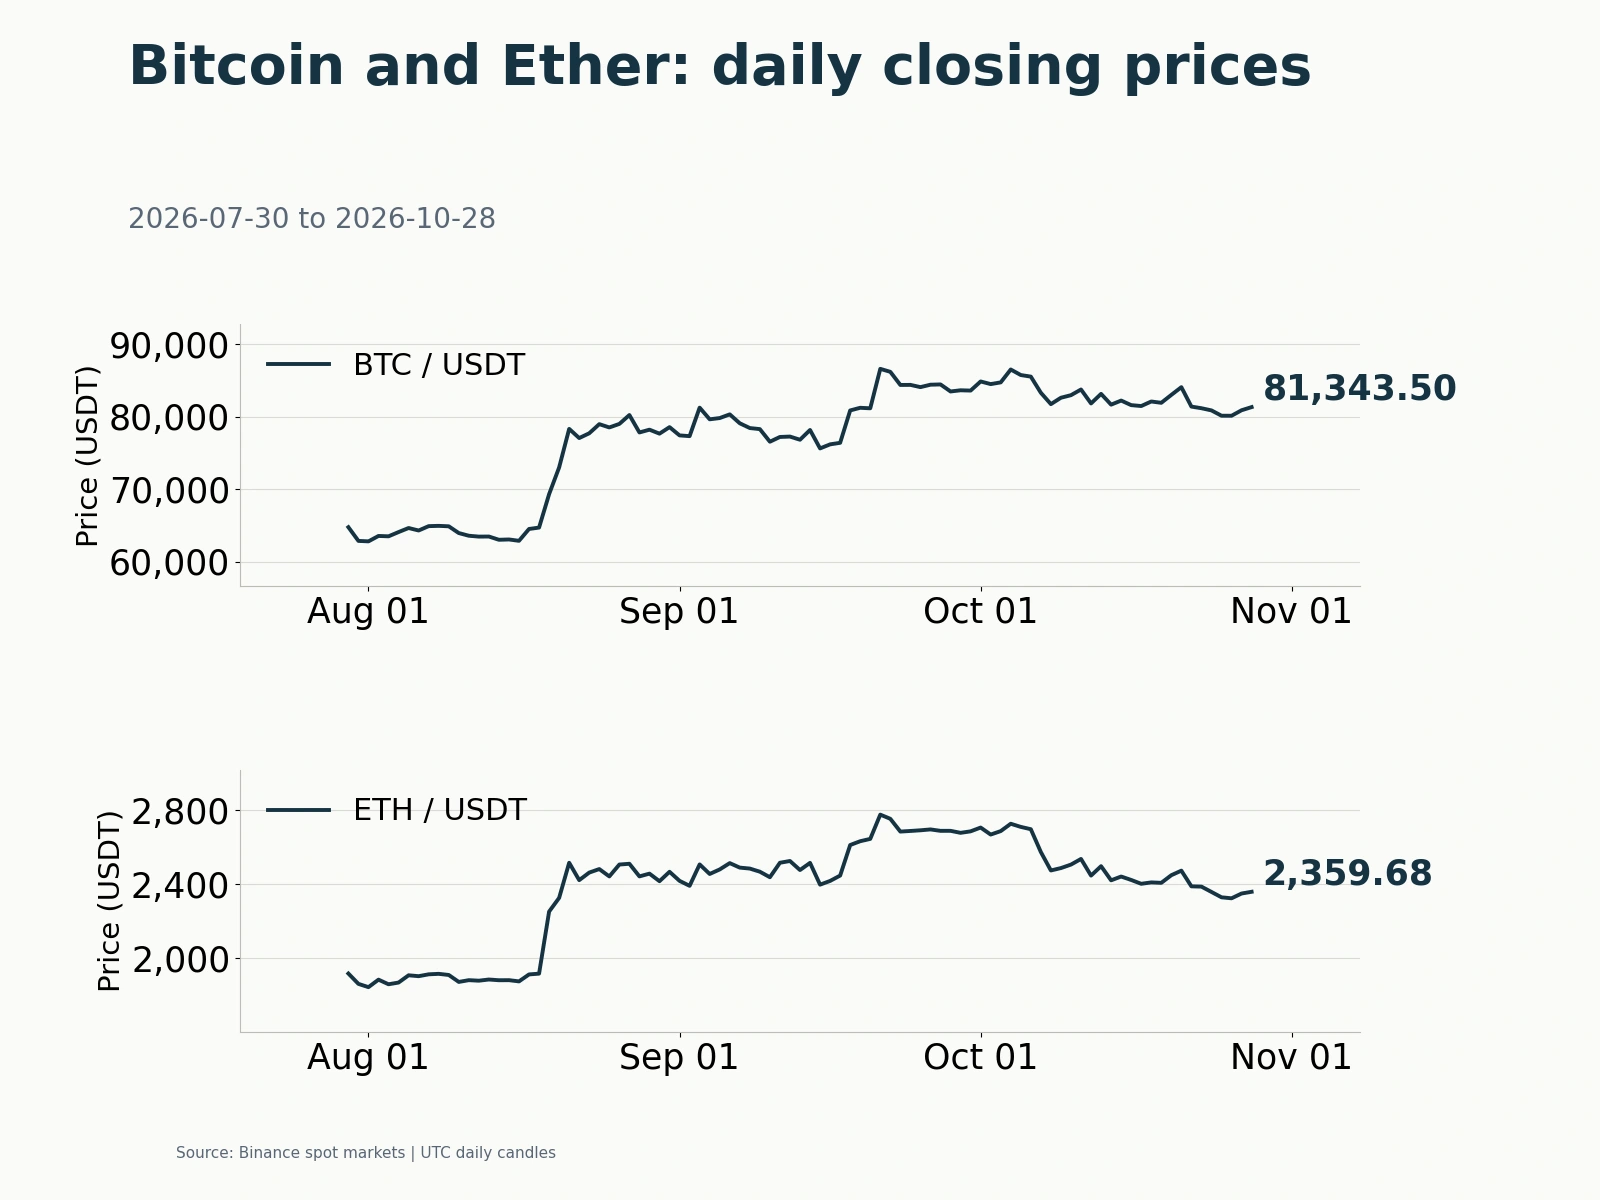
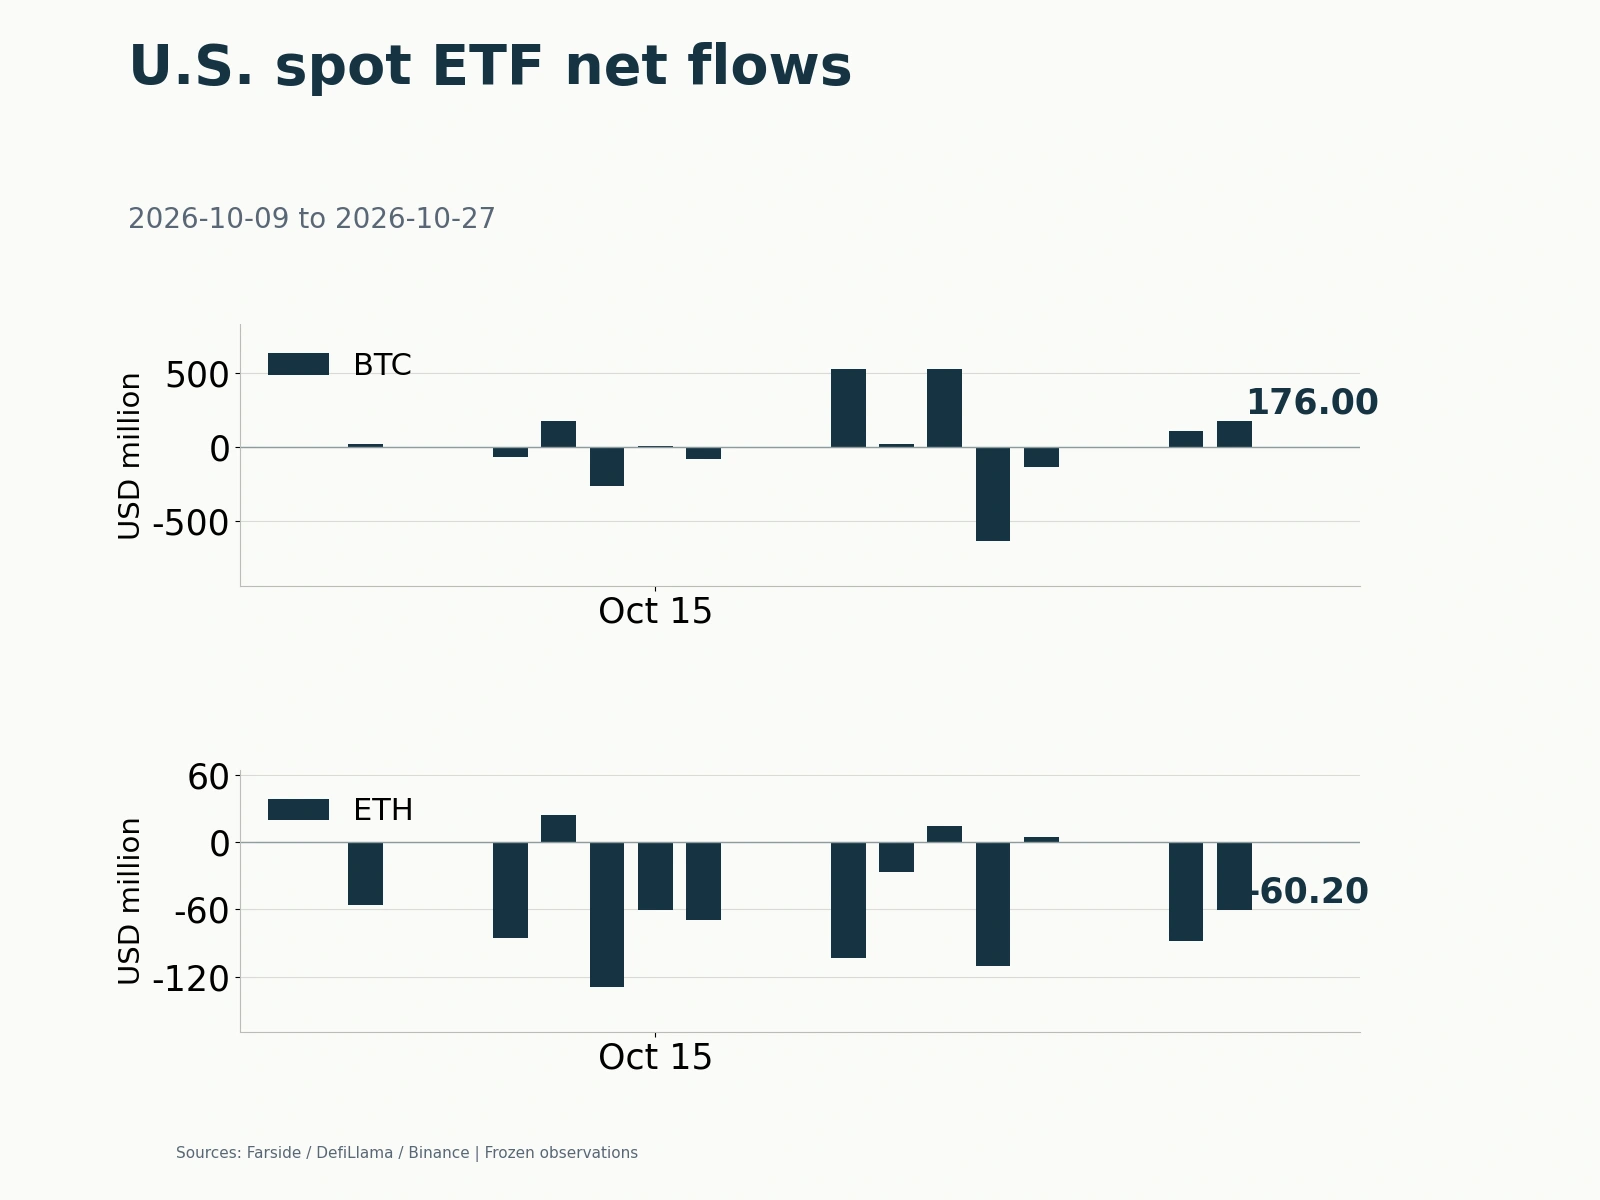
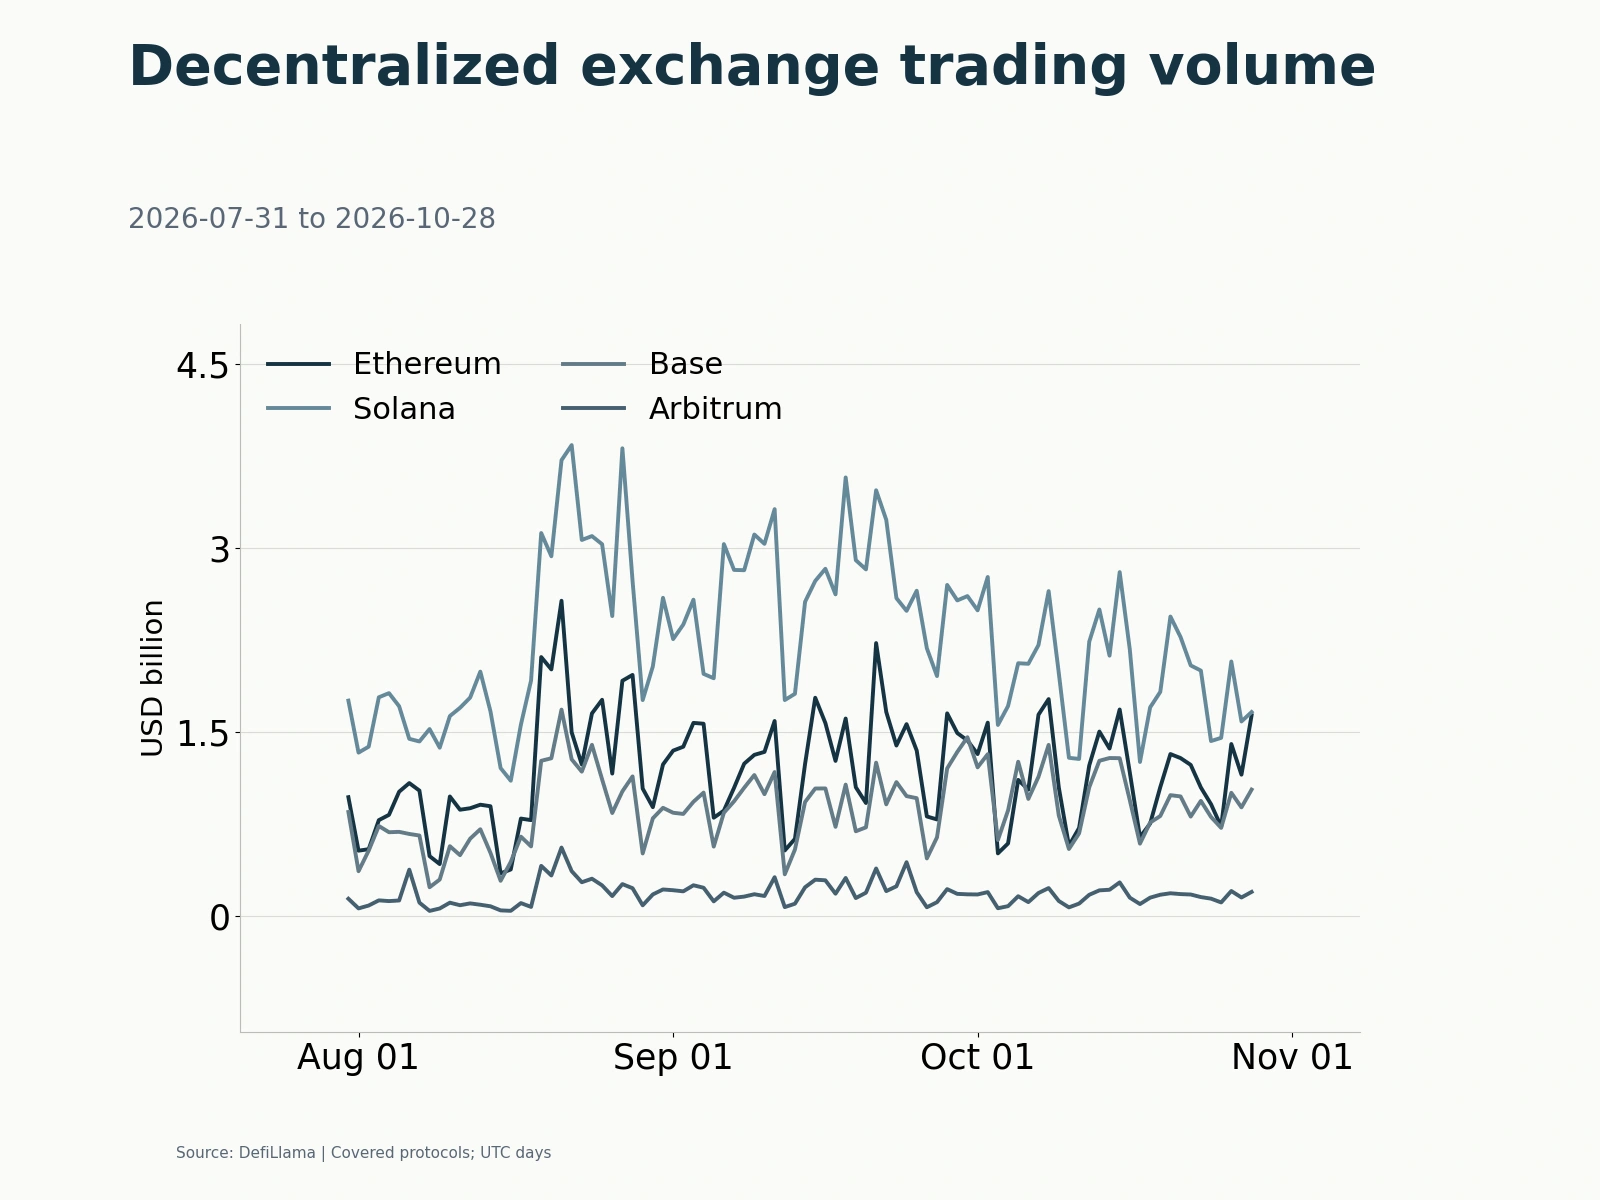
The current crypto-market rebound has yet to attract a reinforcing wave of fresh money. Securities channels, on-chain liquidity and derivatives all suggest that overall risk appetite remains cautious. U.S. spot ETFs continued to record net outflows on October 12; dollar stablecoin supply contracted over the latest week despite rising over the month; and open interest in Binance BTC and ETH contracts both declined in coin terms on October 13. The existing pool of capital remains, but long-term allocations and short-term risk-taking have yet to combine into upward momentum.
Spot ETFs record $150 million in daily net outflows; stablecoin supply declines over the week

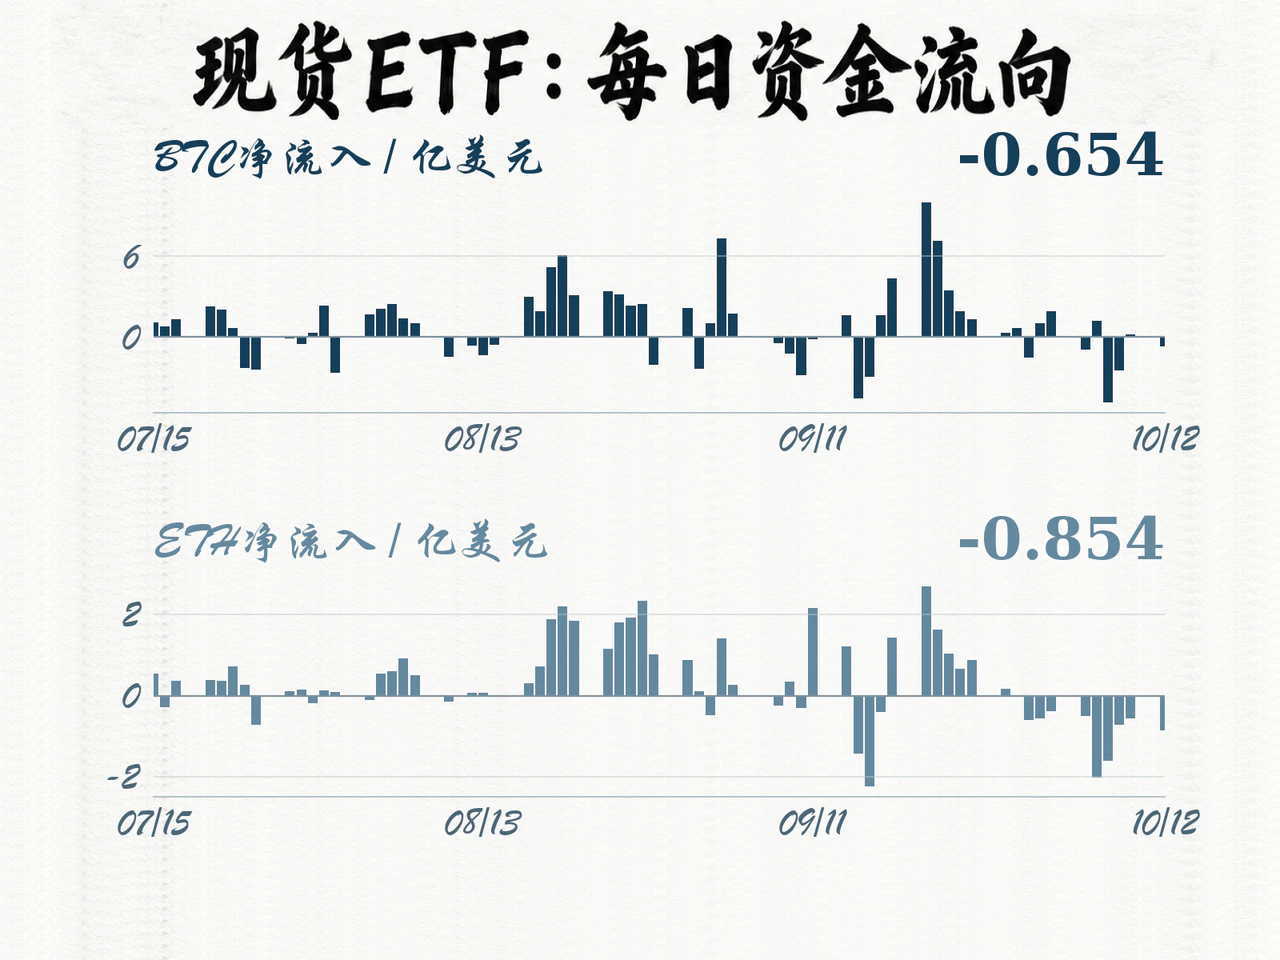
Farside data showed net outflows of $65.4 million from U.S. spot Bitcoin ETFs on October 12, all from BlackRock's IBIT. Spot Ether ETFs lost $85.4 million, comprising $75.1 million from ETHA and $10.3 million from Grayscale's ETH. The two product groups lost a combined $150.8 million that day, with redemption pressure heavily concentrated in leading funds.
Ether's outflow pressure showed greater persistence. From September 29 through October 12, spot Ether ETFs recorded ten consecutive trading days of net outflows. In the eight trading sessions since the beginning of October alone, cumulative outflows reached $720.4 million, compared with $451.7 million for Bitcoin ETFs. Bitcoin experienced several intervening days of net inflows, whereas Ether allocations continued to leave, revealing a clear divergence in institutional allocation expectations.
In the previous week, October 5–9, Bitcoin and Ether ETFs lost $678.9 million and $542.2 million, respectively, for a combined $1.2211 billion. The October 12 redemptions showed that the previous week's reduction in allocations had continued into the new week. Weak subscriptions and redemptions through securities channels directly reduced the marginal capacity of outside money to absorb spot supply.
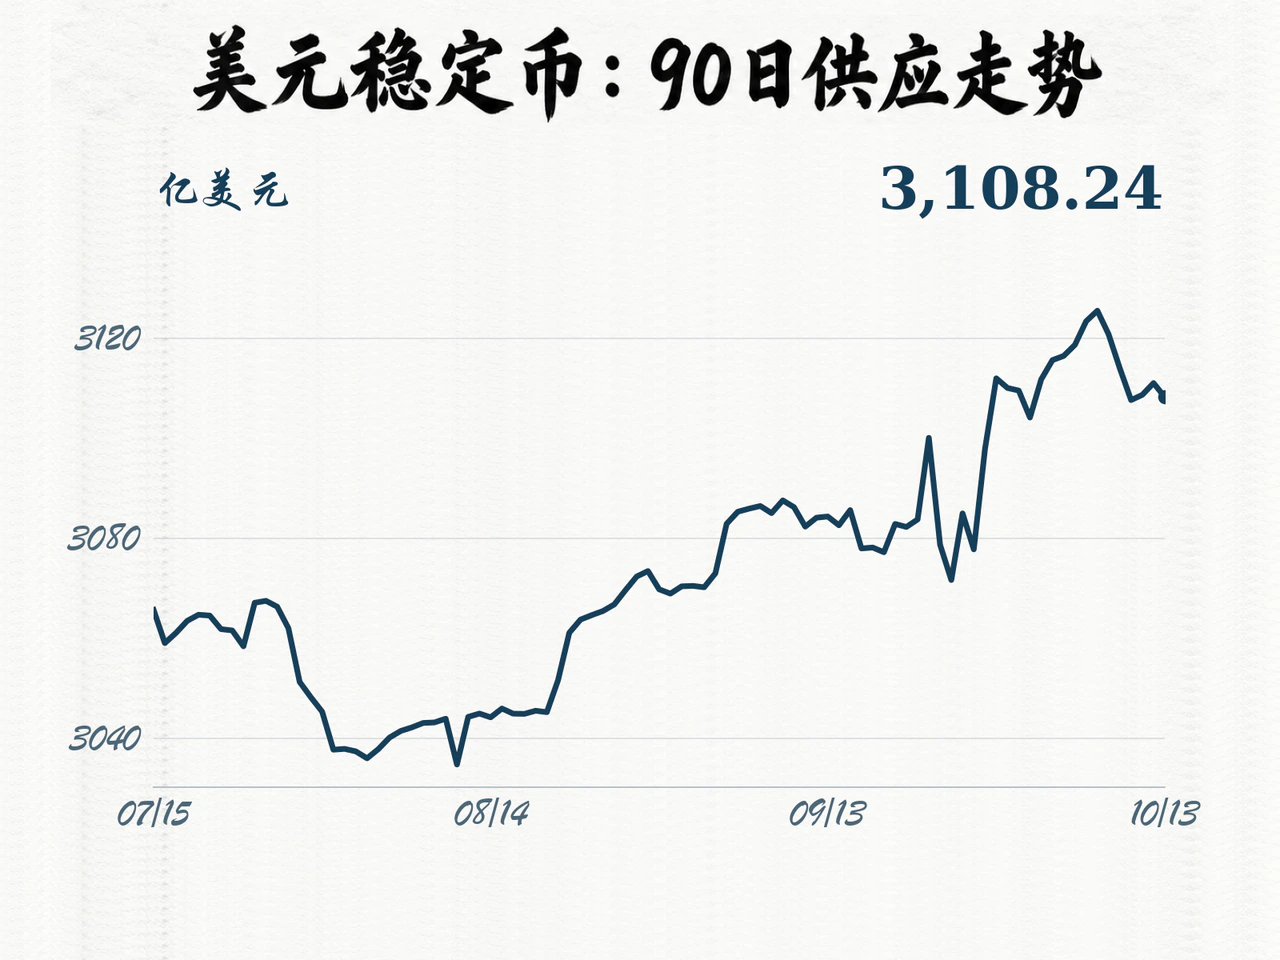
The on-chain dollar pool also showed signs of short-term contraction. DefiLlama data showed dollar-pegged stablecoin circulation of $310.824 billion on October 13. That was $2.388 billion, or about 0.77%, above September 13, but $1.519 billion, or about 0.49%, below October 6. Stablecoins therefore continued to accumulate over the month, while recent expansion had clearly weakened. Weekly stablecoin contraction alongside ETF redemptions indicated a temporary shortage of fresh buying power.
Binance's major contracts shrink in coin terms; options pricing remains defensive
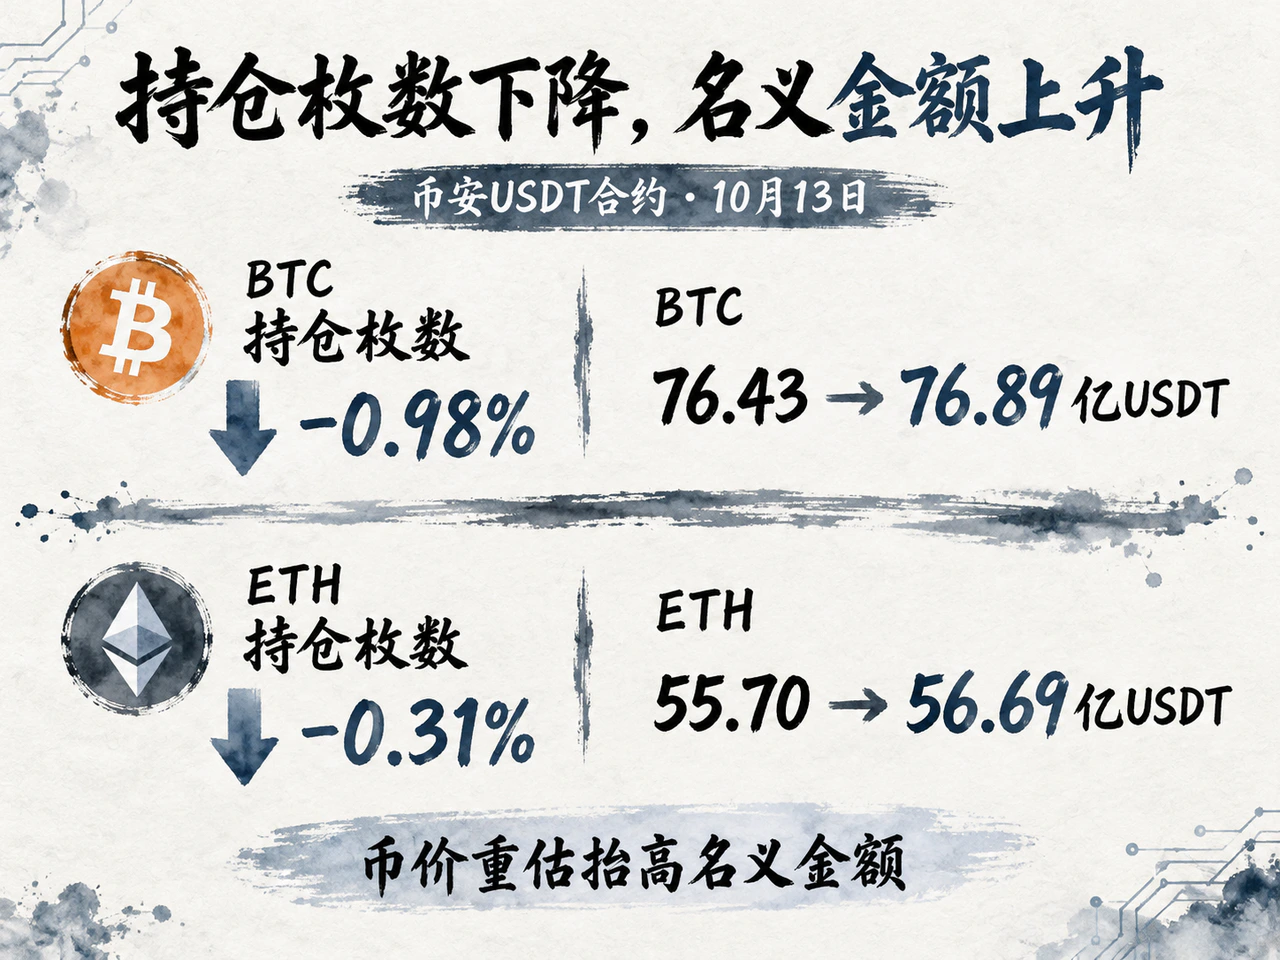
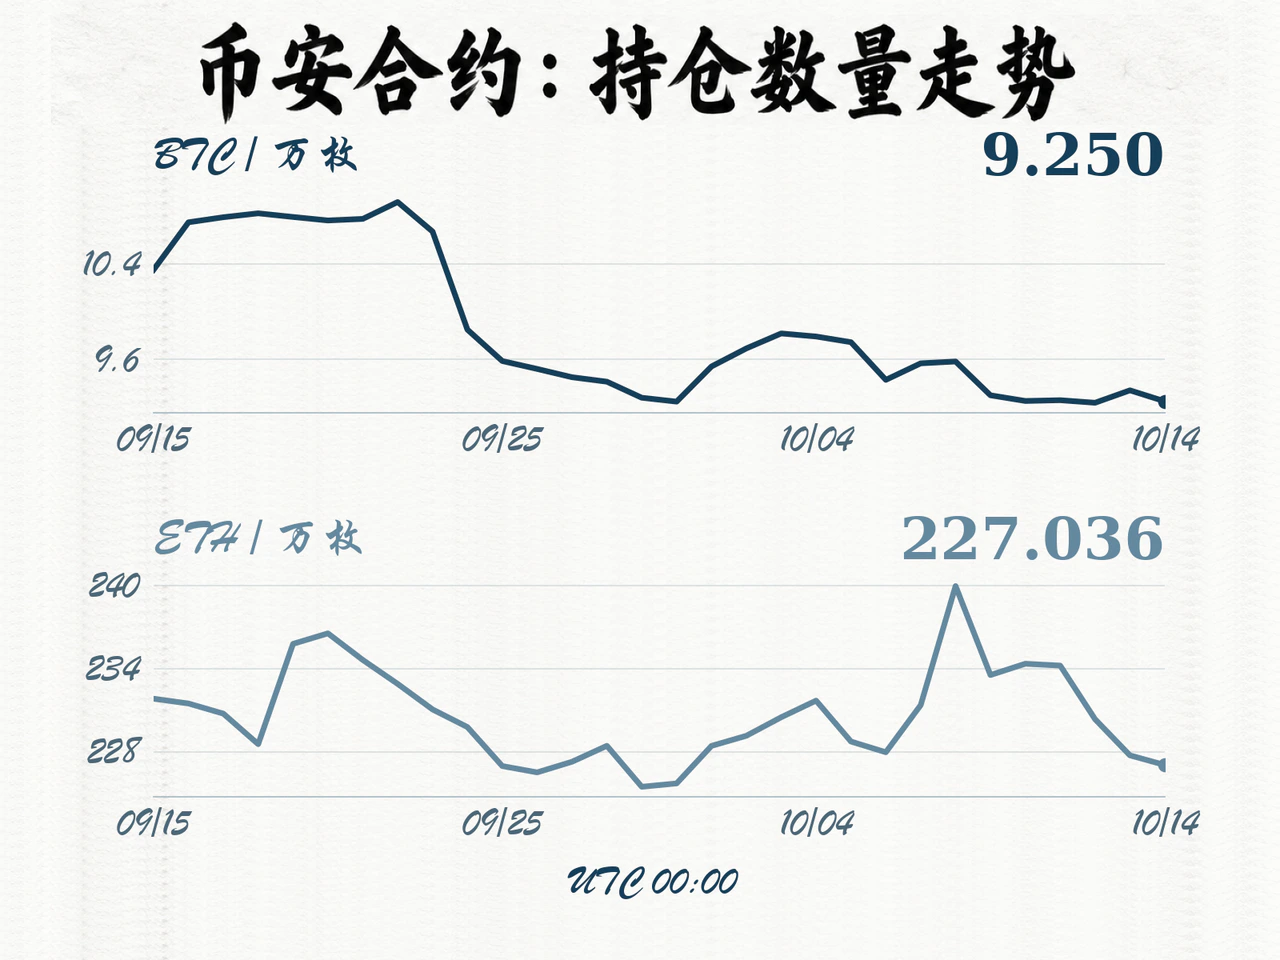
Leveraged investors were also restrained in chasing the rally. During the complete UTC trading day of October 13, open interest in Binance BTCUSDT perpetual contracts fell from 93,420 BTC to 92,500 BTC, a decline of about 0.98%. ETHUSDT open interest edged down from 2,277,300 ETH to 2,270,400 ETH, down about 0.31%.
Over the same period, notional open interest rose passively: BTC increased from 7.643 billion USDT to 7.689 billion USDT, and ETH from 5.570 billion USDT to 5.669 billion USDT. Revaluation from rising coin prices concealed the decline in the actual coin quantity outstanding; underlying positions did not materially expand.
Changes in perpetual funding rates further confirmed cooler enthusiasm for chasing prices. At the October 13 settlements at 00:00, 08:00 and 16:00 UTC, Binance BTC funding rates were 0.006741%, 0.008349% and 0.003455%, respectively; ETH rates were 0.000635%, 0.008377% and 0.003153%. Both peaked at 08:00 before falling sharply at 16:00. Declining coin-denominated open interest alongside softer late-day funding showed little willingness among leveraged longs to keep pushing the market higher.
Options pricing also retained a defensive bias. In its October 12 weekly report, CF Benchmarks said Bitcoin implied volatility had risen only moderately in the previous week, but the volatility surface was clearly skewed toward downside protection. Out-of-the-money puts gained premium relative to at-the-money options, while call premiums fell, reflecting a greater preference for hedging downside risk.
This pricing pattern was closely linked to the previous week's deleveraging. During Bitcoin's sharp decline on the preceding Tuesday, derivatives markets triggered about $400 million in long liquidations within one hour. Forced closures removed some highly leveraged risk but also caused a short-term loss of liquidity. The durability of subsequent gains still depends on whether ETF outflows stabilize, stablecoin supply resumes expanding and genuine spot buying can absorb consolidation pressure.
Click 'Read the original' for the full details.