On October 13, 2026, global markets showed a sharp split in risk appetite. Allocation demand pushed Treasury yields lower across maturities, with long bonds leading a mild curve flattening. Major U.S. equity indices closed only slightly lower, but sector and stock-level adjustments intensified. Cross-asset logic was shifting: high coupons attracted defensive and allocation capital into sovereign debt and enthusiastic demand for leading companies' high-quality long-term credit, while equity investors scrutinized earnings delivery, AI-investment conversion and firms' ability to absorb costs more strictly.
Long Treasuries lead a flatter curve as billions flow into high-coupon assets
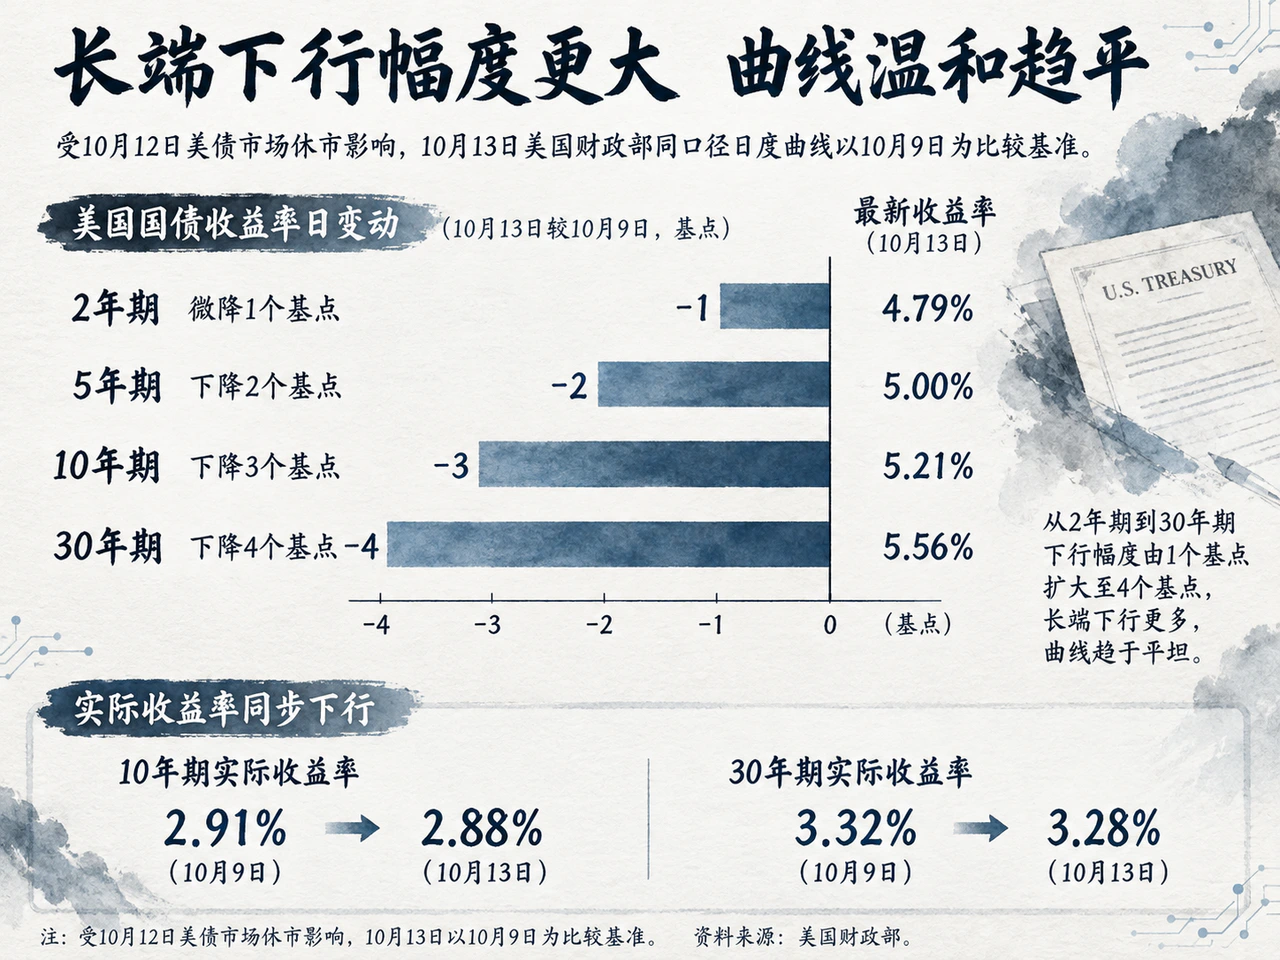
Because Treasuries were closed October 12, the U.S. Treasury's October 13 daily curve compared with October 9. The 2-year yield edged down 1 basis point to 4.79%; the 5-year fell 2 basis points to 5.00%; the 10-year fell 3 to 5.21%; and the 30-year fell 4 to 5.56%. The 10-year/2-year spread narrowed from 44 to 42 basis points. Longer-duration bonds outperformed in a mild bull flattening.
Real yields entirely drove the long-end decline. The Treasury's 10-year real yield fell from 2.91% to 2.88% and the 30-year from 3.32% to 3.28%, matching nominal moves. Ten-year inflation compensation, calculated as the nominal-minus-real yield difference, stayed around 2.33 percentage points. Its stability helped underpin longer-dated bonds.
Abundant allocation buying provided firm support at high yields. The Financial Times, using EPFR data, estimated nearly $14 billion of U.S. government-bond fund inflows since the start of October, following a record $59.3 billion in the third quarter. At the previous week's $39 billion 10-year auction, primary dealers' allocation fell to its lowest since 2003, reflecting strong direct end-investor demand. Amundi said it was gradually increasing Treasury exposure in dollar portfolios. PIMCO CIO Dan Ivascyn highlighted sovereign bonds' relative value against expensive equities and credit with limited risk premiums.
The 2-year yield's mere 1-basis-point decline nevertheless signaled tight monetary constraints. Dow Jones reported LSEG Asia-session data pricing about a 19% chance of a hike this month and three hikes over the next 12 months. Morgan Stanley Investment Management therefore preferred maturities inside 10 years and remained cautious about 20- and 30-year supply and demand. High coupons strengthen sovereign bonds' core-allocation value, but government issuance, sticky inflation and long-term capital supply still limit sustained buying.
Small-business expansion intentions weaken as cost pressure lifts pricing plans
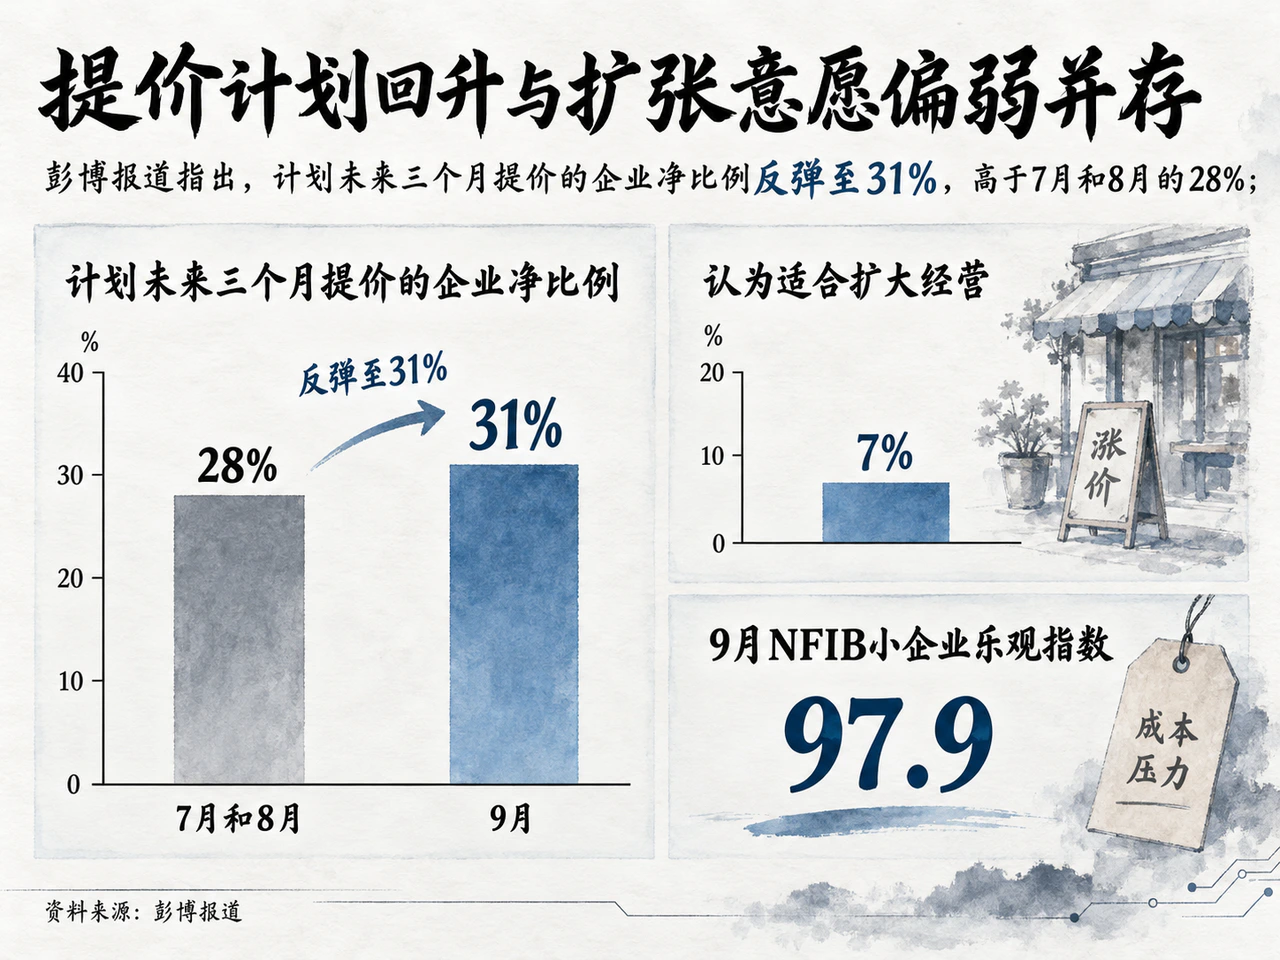
The September NFIB Small Business Optimism Index fell 0.8 point from August to 97.9, below the 98.0 consensus and long-term average. Investment and expansion intentions cooled further. The net share expecting better conditions over the next six months fell 4 percentage points to 6%, while the share considering it a good time to expand fell 5 points to 7%.
Expansion restraint coexisted with strong pressure to raise prices. Bloomberg reported that the net share planning increases over the next three months rebounded to 31%, from 28% in July and August. The share naming inflation the top operating challenge rose 4 percentage points to 20%; that naming labor quality and availability rose 3 points to 26%. Energy, logistics and labor costs were forcing small firms to delay investment while raising prices, preventing slower growth and easing inflation from moving together constructively.
The IMF's latest World Economic Outlook described a similar global picture: growth of 3.1% in 2026 and 3.4% in 2027, headline inflation of 4.7% and 4.1%, and core inflation of 3.9% and 3.7%. AI-chain investment and resilient trade support demand, while energy shocks reduce real household purchasing power; together they support the near-term price level. A lasting balance requires technology investment to produce actual supply gains through total factor productivity.
Different external- and domestic-demand rhythms also appeared in forecasts for China. Yicai's chief-economist survey expected third-quarter GDP growth of 4.4% year on year and full-year growth of 4.6%; September industrial output growth of 5.6%, retail sales growth of 0.7%, and January–September fixed-asset investment down 7.3%. The same forecasts put September dollar exports and imports up 25.6% and 25.1%, and CPI and PPI inflation at 1.0% and 4.5%, above August's reported 0.8% and 3.8%.
These expectations describe relatively strong production and trade, with domestic demand still finding a floor. If industrial-price recovery is driven by upstream costs rather than genuine downstream absorption, final-sector margins remain squeezed. Markets were watching a dense data calendar: China and the U.S. release September inflation on October 14, the U.S. releases PPI October 15, and China releases national economic indicators October 19. Whether industrial costs spread to core prices and production lifts aggregate demand will directly shape financial conditions and earnings.
Oil supply growth and policy disputes pull against each other; high rates and sovereign-debt concerns divide gold
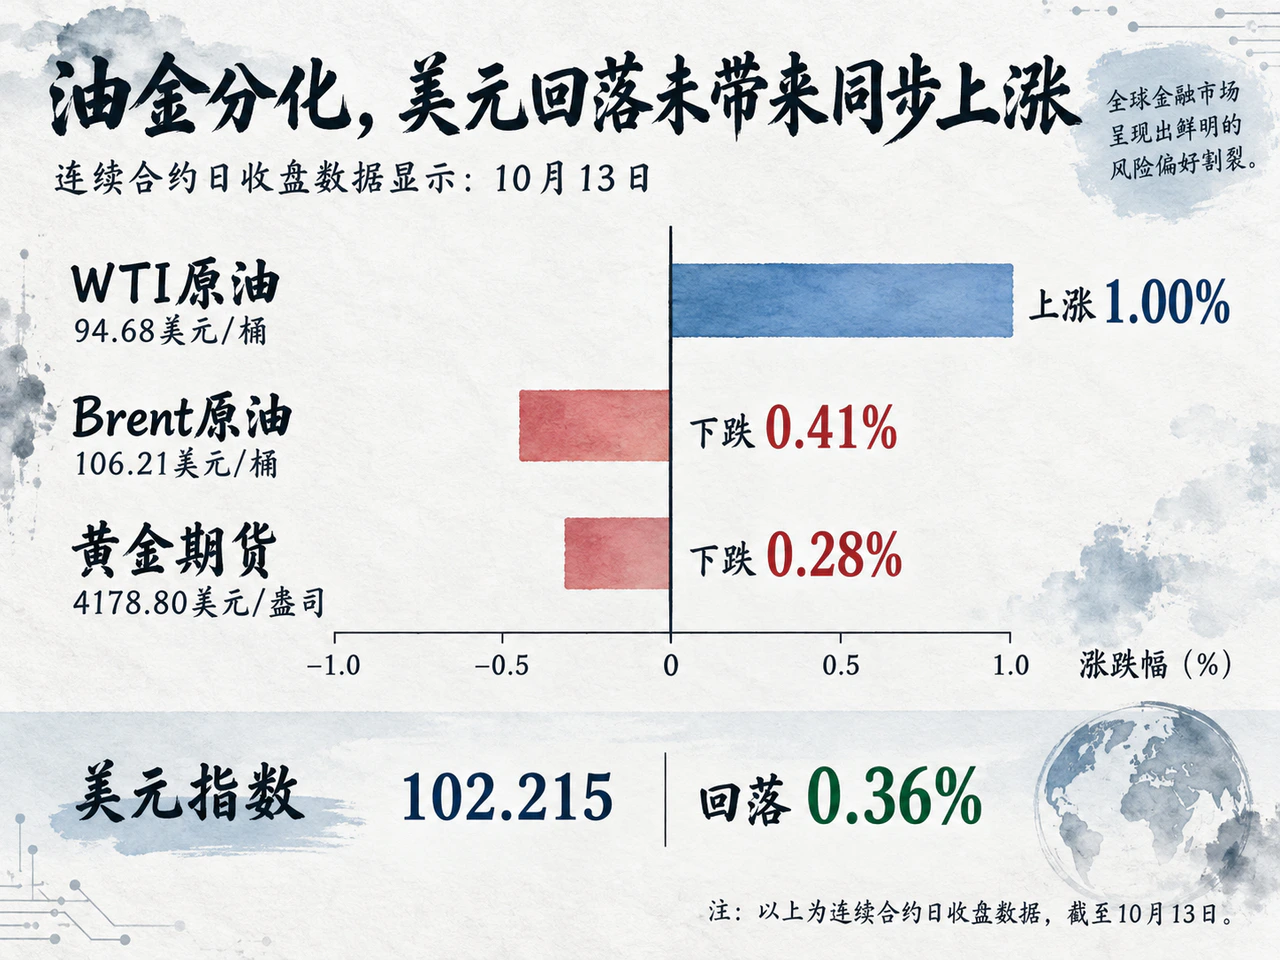
Oil and gold continued pricing their own supply-demand fundamentals and rate environment. Continuous-contract daily closes for October 13 showed WTI up 1.00% to $94.68 a barrel, Brent down 0.41% to $106.21, and COMEX gold down 0.28% to $4,178.80 an ounce. The dollar index fell 0.36% to 102.215.
Oil supply saw a meaningful increase. OPEC's October report put September OPEC+ crude production, from secondary sources, at 39.07 million barrels a day, up about 900,000, mainly from Saudi Arabia. Reuters reported that Aramco rapidly increased Gulf-terminal loadings after attacks on the East-West Pipeline affected Red Sea exports. Demand expectations pulled the other way: OPEC cut its 2026 global demand-growth forecast for a sixth month to just 180,000 barrels a day. Its 2027 forecast of 2.55 million included replenishment of war-depleted inventories after geopolitical conflict subsides. Current weakness and expected future restocking repeatedly pulled on prices.
Refined-product policy added complexity. On October 9 the U.S. Treasury issued General License 135, authorizing sales, delivery and imports of Russian-origin diesel through April 7, 2027. On October 13, 11 bipartisan senators wrote to the White House seeking withdrawal, arguing it did little to lower domestic prices while funding Russia. PVM analyst Tamas Varga said refinery conditions made Russian supply of 3 million–3.5 million tonnes a month before year-end extremely difficult. Logistics were uneven too: Vortexa data showed Iranian seaborne exports still halted as of October 5, while other Gulf producers' September shipments had recovered above 81% of pre-conflict levels. Transport bottlenecks and insurance still constrained conversion of new crude output into supplies at destination ports.
Gold faced a close balance of opposing forces. A weaker dollar briefly lifted spot and December futures intraday, but the continuous contract ultimately closed slightly lower. Elevated nominal and real yields raised the opportunity cost of holding a non-interest-bearing asset. Commerzbank analysts also stressed that persistently high rates increase government interest bills, with debt-sustainability worries supporting gold's safe-haven appeal. Inflation data's implications for the Fed path remain central to subsequent pricing.
A nearly flat S&P masks deeper adjustment as bank and consumer earnings face scrutiny
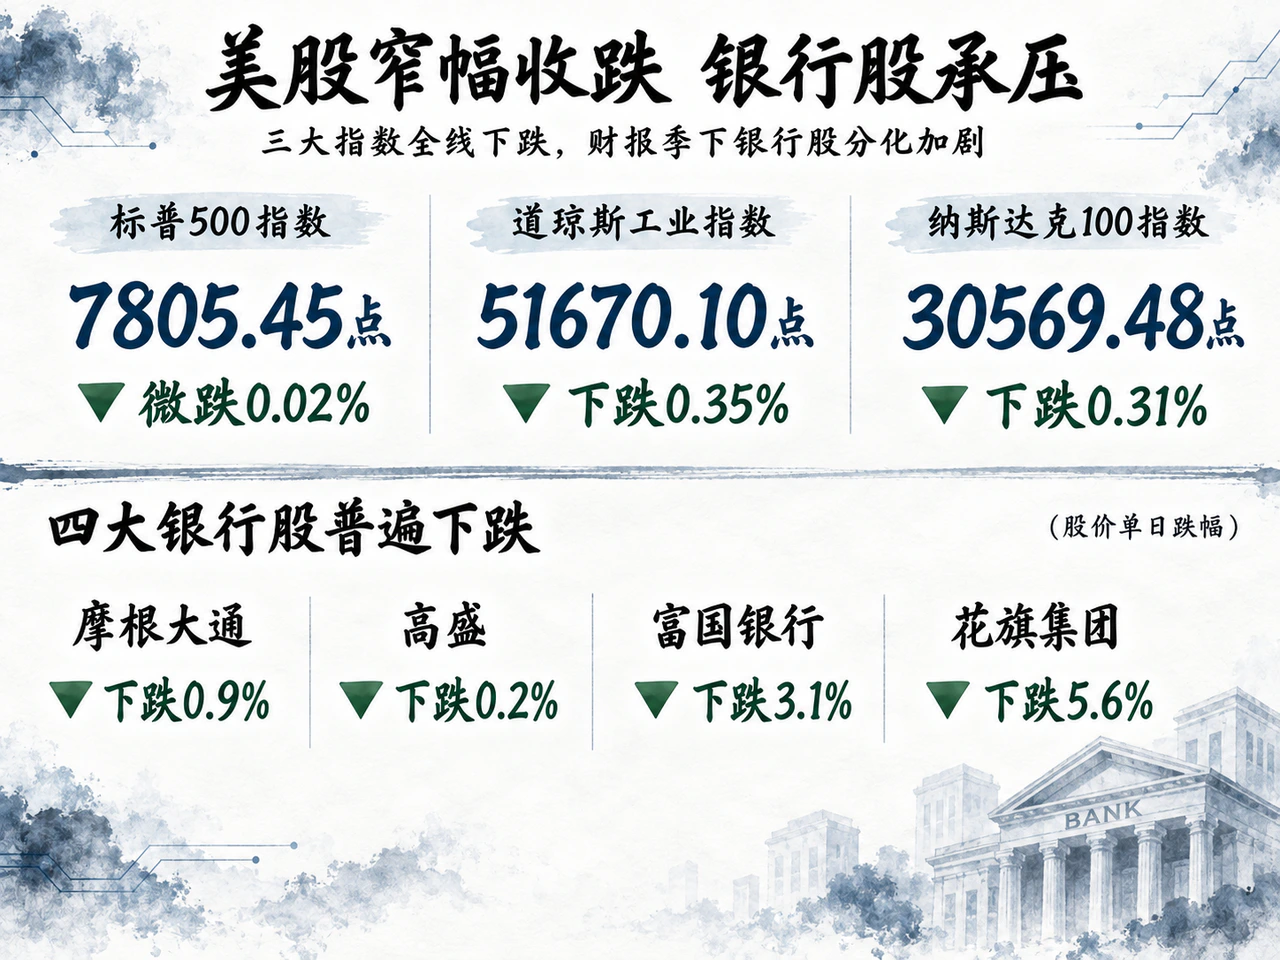
U.S. indices traded narrowly. The S&P 500 slipped 0.02% to 7,805.45; the Dow fell 0.35% to 51,670.10; the Nasdaq 100 fell 0.31% to 30,569.48; the Nasdaq Composite lost 0.15% and the Russell 2000 0.40%. The VIX edged up 0.06 point to 15.27, with apparently steady volatility masking sharp stock-level divergence.
Bank earnings were a major drag on risk appetite. JPMorgan raised its 2026 net interest income guidance from $105.5 billion to $106.2 billion, but quarterly net income missed expectations and shares fell 0.9%. Goldman Sachs's $18.68 billion third-quarter revenue beat LSEG's $16.71 billion forecast; shares rose more than 4% premarket but profit-taking reversed them to a 0.2% closing loss. Wells Fargo fell 3.1% after net interest income missed, while Citigroup fell 5.6% despite beating profit expectations. Financial ETF XLF declined 0.42%.
Earnings pressure spread to healthcare and consumption. Johnson & Johnson beat profit expectations but fell 5.7%, dragging S&P healthcare down 1.3%. Domino's Pizza dropped 4.8% after lowering its full-year sales outlook. Third-quarter U.S. comparable sales grew only 0.3%, versus 5.2% a year earlier; international comparable sales excluding currency effects rose just 0.2%, versus 1.7%. Investors demanded more than current results beating buy-side expectations, scrutinizing whether final sales and net interest income could sustain valuation expansion.
Large technology and energy stocks supported the broader market. Apple edged up 0.1% to $341.27 after touching a record $348.15; Broadcom gained 0.7%. Energy ETF XLE rose 1.80% with oil, while technology ETF XLK slipped only 0.04%. S&P 500 advancers outnumbered decliners 1.1 to 1, but across the Nasdaq only 47 stocks made new highs against 408 new lows, underscoring the gap between index stability and deep pressure within the market.
Memory technology competition resets earnings expectations and pressures Asia's semiconductor chain
The semiconductor correction continued. The Philadelphia Semiconductor Index fell 0.23% on October 13, its fifth consecutive decline and a cumulative loss exceeding 8%. Micron fell 3.6% and Applied Materials nearly 7%. Scarce advanced chips and exceptionally high margins had driven the sector's more-than-70% year-to-date surge, but new competition challenged that premise. Aju Press reported that CXMT planned to launch server DRAM using a new memory-cell structure by year-end, emphasizing density and low manufacturing cost.
Wealth Club strategist Susannah Streeter said Samsung Electronics and SK Hynix were also increasing investment in that technological approach. Broadcom CEO Hock Tan's earlier warning of excessive AI investment expectations continued reverberating, prompting a serious reassessment of the conversion cycle for semiconductor capex. Accumulated valuation premiums amplified sensitivity to competition and lower returns.
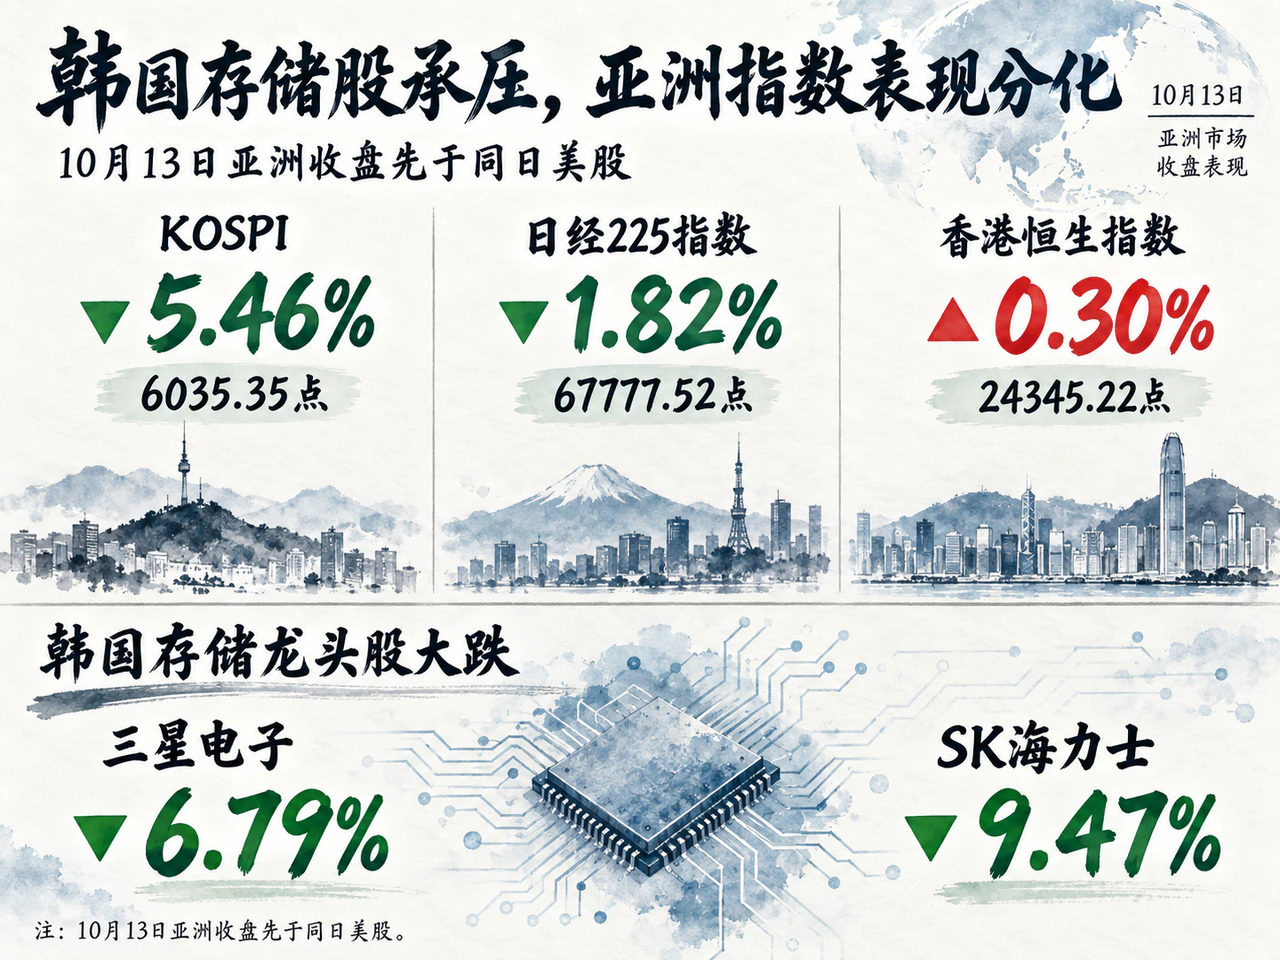
The October 13 Asian session, which closed before U.S. equities, likewise reflected changing competition and return expectations, with heavy technology adjustments. South Korea's KOSPI plunged 5.46% to 6,035.35, the Nikkei 225 fell 1.82% to 67,777.52, and Hong Kong's Hang Seng edged up 0.30% to 24,345.22. Samsung fell 6.79% and SK Hynix 9.47%. Foreigners net sold KRW 4.53 trillion of Korean stocks, including KRW 4.26 trillion in electrical and electronics shares. Japan's Kioxia, SoftBank Group and Tokyo Electron also came under pressure. LG Energy Solution's 2.64% rise on preliminary earnings driven by storage-battery demand could not offset the broader valuation strain.
Tencent's multibillion-dollar order book shows strong credit demand; long technology debt tests absorption
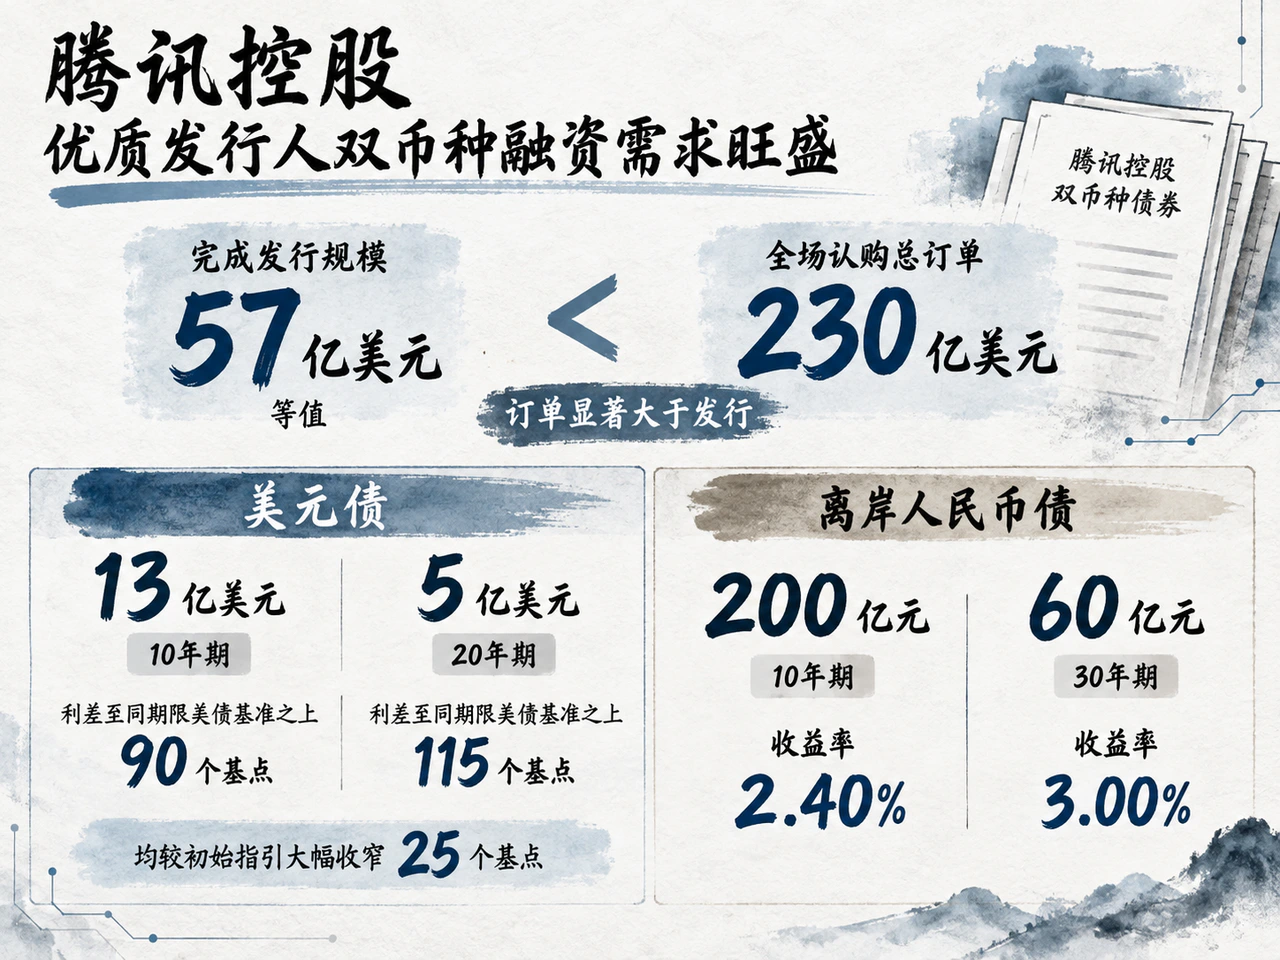
Against equity valuation pressure, primary credit markets showed strong demand for quality blue chips amid a scarcity of suitable assets. Reuters reported October 13 that Tencent priced a dual-currency bond offering equivalent to about $5.7 billion, drawing over $23 billion of orders.
The issue clearly locked in duration. Dollar debt comprised $1.3 billion of 10-year and $500 million of 20-year bonds, with spreads of 90 and 115 basis points over equivalent Treasuries, both 25 basis points tighter than initial guidance. Offshore renminbi debt comprised RMB 20 billion of 10-year notes yielding 2.40% and RMB 6 billion of 30-year notes yielding 3.00%. Tencent's first-half capex had surged from RMB 45.9 billion a year earlier to RMB 96.3 billion, mainly for computing, cloud infrastructure and data centers. Strong credit and flexible maturities still give quality technology firms access to very long funding, although benchmark rates keep absolute costs high.
Across credit, risk premiums increasingly demanded reliable repayment capacity. The ICE BofA U.S. High Yield OAS was 311 basis points on October 12, unchanged from October 9; the investment-grade spread was 82 basis points as of October 8. With sovereign debt offering high risk-free yields, low investment-grade spreads leave little room for disappointment in corporate free cash flow.
The IMF's Global Financial Stability Report that day warned that reinflation or fiscal imbalance driving a sharp sovereign-yield jump would materially tighten global financial conditions. If AI adoption and actual earnings fail to match financing, crowded positions and leverage could magnify price declines. CNBC cited figures showing hyperscalers' share of global investment-grade issuance rising from below 1% in 2024 to 10%. PIMCO's Marc Seidner said the huge flow of very long technology bonds now competed directly with sovereign debt for liquidity. Markets demand actual cash and profits, alongside AI's demand promise, to support accumulating debt and valuations.


