In September, average hourly earnings for US private nonfarm employees rose only 0.1% month on month, while consumer prices increased 0.6%. After adjusting for prices, real average hourly earnings fell 0.5%. More expensive gasoline was not only raising fuel bills but directly eroding the purchasing power of wages. For the Federal Reserve, the same price shock was creating pressure in two directions: persistent inflation was becoming harder to reduce, while households' capacity to bear further monetary tightening was narrowing.
The September US Consumer Price Index, released on October 14, showed headline annual inflation rising to 3.7% and core annual inflation to 2.6%. Markets had already substantially priced in the energy boost to the headline index. What changed near-term policy expectations was the 0.3% monthly rise in core CPI, excluding food and energy, above the 0.2% expected in market surveys.
The more important change lay within the inflation mix. Although shelter prices rose more slowly on average in the third quarter than in the second, core-goods prices turned from falling to rising, and non-energy services maintained strong increases. Shelter's own monthly rise also accelerated again in September. The disinflation cushion previously provided by cooling shelter costs was being offset by increases elsewhere. The combination of energy shocks and core pressure strengthened the case for further Fed rate increases. Slower employment growth, pressure on real income and resilient consumption nevertheless continued to constrain their pace.
1. Gasoline Contributes More Than Half the Headline Increase, While Monthly Core CPI Beats Expectations at 0.3%
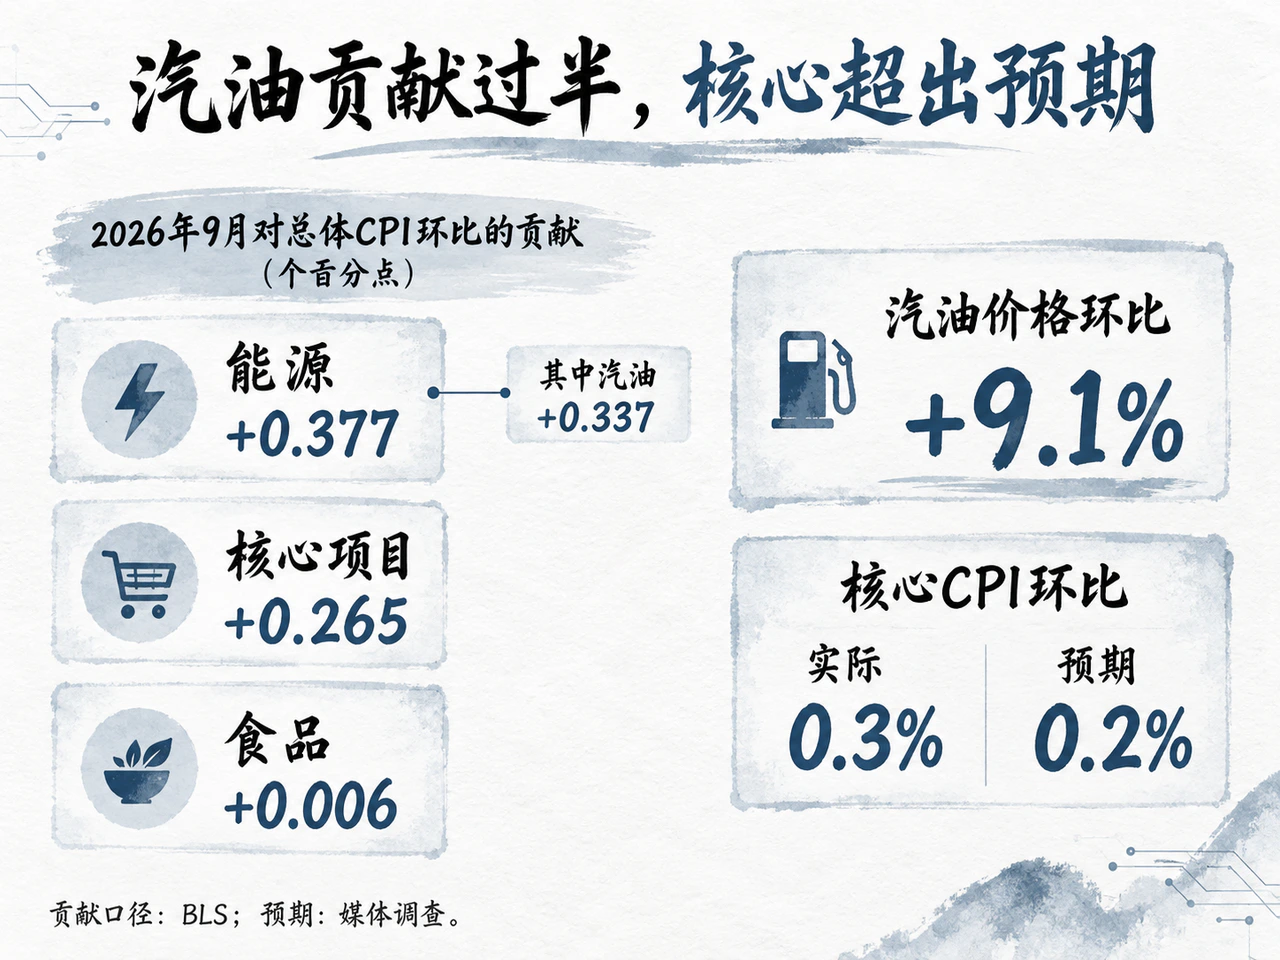
September headline CPI rose a seasonally adjusted 0.6% month on month, above August's 0.4% and in line with expectations. Unadjusted annual inflation rose from 3.4% to 3.7%, above the expected 3.6%. Seasonally adjusted core CPI rose 0.3% for a second consecutive month, while unadjusted annual core inflation increased from 2.4% to 2.6%. Both core readings exceeded expectations by 0.1 percentage point.
| Indicator | August reported reading | September reported reading | September survey expectation |
|---|---|---|---|
| Headline CPI, month on month | 0.4% | 0.6% | 0.6% |
| Headline CPI, year on year | 3.4% | 3.7% | 3.6% |
| Core CPI, month on month | 0.3% | 0.3% | 0.2% |
| Core CPI, year on year | 2.4% | 2.6% | 2.5% |
Note: Monthly changes are seasonally adjusted; annual changes are unadjusted. Expectations are survey results reported separately by Dow Jones and Reuters.
The Bureau of Labor Statistics' contribution breakdown shows energy, food and core components adding 0.377, 0.006 and 0.265 percentage points, respectively, to September's monthly headline CPI increase. Energy was the largest driver: seasonally adjusted energy prices rose 5.2%, gasoline surged 9.1%, and gasoline alone contributed 0.337 percentage point. Measured against the headline monthly change recalculated from the published indices, energy accounted for approximately 60% of the increase and gasoline for more than half. Food prices were broadly stable, unchanged month on month: food at home fell 0.1%, while unadjusted food-away-from-home prices rose 0.2%. Core components still contributed roughly 40% of the headline increase, showing price pressure extending beyond gas stations.
Before the release, markets generally expected monthly core CPI to slow from August's 0.3% to 0.2%. Some institutions also anticipated a reversal in wireless telephone services after their unusual 5.9% August jump. September's unadjusted wireless-service prices were actually unchanged, leaving the prior rise intact. Used vehicles, shelter, education, recreation and medical services also continued rising, jointly supporting core inflation.
The underlying indices, retaining more decimal places, reveal marginal acceleration behind the two consecutive rounded readings of 0.3%. The precise seasonally adjusted core CPI increase was approximately 0.290% in August and 0.335% in September. Rounding had the opposite effect on annual readings: although reported unadjusted core inflation jumped from 2.4% to 2.6%, the index-based increase was about 0.12 percentage point. After allowing for rounding, new core price pressure did strengthen in September; its persistence must be assessed through multimonth trends and the internal breakdown.
2. Third-Quarter Core CPI Accelerates to a 3.41% Annualized Rate as Goods Rebound and Shelter Erodes the Disinflation Cushion
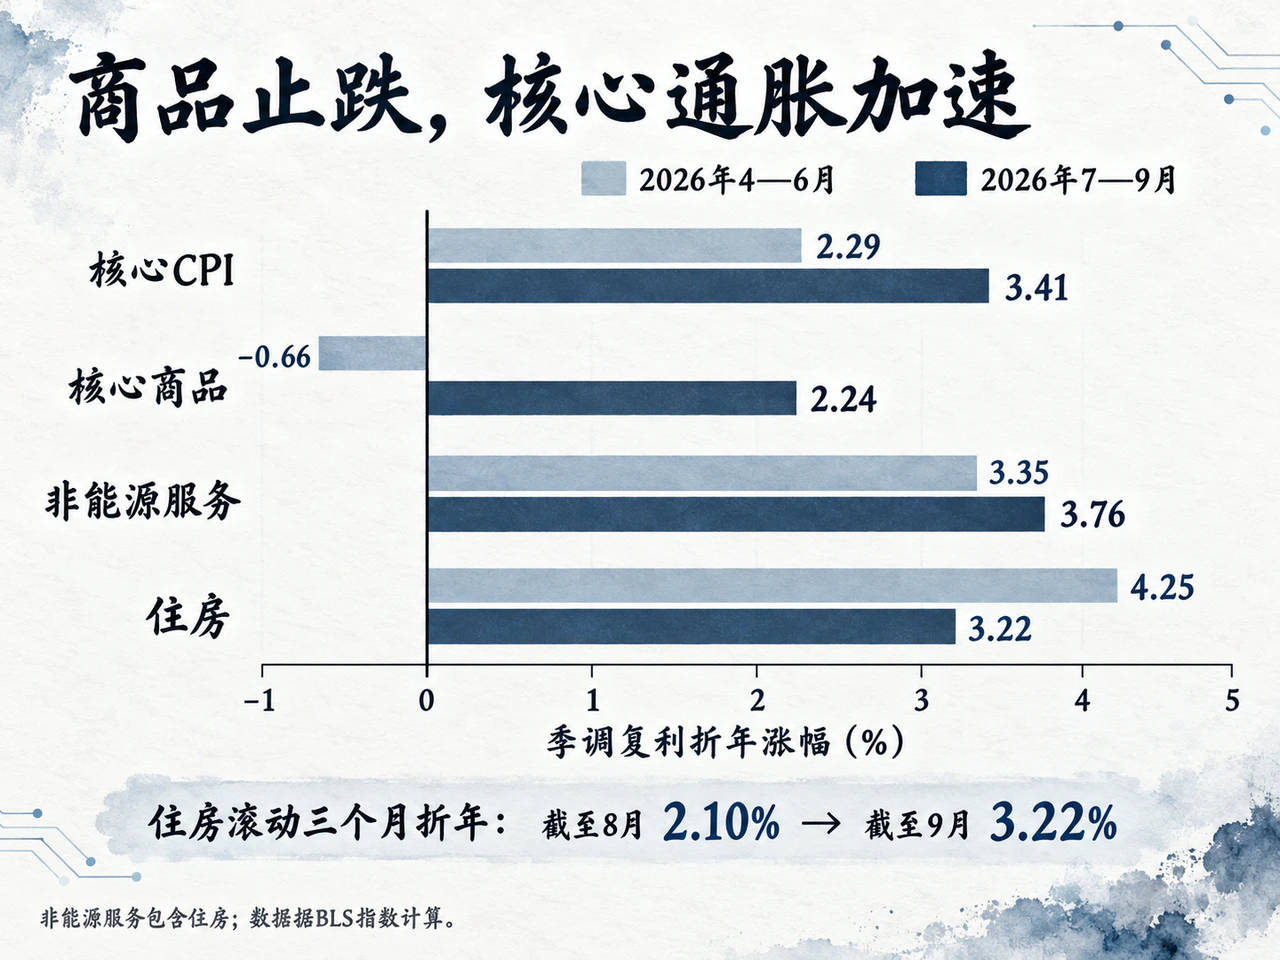
Converting cumulative seasonally adjusted index changes into compounded annualized rates makes monthly momentum easier to compare across windows. Core CPI rose at a 3.41% annualized pace in July–September, substantially above April–June's 2.29% and the six-month April–September rate of 2.85%. This indicates a clear acceleration in core inflation since the summer.
| Seasonally adjusted measure | April–June annualized increase | July–September annualized increase |
|---|---|---|
| Core CPI | 2.29% | 3.41% |
| Core goods | -0.66% | 2.24% |
| Non-energy services | 3.35% | 3.76% |
| Shelter | 4.25% | 3.22% |
| Rent of primary residence | 4.31% | 2.74% |
| Owners' equivalent rent | 4.36% | 3.23% |
Note: Each row shows the compounded annualized change in the relevant seasonally adjusted index. Non-energy services include shelter; rent of primary residence and owners' equivalent rent are shelter subcomponents.
The structural change between quarters was that goods stopped declining and ceased offsetting services inflation, while non-energy services accelerated further. Annualized core-goods inflation moved from -0.66% in the second quarter to +2.24% in July–September, while non-energy services increased from 3.35% to 3.76%. Overall shelter inflation slowed from spring's 4.25% annualized pace to 3.22%, but price increases outside shelter outweighed that disinflationary cushion.
Within shelter, a falling quarterly average coincided with rebounding momentum at quarter-end. Annualized primary-residence rent inflation slowed from 4.31% in the second quarter to 2.74% in July–September, and owners' equivalent rent from 4.36% to 3.23%. Yet September's monthly shelter increase rose from August's 0.3% to 0.4%, lifting its rolling three-month annualized rate from 2.10% through August to 3.22% through September.
Shelter contributed 0.138 percentage point to September headline CPI. Lodging away from home rose 2.0% month on month, slower than August's 2.4%, and contributed 0.028 percentage point, or approximately one-fifth of shelter's contribution. Primary-residence rent rose 0.2% and contributed 0.019 percentage point. The largest component, owners' equivalent rent—the value of owner-occupied housing services inferred from rental prices, excluding direct changes in home prices and mortgage rates—accelerated from 0.2% to 0.3% and contributed 0.091 percentage point. September's shelter increase therefore reflected both volatile lodging prices and a marginal rebound in core long-term rental costs.
CPI rents respond to newly signed market rents with a substantial lag. Existing leases do not immediately reprice when new rents fall, and some renewals still catch up with earlier peaks. The BLS also collects prices for the same housing sample once every six months, smoothing short-term fluctuations further. High-frequency rental measures have begun showing less slack: Apartment List estimated September national transaction rents down 0.4% year on year, much less than April's 1.6% decline. Vacancy in stabilized multifamily properties on its platform fell from 7.3% in February to 7.0% in September. Repricing of existing leases still supports further cooling in CPI shelter, but marginal tightening in the rental market could limit the eventual decline.
The goods rebound also differed by category and stage of the supply chain. Used-car retail prices rose 0.7% in September, after 0.4% in each of the preceding two months; new vehicles rose 0.2% and apparel 0.3%, while unadjusted medical-goods prices fell 0.7%. Wholesale data did not confirm the retail used-car strength: Cox Automotive's adjusted Manheim used-vehicle wholesale index fell 1.1% in September. Wholesale-to-retail lags, differences in transaction samples and pricing dates mean September's retail increase cannot yet be extrapolated into sustained acceleration in vehicle prices.
Tariffs' contribution to goods inflation is evolving over time. New York Fed research published October 6 found relatively fast direct transmission into imported consumer-goods retail prices, but slower indirect transmission into US-made goods through materials and components, still unfolding over six to twelve months. Based on the actual tariff path, price increases caused by 2025 tariffs are gradually entering annual comparison bases, while some tariffs were reduced in early 2026. Earlier tariffs still elevate absolute price levels, but their contribution to current annual goods inflation has weakened markedly. The main remaining incremental effects are delayed pass-through of earlier costs and new tariffs imposed on Canadian goods in August. Assessing whether September's core-goods increases can persist therefore requires examining incomplete tariff transmission, inventory adjustment and end demand together.
Beyond directly lifting headline CPI, energy inflation affects subsequent core inflation through business inputs and household purchasing power. Core CPI excludes gasoline consumed directly by households but includes transport services that use fuel intensively. Airfares rose 1.2% month on month in September and transportation services 0.6%, showing continued increases in energy-sensitive service prices.
Companies' ability to keep passing costs to consumers remains constrained by divergent purchasing-power and expectations trends. The New York Fed's September consumer survey showed one-year inflation expectations rising to 3.9%, three-year expectations to 3.3%, and five-year expectations holding at 3.0%, while expected earnings growth fell to 2.6%. Higher near-term inflation expectations, weaker expected income growth and falling real hourly pay highlight the energy shock's dual character: it raises business costs and crowds out household demand. Core inflation's path will depend substantially on the balance between pass-through and demand contraction.
3. October Rate-Hike Odds Rise Above 40%, but Core PCE and Diverging Labor Data Constrain the Pace
On September 16, the Fed raised its federal funds target range by 25 basis points to 3.75%–4.00%. Minutes showed most participants thought another increase before year-end might be appropriate. Stronger-than-expected September core CPI reinforced the case for further tightening this year and brought the possibility of consecutive rate increases in October into focus.
The 2.6% annual core CPI reading cannot, however, directly measure the distance from the Fed's 2% inflation target. The formal target is anchored to headline Personal Consumption Expenditures (PCE) inflation, with core PCE used to assess underlying trends. PCE includes spending such as medical care paid by employers and governments on households' behalf, and differs from CPI in shelter weights and index construction. A substantial gap currently exists: August annual core CPI was 2.4%, while core PCE was 3.0%.
The annual revisions released September 30 also matter for the PCE baseline. Revised August headline PCE rose 0.3% month on month and 3.4% year on year; core PCE rose 0.2% and 3.0%, respectively. July monthly headline and core PCE were both revised down from 0.2% to 0.1%. The official August core reading was below Fed staff's preliminary estimate at the September meeting, lowering the early-third-quarter inflation starting point, but stronger September CPI revived the risk of a PCE rebound.
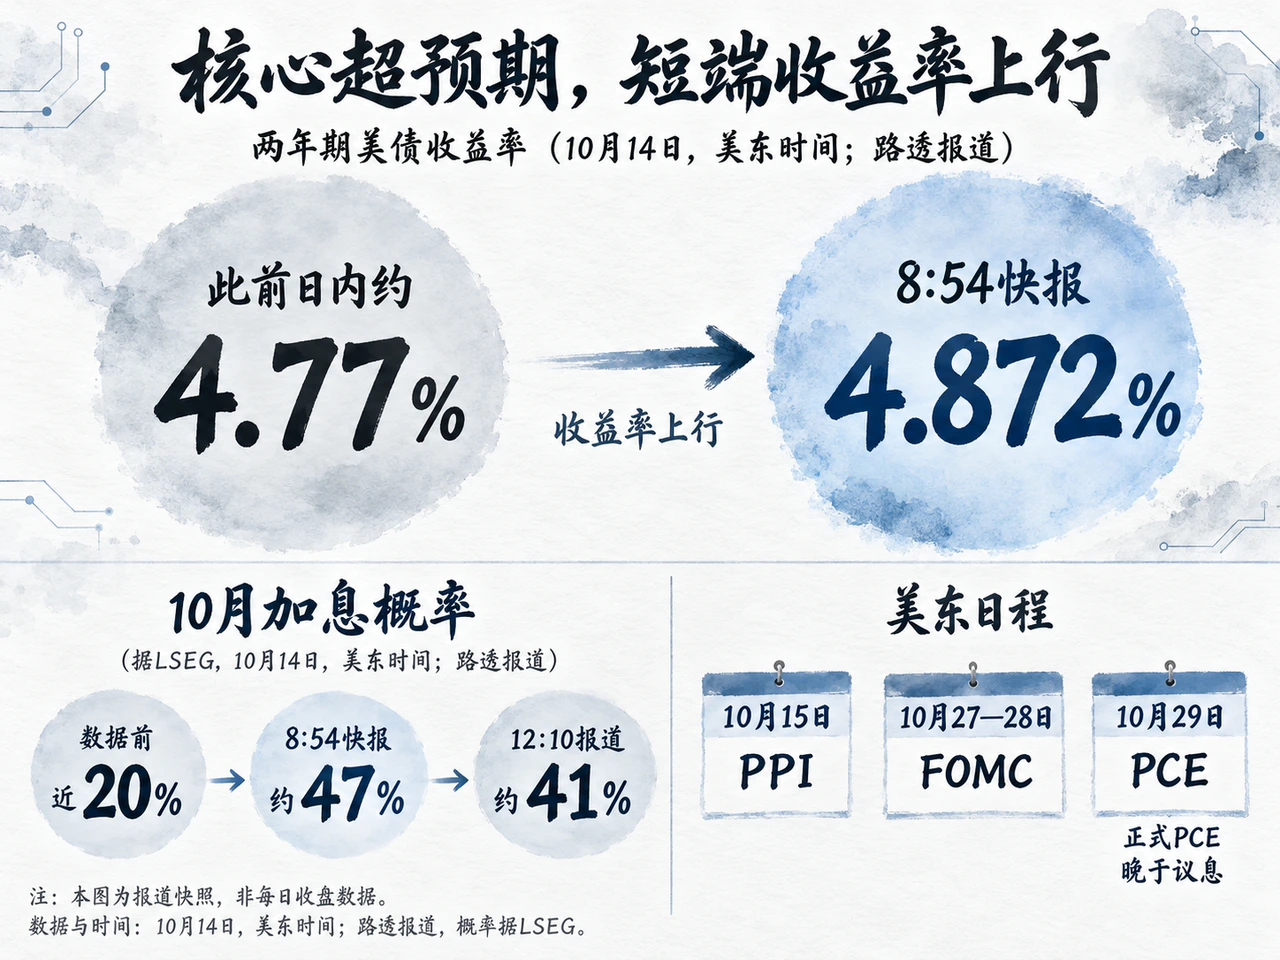
Mapping CPI into PCE also depends on other components and changes in accounting methods. PCE medical, airline and other service prices draw partly on PPI, and the annual update altered measurement of some financial services. Portfolio management and investment-advisory services, for example, no longer directly use the previous PPI component as their price indicator. Following CPI, Capital Economics' Stephen Brown initially estimated September monthly core PCE at approximately 0.32%, above August's 0.2%, and argued that broad core price increases put an October hike back on the table. September PPI, scheduled for October 15 US Eastern time, would provide a key missing piece. Official September PCE would not be released until October 29, after the October 27–28 FOMC meeting, requiring the Fed to decide before that report was available.
Beyond inflation, divergence in employment, income and consumption imposes another constraint on the pace of hikes. September nonfarm payrolls rose 29,000, July–August employment was revised down by a combined 60,000, and revised third-quarter gains averaged about 51,000 per month. Unemployment was 4.2%, still within the narrow 4.1%–4.3% range seen since March. September FOMC minutes noted low hiring and layoff rates simultaneously: labor-market turnover was weakening and expansion slowing, without a clear deterioration in unemployment. Private nonfarm hourly earnings rose 3.0% year on year in September, while real hourly pay fell 0.7%. August real PCE rose 0.6% month on month even as real disposable income was essentially flat. Resilient consumption gave the Fed room to continue fighting inflation, but the gap between labor-income purchasing power and spending also meant sustained tightening was accumulating pressure on future aggregate demand.
Policymakers and institutions weighed both the direction and timing of tightening. Governor Waller said October 8 that he still expected further increases if data evolved as anticipated, while explicitly noting that hikes need not occur at consecutive meetings. Institutional views did not converge after September CPI. Capital Economics was more concerned about broadening core pressure; Natixis leaned toward an October pause to await more data; Franklin Templeton researchers emphasized that higher long-term Treasury yields had already increased corporate and household financing costs, effectively substituting for some policy tightening.
Rates markets quickly raised near-term tightening expectations after the data, but intraday trading remained volatile. Reuters' October 14 flash at 8:54 a.m. US Eastern time showed the 2-year Treasury yield at 4.872%, up from around 4.77% earlier in the session. LSEG money-market pricing put the probability of an October hike near 47%, versus almost 20% before the data. Another report at 12:10 p.m. put it around 41%. Markets thus assigned much more weight to consecutive tightening in October while still leaving more than half the probability on no change that month. The 2-year Treasury yield combines expectations of the short-rate path over two years and term-risk compensation; its spread over the current 3.75%–4.00% policy range cannot simply be interpreted as the size of a single meeting's rate increase.
Across assets, the September CPI surprise first increased the risk of a higher short-term policy-rate peak and rates staying higher for longer. Long Treasuries depend on the contest between persistent inflation and slower growth. Broader core price pressure would weigh on bonds through tightening expectations and higher term premiums. Conversely, if energy and financing costs increasingly erode consumption and employment, weaker future growth would limit long-yield upside. For equities, higher risk-free rates directly reduce valuations, while energy and input costs squeeze downstream margins. Future earnings resilience depends on whether end demand can support continued corporate price increases.
Overall, September CPI weakened the case for waiting for core inflation to fall naturally and increased the marginal risk of further monetary tightening. Three tests will shape the next policy balance: whether core-goods increases persist, whether September's shelter rebound subsides, and whether core PCE strengthens on its revised baseline. Persistent core pressure alongside stable unemployment would reinforce the case for an earlier additional hike. If PPI and PCE instead show renewed cooling in underlying inflation while employment and real income keep weakening, the need to slow the pace would grow. The policy focus has moved beyond gasoline volatility itself to the durability of core inflation outside energy and the economic cost of bringing inflation fully under control.
This article is for research reference only and does not constitute investment advice.


