On October 16, 2026, U.S. financial markets weakened under the combined pressure of financing strains in capital-intensive AI businesses and sticky inflation. Investors sold technology stocks heavily amid concerns over the cost of capital for highly indebted computing providers, while inflation pressure from energy and imported goods limited safe-haven buying to short-dated Treasuries. The Nasdaq 100 fell 2.50% to 29,187.55; the S&P 500 lost 1.09% to 7,659.44; and the Dow Jones Industrial Average declined 0.34% to 52,002.41. The Russell 2000 small-cap index fell 1.66%, while the VIX jumped 3.53 points from the previous day to 19.99. Selling spread from large technology stocks to a broader range of risk assets.
CoreWeave drops nearly 12%; computing-related debt pressure sends technology down more than 3%
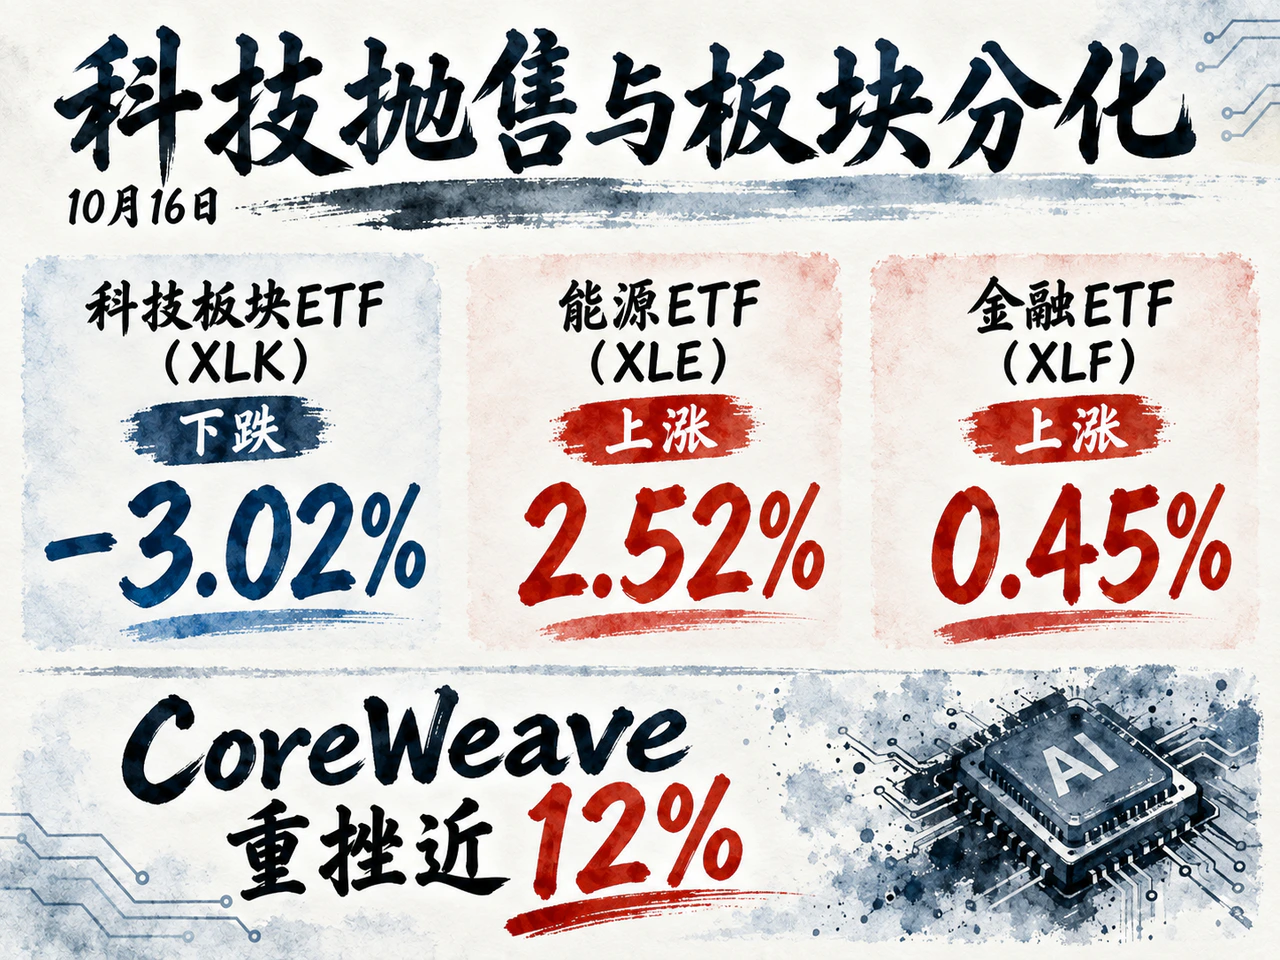
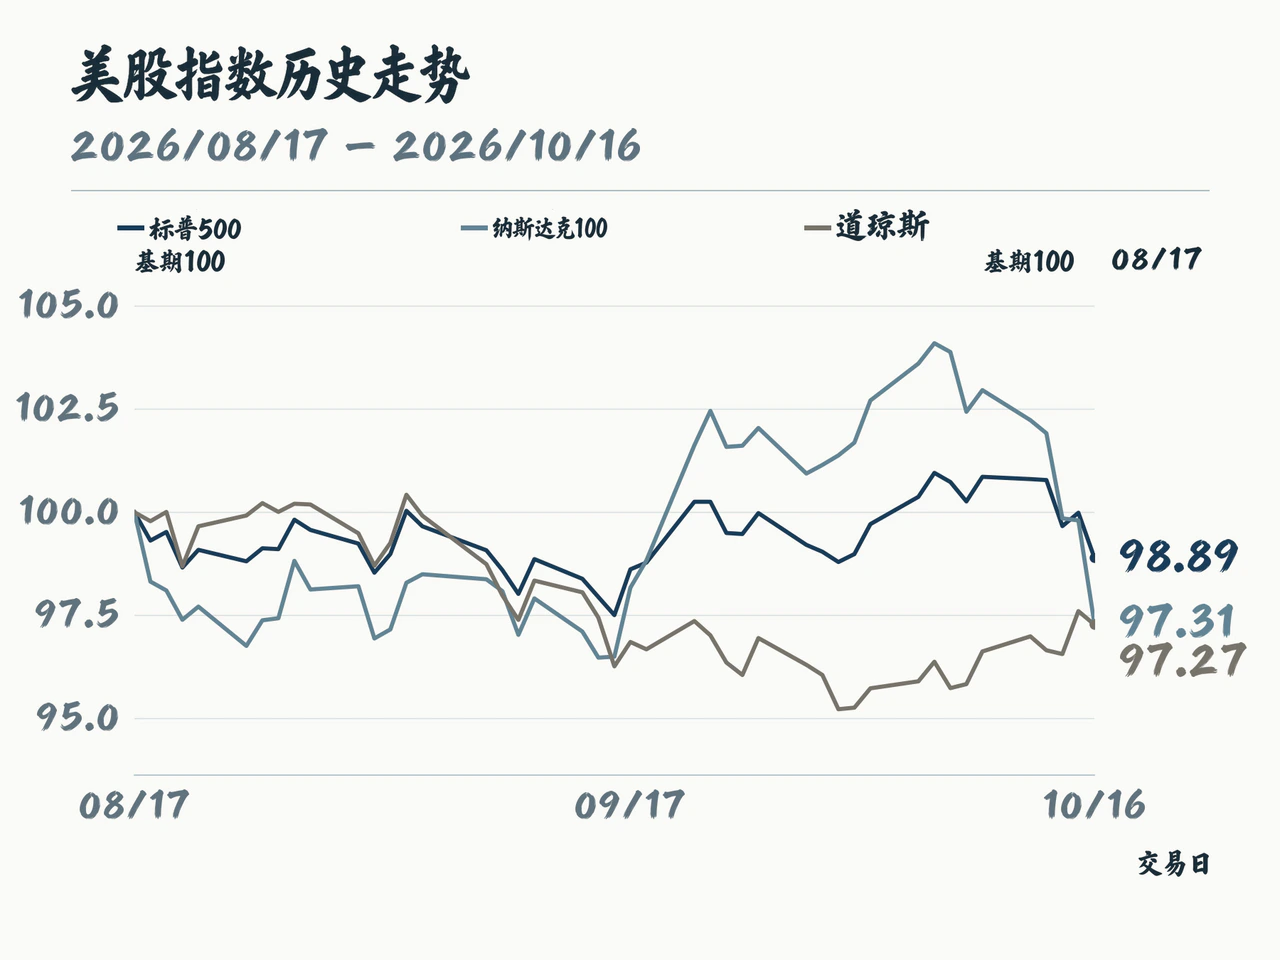
U.S. sector performance diverged sharply as money left highly valued technology companies with long payback periods for sectors generating current cash flows that benefit from higher oil prices. The Technology Select Sector SPDR ETF, XLK, fell 3.02%, while the energy ETF XLE and financial ETF XLF gained 2.52% and 0.45%, respectively. CNBC reported that semiconductor ETF SMH lost about 3%, led lower by Micron, AMD and SanDisk. Gains in energy stocks including Chevron helped limit the Dow's decline.
Cloud-computing provider CoreWeave became the focus of scrutiny over AI financing structures. CNBC reported that its debt exceeded $51 billion after heavy borrowing to buy chips and expand data centers. Its shares plunged nearly 12% on Friday, while its bonds also faced selling as investors demanded greater compensation for risk. Under such a large debt burden, weaker-than-expected equipment utilization or revenue conversion can readily turn back against corporate cash flow.
Computing-related credit concerns quickly spread into software and the broader market during the session. Yahoo Finance recorded that at 11:17 a.m. Eastern time, Salesforce, ServiceNow and Atlassian had reversed early gains to losses exceeding 3%, with 41 of the 45 software stocks it tracked declining. By 2:47 p.m., the S&P 500 had shifted from nearly 80% of constituents rising shortly after the open to about 60% falling. Early sector rotation had become a broad reduction in risk.
End demand for computing itself had not weakened, but pricing attention had shifted to balance-sheet quality. A Bank of America team led by analyst Vivek Arya said on Friday that utilization of deployed AI infrastructure was close to 100% and GPU rental prices had risen 12% to 37% year to date. It also warned, however, that credit risk at lower-rated cloud-computing companies, high interest rates, and power-supply and permitting delays were major downside risks. Investors were beginning to distinguish strong computing demand carefully from aggressive debt expansion.
Expectations of a pause in rate hikes lower the two-year yield; a near-$2 trillion deficit and inflation restrain the long end
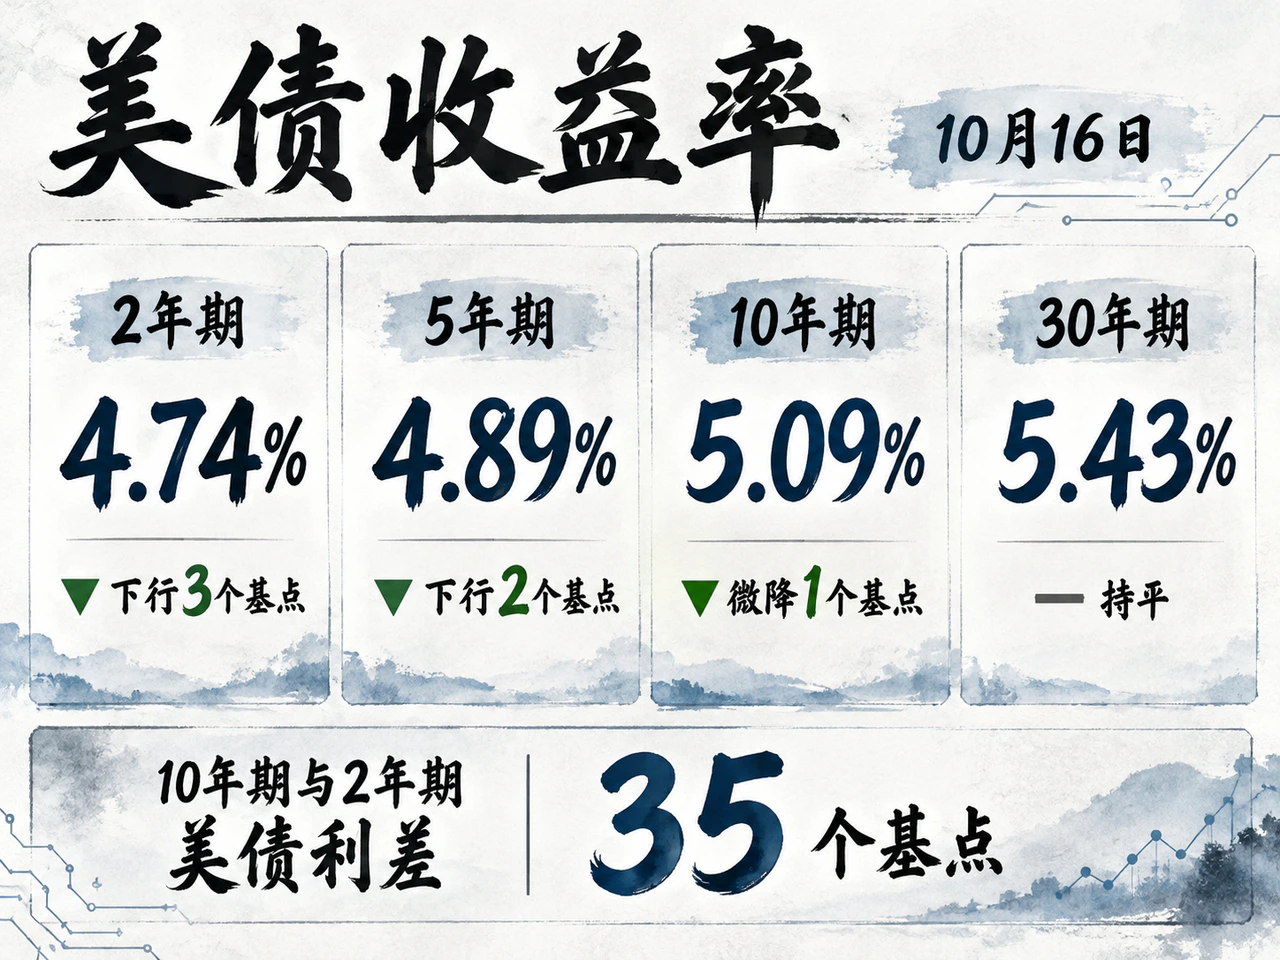
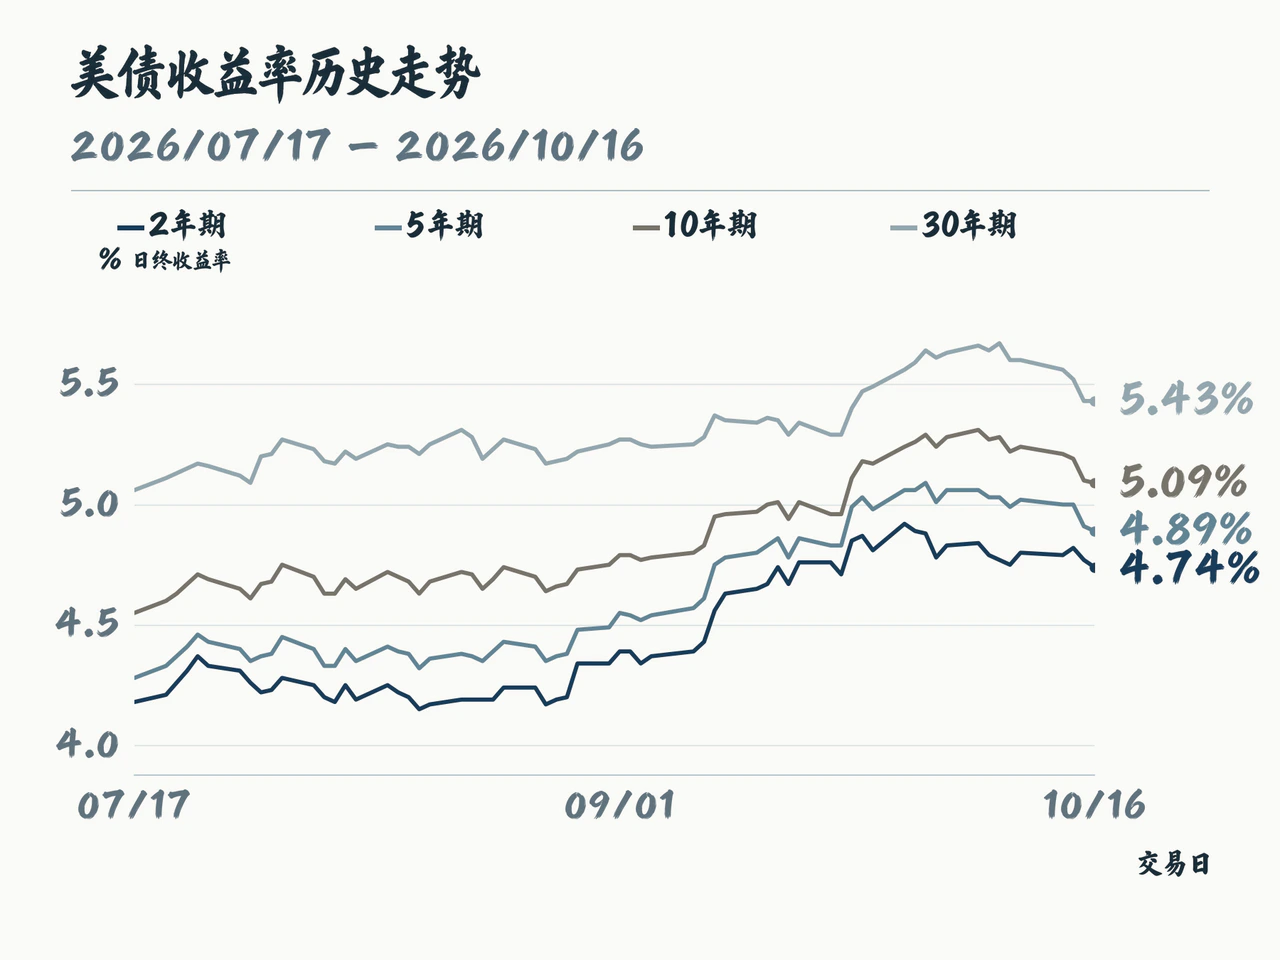
The U.S. Treasury's consistently measured closing yield curve showed bull steepening. On October 16, the policy-sensitive two-year yield fell three basis points from October 15 to 4.74%; the five-year fell two basis points to 4.89%; the ten-year edged down one basis point to 5.09%; and the thirty-year was unchanged at 5.43%. The ten-year/two-year spread widened from 33 basis points to 35.
Short-dated Treasuries were supported mainly by expectations that the Federal Reserve would pause rate hikes. Fed Chair Kevin Warsh said on Thursday that he would not prejudge subsequent meetings. CNBC cited CME interest-rate futures pricing on Friday showing that traders assigned a probability above 80% to unchanged rates this month. But September U.S. PPI inflation was 6.3% year on year, exceeding the 5.5% consensus, while CPI inflation reached 3.7%. Hot inflation limited the scope for long yields to fall, leaving the ten-year above 5%.
Large fiscal financing needs further weighed on long-dated bonds. Reuters, citing Treasury figures, reported a federal budget deficit of about $1.99 trillion in fiscal 2026 through September 30, up $217 billion year on year. Full-year receipts were about $5.40 trillion and spending about $7.40 trillion. Federal debt interest payments reached $1.36 trillion, up 12%, while about $145 billion in annual tariff refunds also reduced the contribution from trade taxes. High deficits and interest costs imply persistent pressure from medium- and long-term Treasury supply.
Credit markets also differentiated by issuer quality. The latest visible data through October 15 showed the ICE BofA U.S. dollar investment-grade corporate option-adjusted spread unchanged at 84 basis points. High-yield OAS narrowed two basis points from the previous day to 323, but was still twelve basis points wider than on October 9. Bloomberg reported on Friday that after some companies postponed issuance because of rate volatility and AI-related risks, Bank of America launched an investment-grade offering of up to four tranches with maturities from three to eleven years. Initial spread guidance on the longest tranche was about 120 basis points over comparable Treasuries, demonstrating that financing windows remained open for highly rated issuers.
Bank earnings exposed the continuing impact of high rates on balance sheets. Truist reported third-quarter adjusted earnings of $1.16 per share, below the $1.19 consensus. Including a $1.4 billion loss from balance-sheet repositioning and discounted bond sales, reported earnings were only $0.56 per share, sending its shares down more than 2% before the open.
U.S. September industrial production rises 0.7% monthly; import-price inflation reaches a four-year-plus high of 8.1%
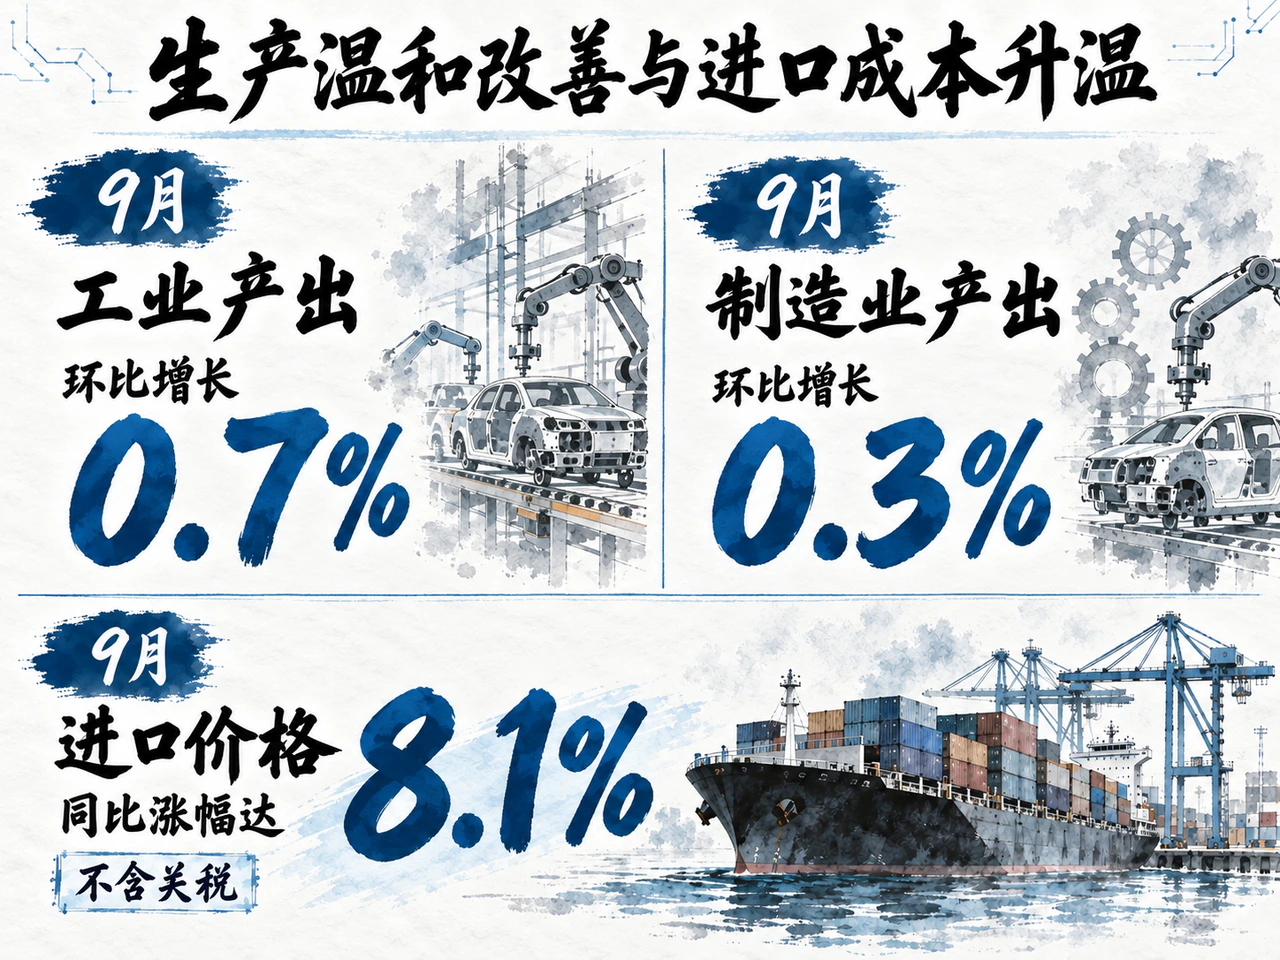
U.S. real-economy data released on Friday showed diverging production trends and rising imported inflation. September industrial production increased 0.7% month on month, above the 0.4% consensus. August growth was revised up from flat to 0.1%. Utilities output rose 3.5%, providing most of the increase. Manufacturing rose 0.3%, in line with expectations, but was uneven: motor vehicles and parts fell 3.0%, while business equipment was flat.
Over the quarter, manufacturing momentum outside technology hardware slowed markedly. Annualized quarter-on-quarter manufacturing-output growth fell from 5.6% in the second quarter to 0.7% in the third. Semiconductors and related electronic components surged 28.4%, while nondurable-goods manufacturing fell 1.6%. Industrial capacity utilization rose to 76.9% in September, but remained 2.5 percentage points below its long-run average, indicating spare capacity in traditional industrial sectors.
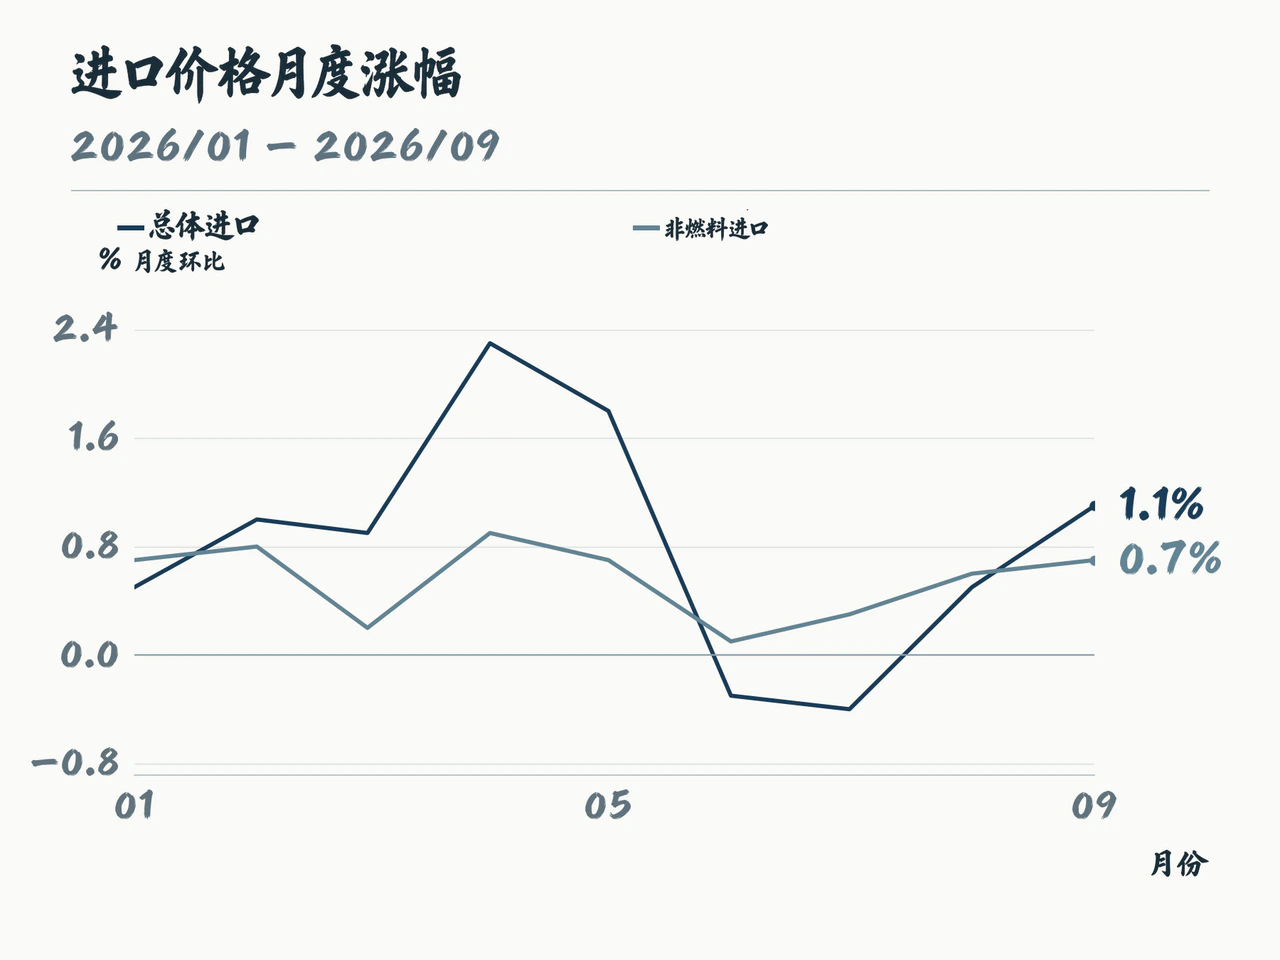
Compared with this partly moderate production picture, price pressure on imports was spreading broadly. September U.S. import prices excluding tariffs rose 1.1% month on month, above expectations of 0.8%, and 8.1% year on year, the fastest since July 2022. Fuel import prices rebounded 4.8% monthly. Nonfuel import prices increased 0.7% monthly and 6.0% annually; using the same data vintage as this release, nonfuel prices rose in every month from January through September. Capital-goods import prices also rose 0.9% month on month for a second consecutive month. Rising costs are spreading from energy to equipment and consumer goods, squeezing margins at companies facing weak downstream demand and strengthening the inflation transmission chain. That makes a substantial long-end Treasury rally difficult on slower-growth expectations alone.
Brent approaches $110; a softer dollar and lower short yields support a gold rebound
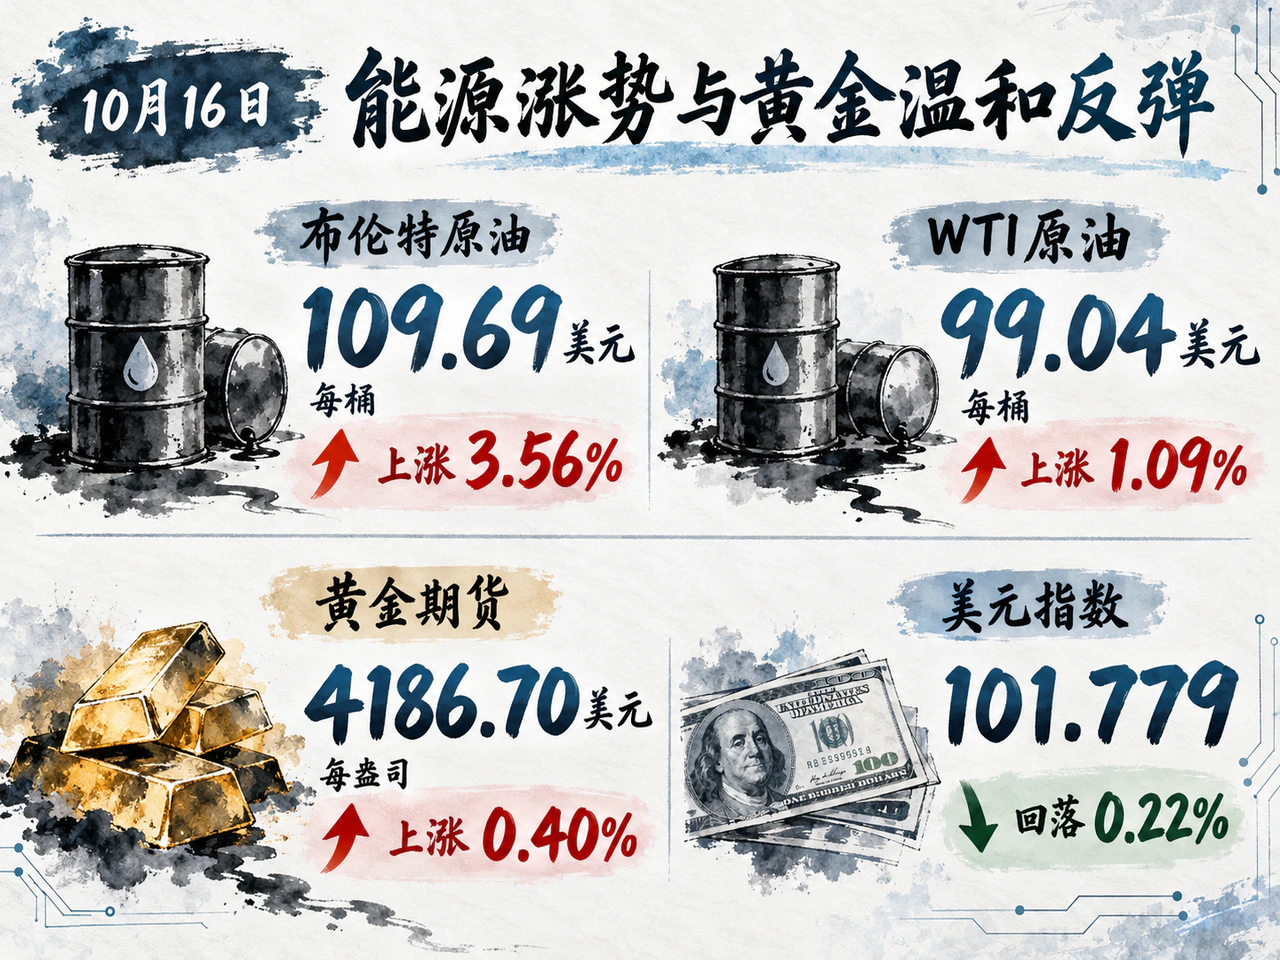
Energy prices continued to rise in commodity markets. On the vendor's continuous-futures daily-close basis, Brent rose 3.56% on October 16 to $109.69 a barrel, while WTI gained 1.09% to $99.04. Since October 5 on the same basis, Brent had risen more than 9% from $100.32 and WTI more than 10% from $89.43.
Disrupted Middle Eastern shipping and North American weather jointly tightened near-term crude supply. Reuters cited Kpler data showing average oil transit through Hormuz of 11.62 million barrels a day in the seven days through October 13, only about 68% of the normal baseline. A hurricane also shut some U.S. production, contributing to a larger-than-expected inventory draw. To contain prices, the IEA agreed on October 15 to release more than 20 million barrels of diesel and accelerate previously pledged emergency oil stocks not yet delivered to market. The U.S. government was still considering whether to allow some tankers that had carried sanctioned oil to transport compliant cargoes. Russia's investment envoy also said on Friday that Russia and the United States were working on payment issues for diesel transactions.
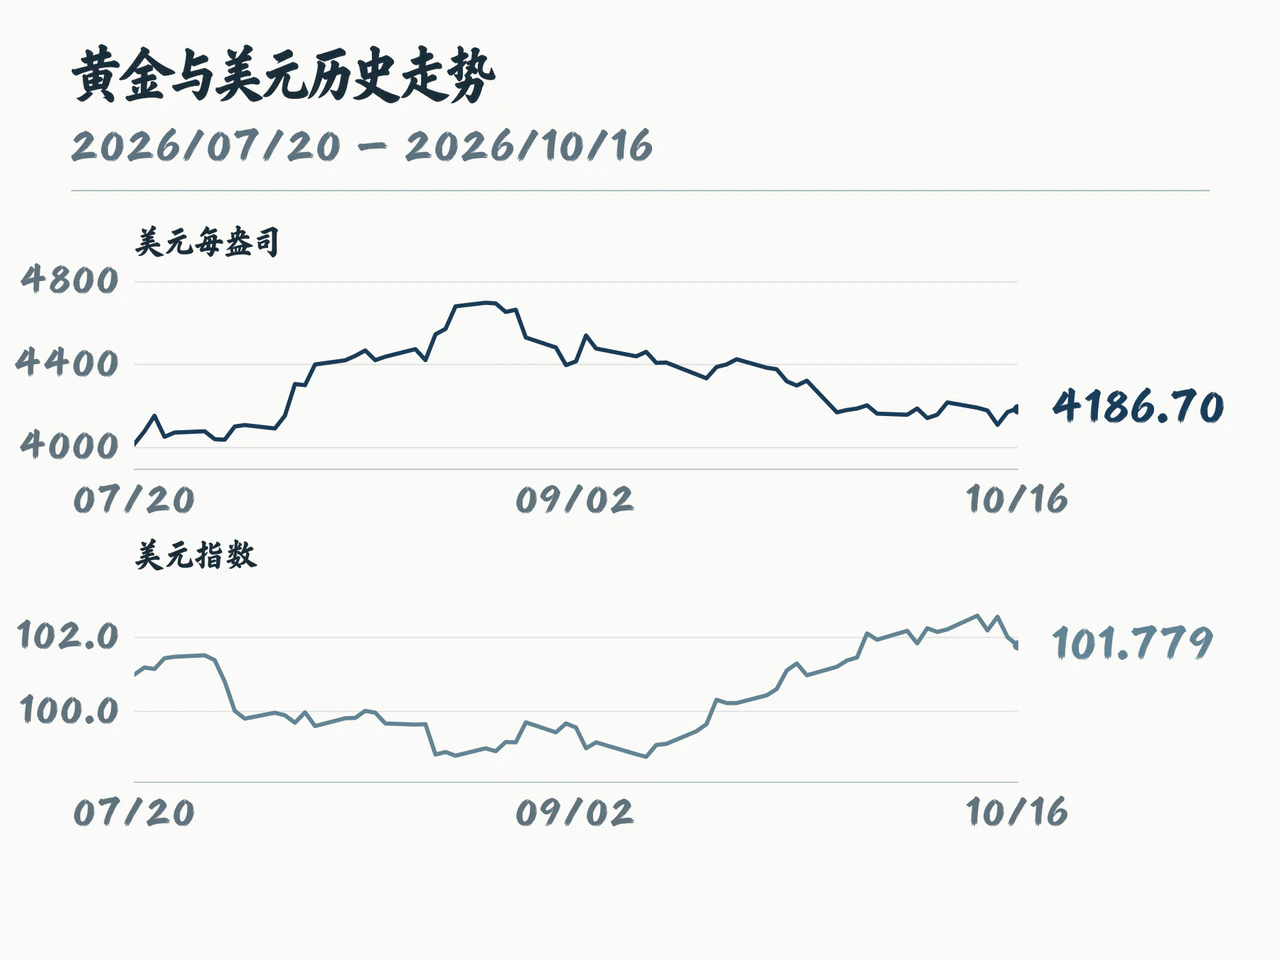
Gold futures rose 0.40% on Friday to $4,186.70 an ounce, extending a moderate rebound from $4,107.90 on October 14, but remaining below the October 9 level of $4,216.30. The dollar index fell 0.22% to 101.779; together with lower short-term Treasury yields, this reduced gold's carrying cost. Reuters cited Macquarie as saying that reduced AI investment expectations could weaken the growth outlook and lower financing needs. ING argued that sustained dollar weakness would still require a larger decline in short-term rates. Reflation risk from expensive oil continued to constrain both declining rates and gold's rebound.
Japanese and Korean stocks rebound with chipmakers before the U.S. selloff; Europe adjusts auto emissions and technology regulation
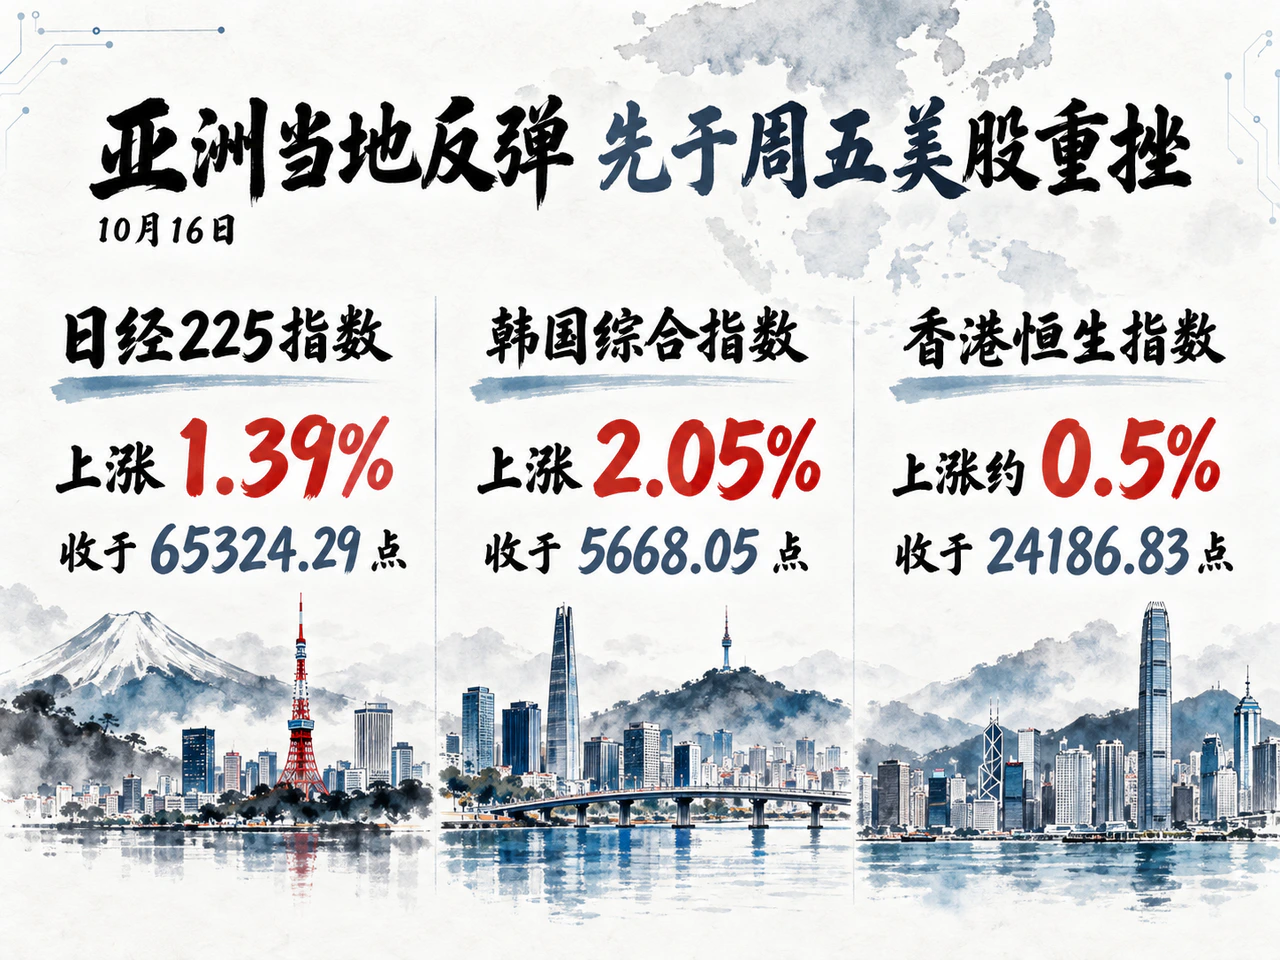
Before Friday's sharp U.S. decline, major Asia-Pacific markets had generally closed higher, following Thursday's U.S. gains and Nvidia CEO Jensen Huang's positive comments on CoreWeave. CNBC and AFP reported that the Nikkei 225 gained 1.39% on Friday to 65,324.29 and South Korea's Kospi rose 2.05% to 5,668.05, led by semiconductor stocks such as SK Hynix and Kioxia. Hong Kong's Hang Seng gained about 0.5% to 24,186.83. With U.S. technology stocks plunging again during Friday's European and U.S. hours, Asian memory-chip, semiconductor-equipment and growth stocks would face renewed valuation pressure.
Sound credit structures provided a defensive buffer in Asian credit. HSBC Asset Management wrote on Friday that investment-grade bonds represented about 87% of the JPMorgan Asia Credit Index, JACI, at the end of July. Shorter duration, ample local financing channels and solid corporate fundamentals supported Asian dollar bonds, contrasting sharply with heavily indebted, capital-intensive AI issuers in Europe and the United States.
Industrial and regulatory policies announced in Europe and Britain that day will reshape the long-term operating environment for multinational automakers and technology giants. France and Germany agreed on Friday on an auto-industry proposal to strengthen local-content requirements and support changing the 2035 new-vehicle emissions reduction target relative to 2021 to 90%. The remaining 10% would not require the separate compensation envisaged in the European Commission's original proposal. Coordination with other EU members was still required, but the proposal clearly signaled a slower transition to all-electric vehicles and stronger protection for local supply chains.
The same day, Britain's Competition and Markets Authority proposed designating Microsoft as having strategic market status in the business-software ecosystem and opened a public consultation. It focused on competition between Copilot and other AI tools, security-software bundling, and software-licensing restrictions on customers' choice of cloud platform. The CMA also said Microsoft and Amazon AWS had made progress in reducing cross-cloud data-transfer fees and simplifying migration. Regulatory changes to software licensing and cloud-switching costs will be important variables for the giants' cloud margins.
In China, the National Bureau of Statistics' 2025 science and technology spending bulletin, released on Friday, showed full-year R&D expenditure of RMB3.92882 trillion, up 8.2% year on year and equivalent to 2.80% of GDP. Enterprises accounted for 77.4% of R&D spending, continuing to support industrial upgrading over the medium and long term. Progress in the near-term recovery of aggregate demand and earnings awaited further confirmation from China's first-three-quarter economic release, scheduled for 10 a.m. Beijing time on October 19.


