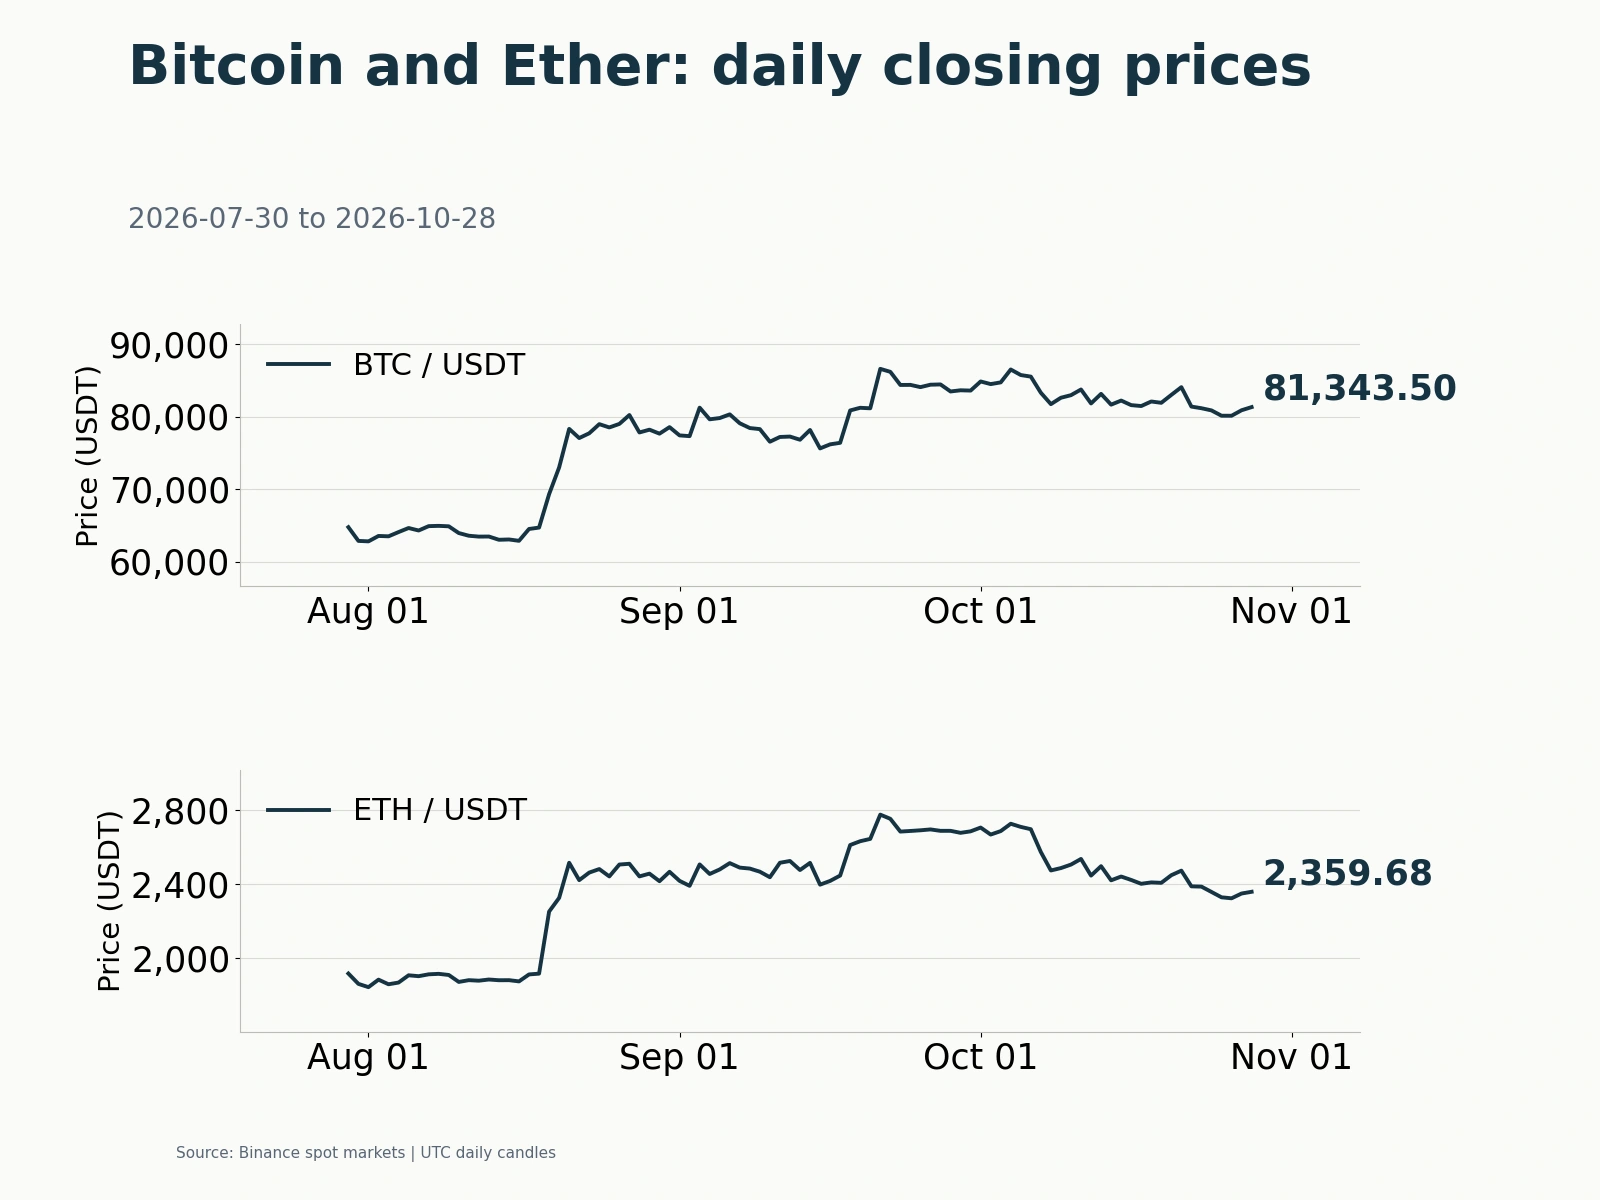
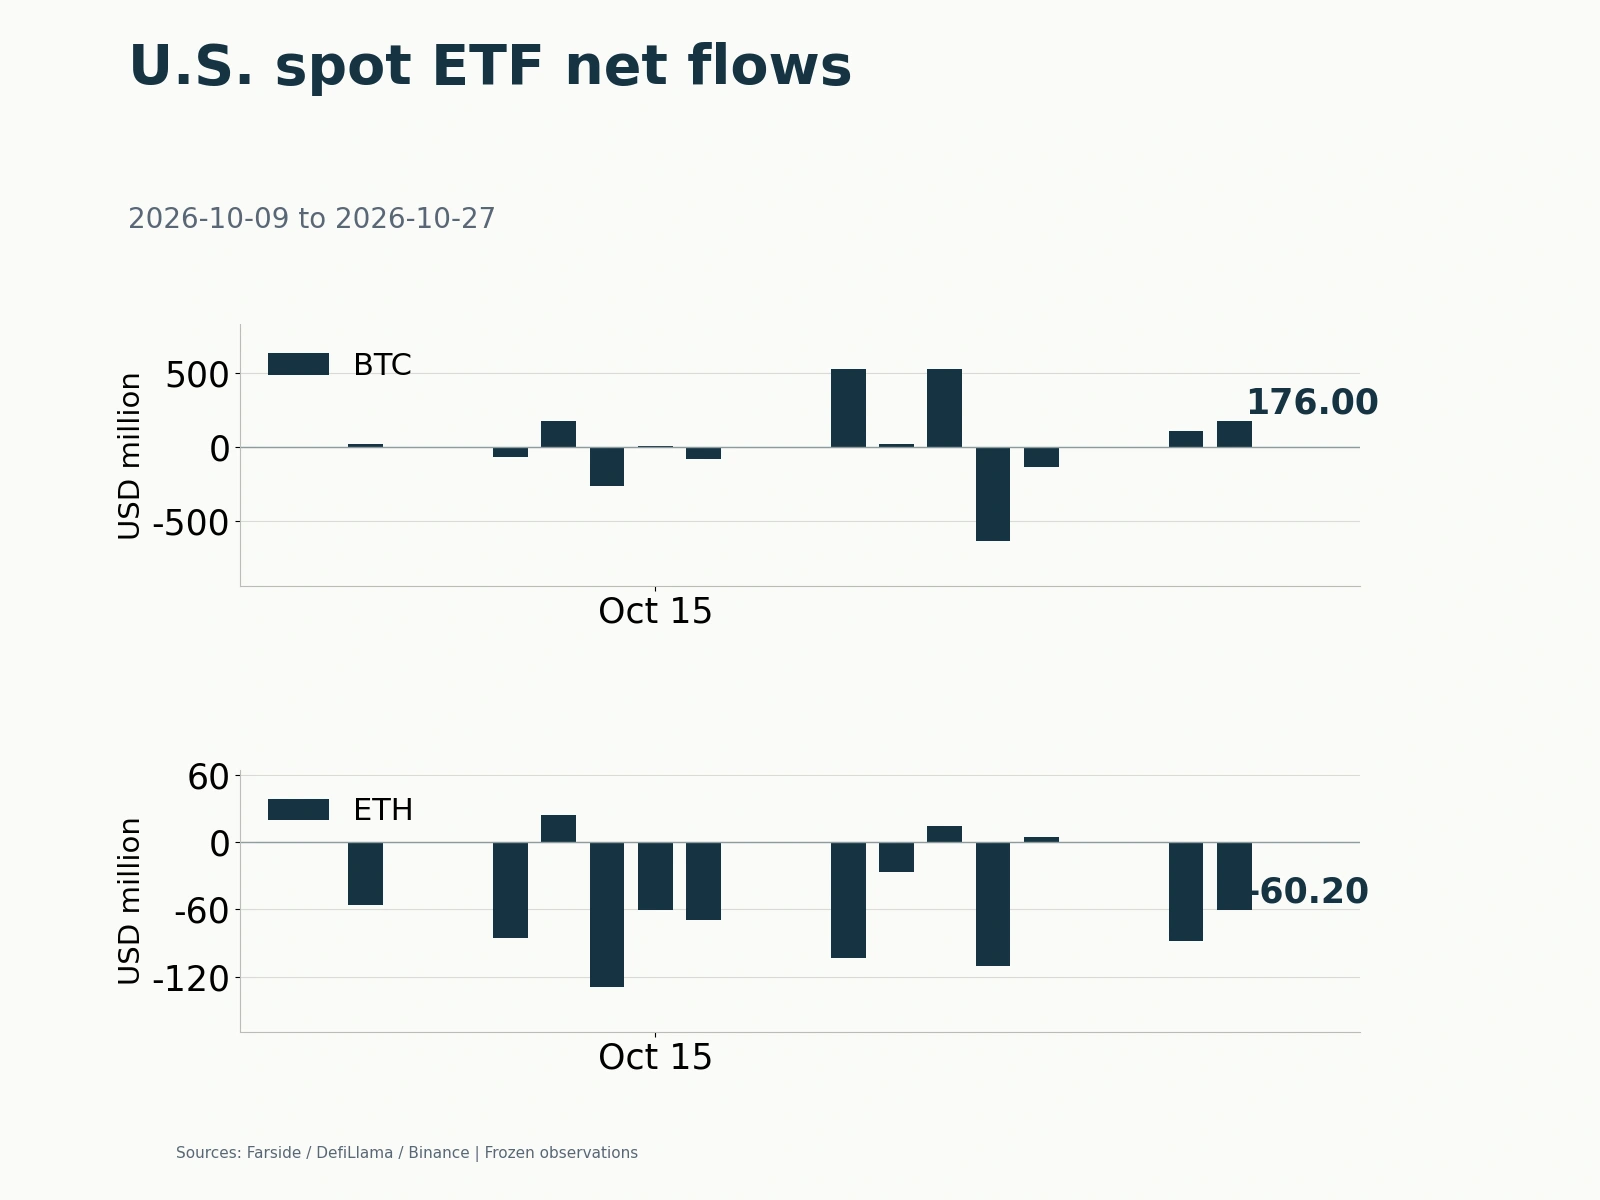
Capital outflows from crypto slowed last week, but spot buying remained weak and derivatives long leverage showed no clear washout. During October 12–16, US spot Bitcoin and Ethereum ETFs recorded combined net outflows of $548.5 million, less than half the previous week's $1.2211 billion. Over the same period, circulating on-chain dollar stablecoin supply fell by $1.445 billion, while cumulative Binance perpetual funding rates actually increased. The lack of sustained spot buying and the persistence of long positions within the market kept it highly sensitive to macroeconomic news shocks.
Bitcoin ETF Redemptions Fall 66%; Ethereum ETFs Lose More Than $1 Billion over Three Straight Weeks

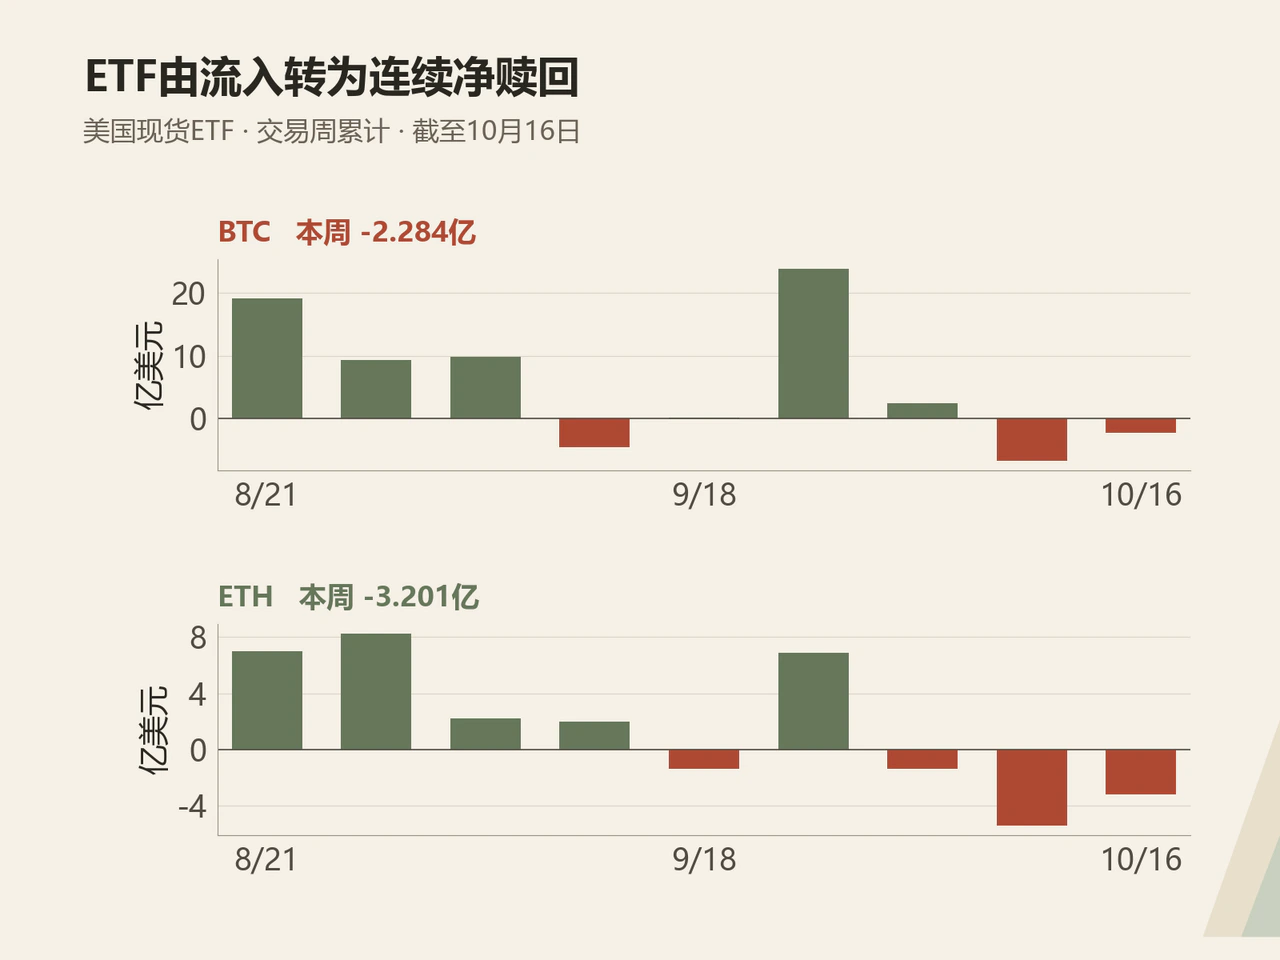
Adding Farside's daily figures, US spot Bitcoin ETFs lost a net $228.4 million last week, approximately 66% below the previous week's $678.9 million. Spot Ethereum ETFs lost $320.1 million, approximately 41% below the preceding week's $542.2 million. Despite the slower pace of redemptions, both categories had recorded net outflows for two consecutive weeks, with Ethereum ETFs experiencing their third straight week of net redemptions.
The pattern within the week showed Ethereum had a much weaker funding cushion than Bitcoin. Bitcoin ETFs still saw a substantial one-day return of funds, with net inflows of $175.7 million on Tuesday. But Wednesday's $261.4 million net outflow exceeded the entire week's net withdrawal, reversing the week's flow direction in one session. Ethereum ETFs experienced net redemptions on four of the five trading days; Tuesday's inflow was just $24.8 million, while Wednesday through Friday saw combined outflows of $259.5 million. Episodic buying failed to become sustained subscriptions.
Redemption pressure was concentrated in leading products. Among Ethereum ETFs, BlackRock's ETHA lost a net $299.0 million for the week, overwhelming Fidelity FETH's $10.5 million net inflow. Among Bitcoin ETFs, BlackRock IBIT and Fidelity FBTC lost $165.4 million and $60.2 million, respectively. Position reductions by a small number of large funds dominated overall flows.
Over a nine-week horizon, these withdrawals represent an ebb after September's surge in allocation demand. Bitcoin ETFs attracted $2.3858 billion in the week ended September 25, before inflows slumped to $241.1 million the following week and turned into net outflows in each of the latest two weeks. Ethereum ETFs likewise shifted from $689.8 million of weekly net inflows to three consecutive weeks of net redemptions totaling $1.0004 billion. Until new subscriptions become sustained, existing holders' reductions in exposure will continue to limit the scope for a short-term rebound.
Stablecoin Supply Falls $1.445 Billion in a Week; Persistent Long Leverage Raises Liquidation and Volatility Pressure

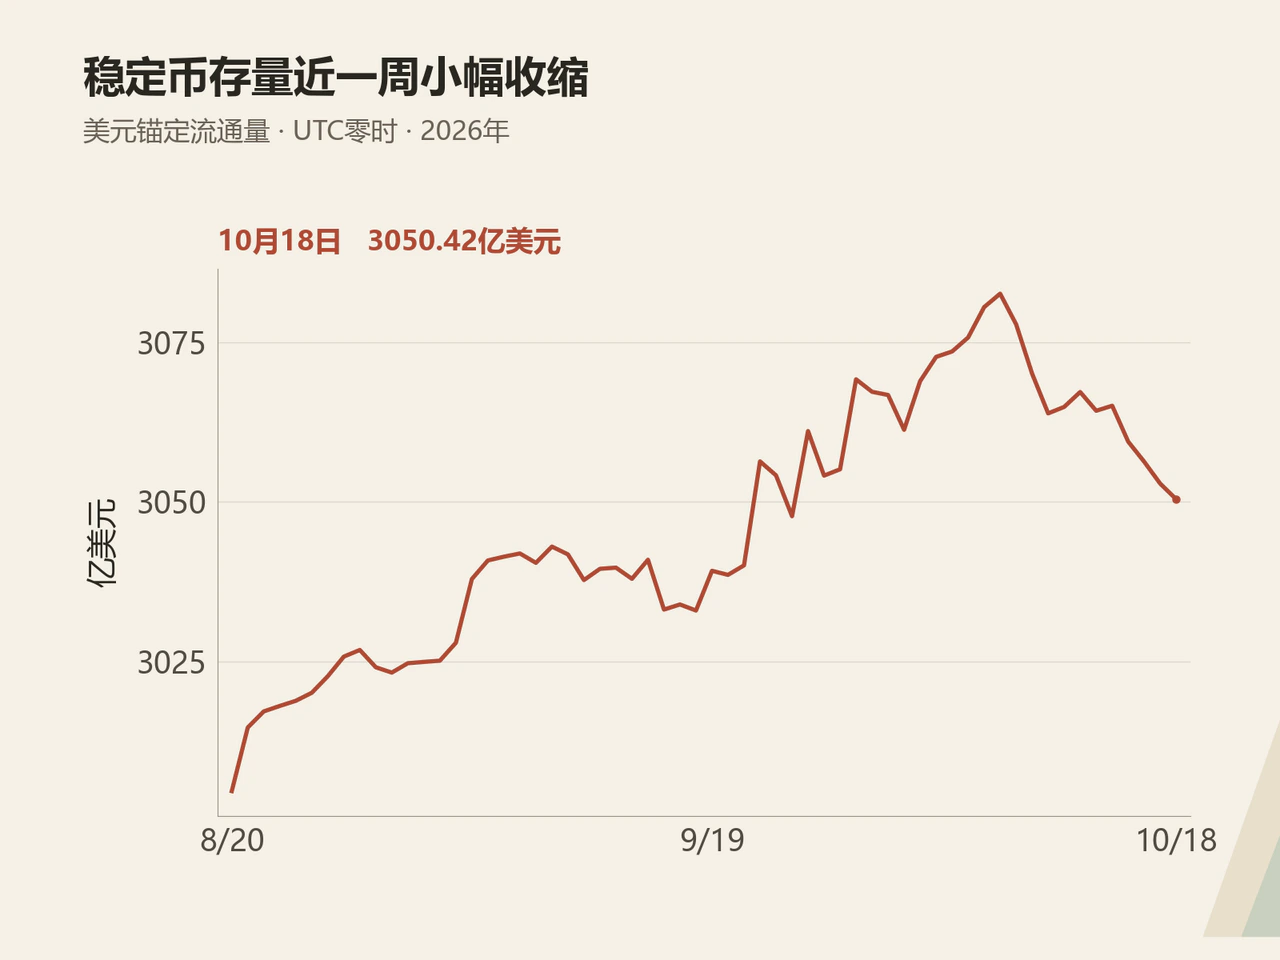
Dollar liquidity within the market also lacked new inflows. Using circulating dollar-pegged stablecoins in DefiLlama's historical API, supply stood at $305.042 billion at 00:00 UTC on October 18, down $1.445 billion, or approximately 0.47%, from October 11. The dollar balance available for on-chain deployment thus contracted slightly. It nevertheless remained above the September 18 level of $303.299 billion, suggesting that stablecoin supply growth had recently stalled rather than contracted throughout the entire month.
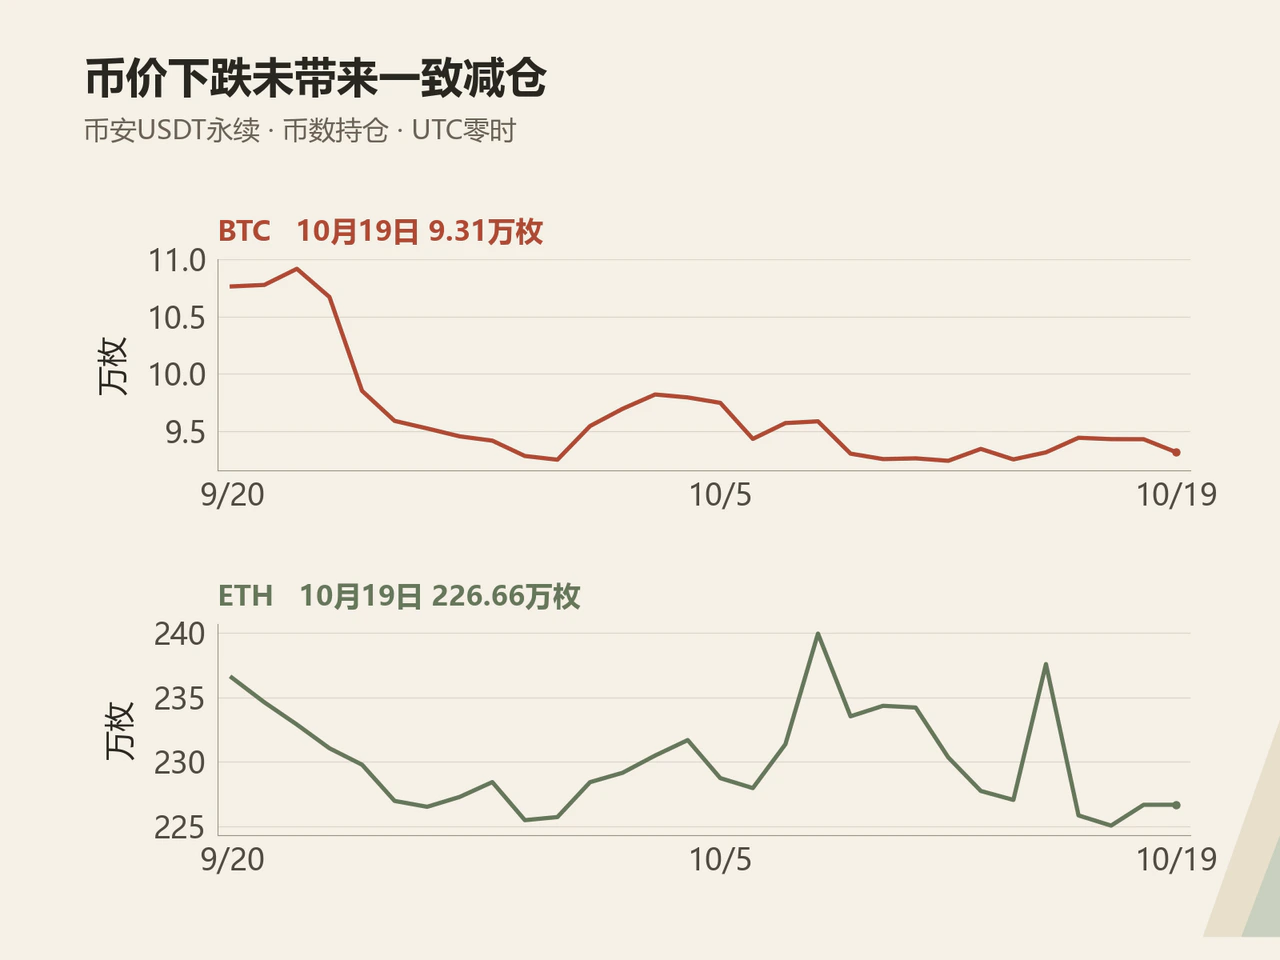
Unlike the caution in spot flows and stablecoins, perpetual longs did not retreat in tandem. Comparing 00:00 UTC on October 12 and October 19, Binance BTCUSDT perpetual open interest rose from 92,380 BTC to 93,130 BTC, approximately 0.81%, while dollar notional open interest fell roughly 1.16% because of lower coin prices. This shows that contract positions were still entering as prices declined. ETHUSDT perpetual open interest measured in coins fell approximately 1.60%, while dollar notional open interest dropped about 6.51%, with falling coin prices likewise magnifying the notional decline.
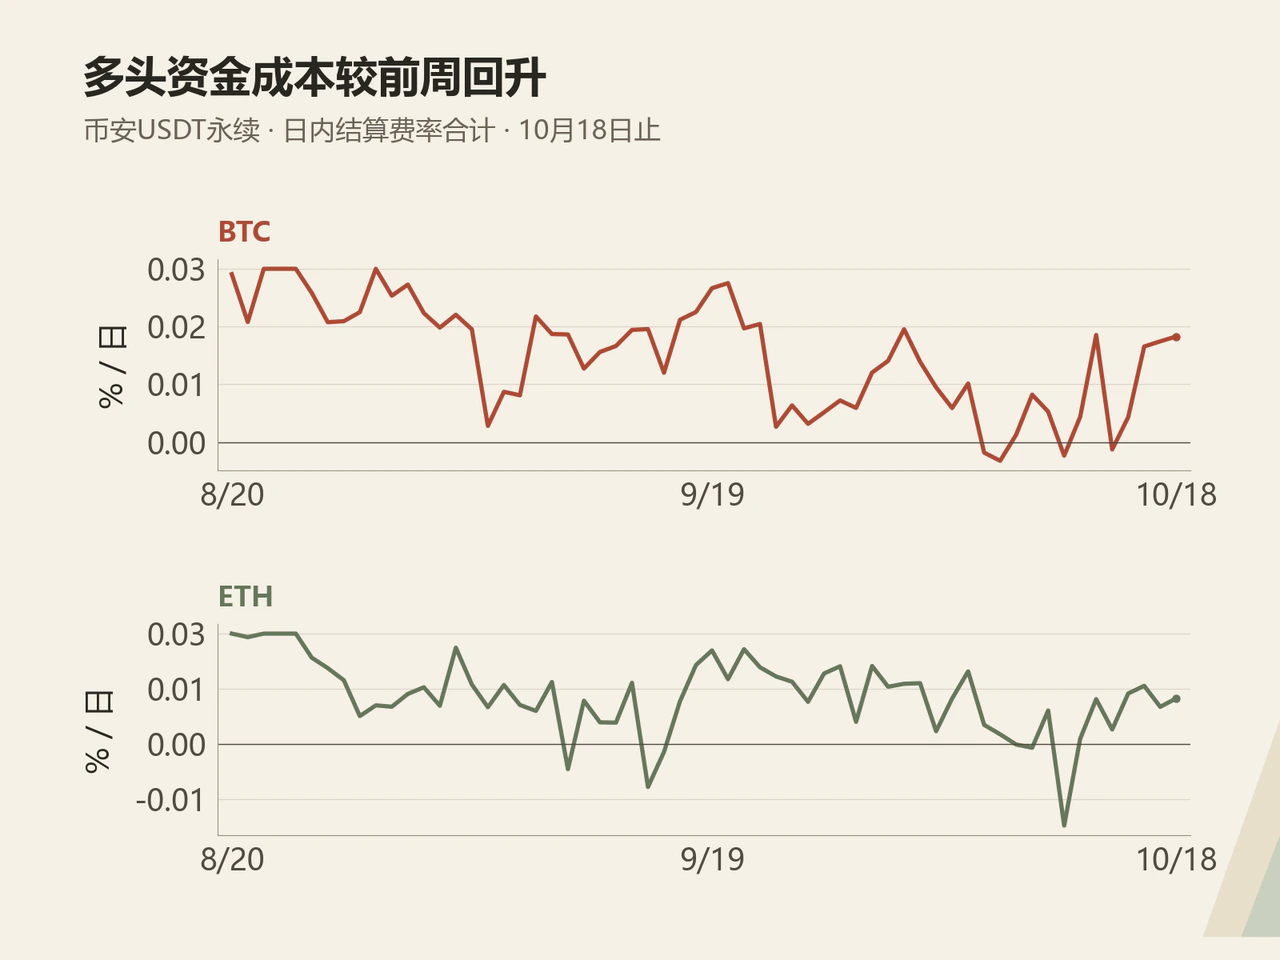
Funding rates further confirmed that longs had not exited. Of last week's 21 funding settlements, Binance BTCUSDT and ETHUSDT perpetuals each recorded only three negative readings. Their simple cumulative rates reached 0.0782% and 0.0694%, respectively, substantially above the previous week's 0.0174% and 0.0131%. Longs maintaining the same notional exposure therefore faced higher funding costs while also enduring price drawdowns.
The mismatch between spot capital withdrawals and retained long exposure quickly became liquidation pressure under the midweek macro shock. CryptoQuant analyst Darkfost said on October 15 that Binance ETH longs had suffered approximately $106 million in notional liquidations within an hour of the US inflation release. Research by Block Scholes the same day also linked the broad decline in risk assets to higher-than-expected inflation, noting that its ETH risk-appetite indicator was declining but remained in bullish territory.
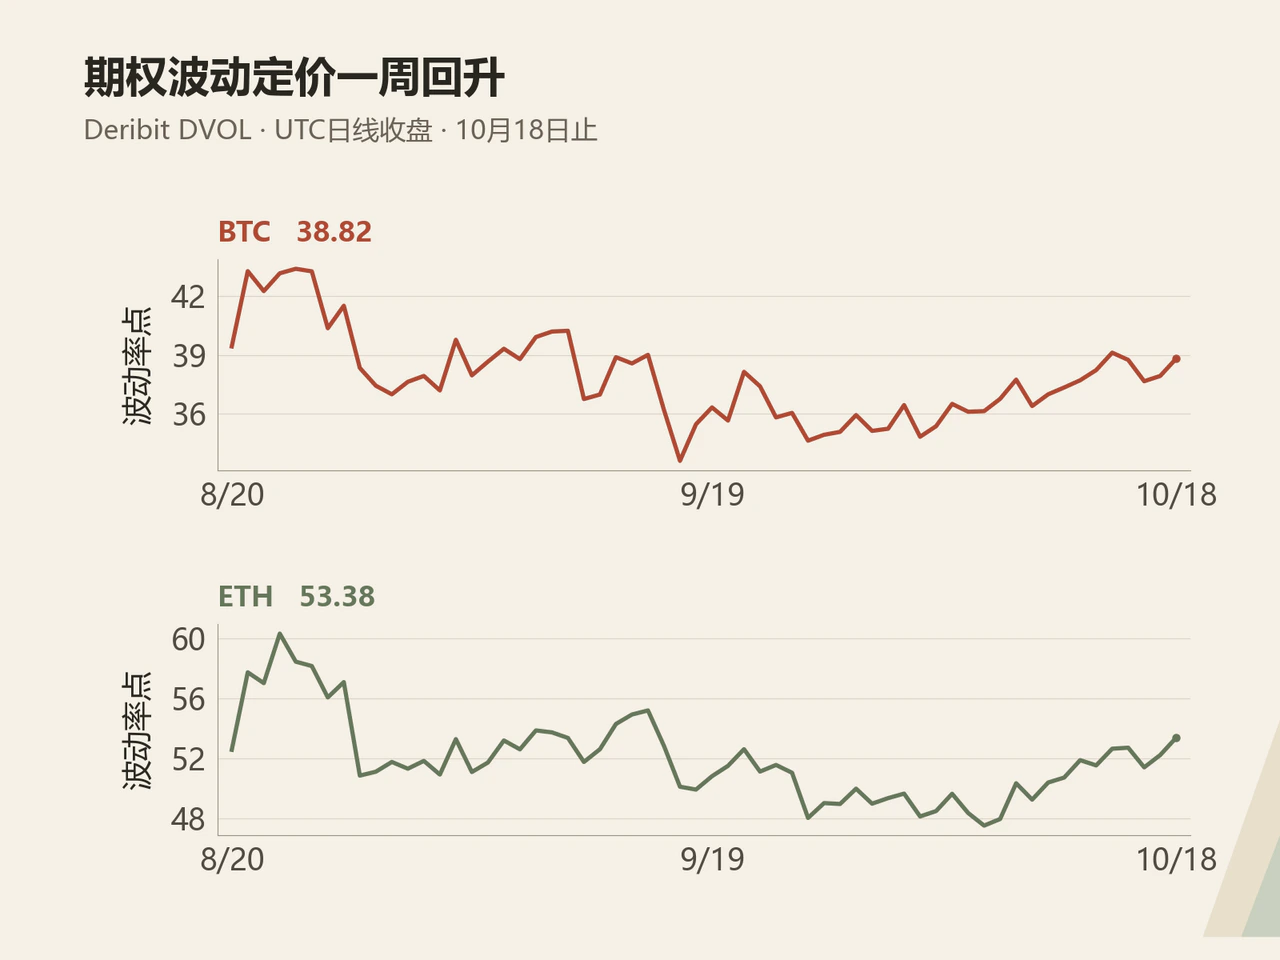
Options markets consequently raised their pricing of volatility. The daily close of Deribit's BTC volatility index increased from 37.34 on October 11 to 38.82 on October 18, while the ETH index rose from 50.72 to 53.38. Until ETF subscriptions become sustained, stablecoin supply stabilizes, and derivatives positions come back into alignment with spot demand, the elevated burden on longs can readily amplify market volatility through margin constraints.
Click Read Original for full details.